Indexed In
- Genamics JournalSeek
- Academic Keys
- JournalTOCs
- China National Knowledge Infrastructure (CNKI)
- Access to Global Online Research in Agriculture (AGORA)
- Centre for Agriculture and Biosciences International (CABI)
- RefSeek
- Directory of Research Journal Indexing (DRJI)
- Hamdard University
- EBSCO A-Z
- OCLC- WorldCat
- Scholarsteer
- SWB online catalog
- Publons
- Euro Pub
- Google Scholar
Useful Links
Share This Page
Journal Flyer

Open Access Journals
- Agri and Aquaculture
- Biochemistry
- Bioinformatics & Systems Biology
- Business & Management
- Chemistry
- Clinical Sciences
- Engineering
- Food & Nutrition
- General Science
- Genetics & Molecular Biology
- Immunology & Microbiology
- Medical Sciences
- Neuroscience & Psychology
- Nursing & Health Care
- Pharmaceutical Sciences
Mini Review - (2024) Volume 15, Issue 5
Vitamin supplements and nutrition: Impact on the urine fluorescence spectrum
Praveen Chalissery1,2, Christian Homann1,2,3* and Ronald Sroka1,22Department of Urology, University Hospital LMU Munich, Munich, Germany
3FerroSens GmbH, Sylvensteinstrasse, Munich, Germany
Received: 22-Oct-2024 Editor assigned: 25-Oct-2024 Reviewed: 08-Nov-2025 Revised: 15-Nov-2025 Published: 22-Nov-2025, DOI: 10.35248/2157-7110.24.15.1123
Abstract
Food, vitamins as well as health conditions can influence the color of human urine, which might affect the urine fluorescence spectrum. As fluorescence spectroscopy of human urine could be used as diagnostic tool in the medical field, for example as a screening method for cancer or porphyria through the measurement of Coproporphyrin III (CPIII), altered urine color could lead to misinterpretation and false diagnostic results. So, the investigation of vitamin supplements and food items on the urine fluorescence spectrum could prevent misinterpretation of findings. Among the investigated substances, such as water- and fat-soluble vitamins and food, intake of vitamin B2 had noticeable effect on the urine fluorescence spectrum. Interference with the recovery rate of CPIII was not found among any investigated substance. Therefore, it is recommended to avoid vitamin B2 supplementation before fluorescence spectroscopy on human urine is used as diagnostic procedure. With regard to CPIII as target marker, CPIII concentrations in urine could be accurately determined in all tested cases.
Keywords
Fluorescence spectroscopy; Vitamin B2; Urine fluorescence spectrum; Coproporphyrin III; Cancer
Introduction
One of various possibly advantageous and beneficial diagnostic tools in the medical sector could be fluorescence spectroscopy of human fluids such as urine. Urine fluorescence spectroscopy has a wide range of use, especially detecting porphyria attacks through Coproporphyrin III (CPIII) levels or diagnosing and characterizing cancer types by utilizing specific biomarkers [1-5]. Research conducted by Kamada et al., explored that two specific biomarkers, CPIII and Uroporphyrin I (UPI), can be investigated by urine fluorescence spectroscopy to detect Colorectal Cancer (CRC). Patients with CRC who ingested 5-Aminolevulinic Acid (5-ALA) had significantly higher urinary porphyrin levels such as CPIII and UPI compared to healthy controls. These elevated levels decreased significantly four weeks after CRC resection [6].
The previous mentioned studies have not considered factors that could interfere with urine fluorescence spectrum, potentially causing misinterpretation of findings. Vitamins and food as well as bacterial infections and other diseases can affect the color of urine [7-10]. In light of these considerations, this review summarizes research by Chalissery et al., whether common vitamins (e.g., A, B1-12, C, D, E, K1 and K2) and some foods known to alter urine color (e.g., beetroot) affect the fluorescence spectrum and the accuracy of CPIII concentration measurements in urine [11].
Literature Review
It is known that nutrition and vitamin supplements have impact on the color and odor of urine: Multivitamin supplements may cause a bright yellow urine color due to vitamin B2 and B12 [7,9,12]. Blue-green urine color may occur after intake of spinach and intake of asparagus may change urine’s odor [9,13].
Urine contains several fluorophores that add to undesirable background fluorescence, possibly due to the patient’s diet and metabolism [14]. A study conducted by Zellweger et al., addresses the issue of disruptive factors while conducting Fluorescence Cystoscopy (FC). FC is a technique used for identification and therapy of bladder cancer. Water is required to perform FC. If the urine mixes with that water, the whole fluid becomes fluorescent as well, decreasing quality of FC images. Background fluorescence should be minimized as much as possible, to obtain optimal fluorescence images during diagnostic FC [14].
Chalissery et al., investigated vitamin supplements to find out if and which vitamin can be a fluorophore in urine. Moreover, possible interference between nutrition and vitamin supplements and the detection of urinary CPIII concentration was analyzed [11].
Discussion
According to Zellweger et al., it is unknown which concrete parts of the diet causes or might contribute to the background fluorescence of human urine affecting the FC quality. Such fluorophores can be metabolites like amino acids, (e.g. Phenylalanine, tryptophane and tyrosine) or neurotransmitters such as serotonine, but also vitamins and other substances [15]. The authors focused on vitamins as one potential factor of fluorophores by investigation with Over- The-Counter (OTC) vitamin supplements. The dynamics in urine fluorescence spectrum of nine healthy volunteers (Age: 24 to 70 years) before, during and after consuming an OTC vitamin supplement were investigated by analyzing excitation-emission matrices. Fluorescence levels peak 8 h to 10 h after consumption of OTC supplement, decline over the following 12 h and normalize back to baseline levels approximately 24 h later. The authors explain that one source of these fluorophores is the group of B-vitamins, particularly vitamins B2, B6 and B12, which are found in OTC vitamin supplements such as the one used in the study. Therefore, the authors recommend refraining from using OTC vitamin supplements in the week leading up to an FC to prevent degradation of fluorescence image quality [14].
Although the B-vitamins are suspected in the mentioned study, it still remains unclear which particular vitamin or food has influence on the urine fluorescence spectrum and whether it affects the detection of CPIII concentration in urine, which may lead to misinterpretation of findings. Chalissery et al., investigates the impact of various substances on urine fluorescence spectra and the determination of CPIII in the context of urine fluorescence spectroscopy in more detail. Sixteen vitamin supplements and three foods were evaluated for their effects on the urine fluorescence spectrum. These included high-dose water-soluble vitamins (B1- 12 and C), fat-soluble vitamins (A, D, E, K1, K2) and foods like beetroot, spinach and asparagus. The supplements and foods were chosen to examine as some of them are known to change the color and odor of urine, thus being potential candidates affecting fluorescence measurements (Table 1) [11].
| Supplement/Food | Description | Dose per person (mg) |
|---|---|---|
| Vitamin A | Retinyl acetate (Sunday Natural Products, Berlin, Germany) | 3 mg |
| Vitamin B Complex | Thiamin HCl | 40 mg |
| Riboflavin-5-Sodiumphosphate | 20 mg | |
| Nicotinamide | 100 mg | |
| D-Calcium-Panthotenic acid | 50 mg | |
| Pyridoxal-5-Phosphate | 20 mg | |
| D-Biotin | 0.5 mg | |
| 6S-5-Methyltetrahydrofolat-Glucosaminesalt, Calcium-L-Methylfolic acid | 0.4 mg | |
| Methylcobalamin, Hydroxocobalamin, Adenosylcobalamin | 0.3 mg | |
| Citicholine | 10 mg | |
| Trimethylglycine-Betaine | 50 mg | |
| Myo-Inositol | 25 mg | |
| (Sunday Natural Products, Berlin, Germany) | ||
| Vitamin B1 | Thiaminhydrochlorid (Nutraceutical Corp., Park City, Utah, USA) | 100 mg |
| Vitamin B2 | Riboflavin-5-Sodiumphosphate (Sunday Natural Products, Berlin, Germany) | 100 mg |
| Vitamin B3 | Nicotinamide (Sunday Natural Products, Berlin, Germany) | 500 mg |
| Vitamin B5 | D-Calcium-Pantothenic acid (Sunday Natural Products, Berlin, Germany) | 500 mg |
| Vitamin B6 | Pyridoxal-5-Phosphate-Monohydrate (Sunday Natural Products, Berlin, Germany) | 25 mg |
| Vitamin B7 | D-Biotin (Sunday Natural Products, Berlin, Germany) | 10 mg |
| Vitamin B9 | L-Methyl-folic acid (Sunday Natural Products, Berlin, Germany) | 0.4 mg |
| Vitamin B12 | Cyanocobalamin (Queisser Pharma, Flensburg, Germany) | 0.35 mg |
| Vitamin C | Ascorbic acid (Sunday Natural Products, Berlin, Germany) | 1000 mg |
| Vitamin D | Cholecalciferol (Queisser Pharma, Flensburg, Germany) | 0.05 mg |
| Vitamin E | Alpha-Tocopherol-Acetate (Euro Vital Pharma, Hamburg, Germany) | 600 mg |
| Vitamin K1 | Phytomenadione (Gall Pharma, Judenburg, Austria) | 0.06 mg |
| Vitamin K2 | Vitamin K2 MK7 all-trans (Sunday Natural Products, Berlin, Germany) | 0.2 mg |
| Alpha-lipoic acid | R-Alpha-lipoic acid (Vitabay, Maastricht, Netherlands) | 300 mg |
| Beetroot | Portion of a normal meal | 200000 mg |
| Spinach | Portion of a normal meal | 200000 mg |
| Asparagus | Portion of a normal meal | 200000 mg |
Table 1: Vitamin supplements and food consumed in the study [11].
In total, eight volunteers participated, seven being male and one female, ranging in age from 22 to 64 years. Three volunteers gave urine samples for each tested supplement. Samples were collected in the evening before intake of supplement and overnight after intake of supplement approximately 8 h later [11]. Furthermore, a CPIII stock solution was created by using 1 mg CPIII dihydrochloride salt powder (Santa Cruz Biotechnology Inc.) and adding 10 mL of 2.5 M HCl and 40 mL 50% acetic acid. Three CPIII reference solutions with dilutions of 1:50, 1:100 and 1:200 were created out of the CPIII stock solution. Urine samples were spiked with these CPIII reference solutions to determine the effects of supplements on CPIII recovery (Figure 1) [11].
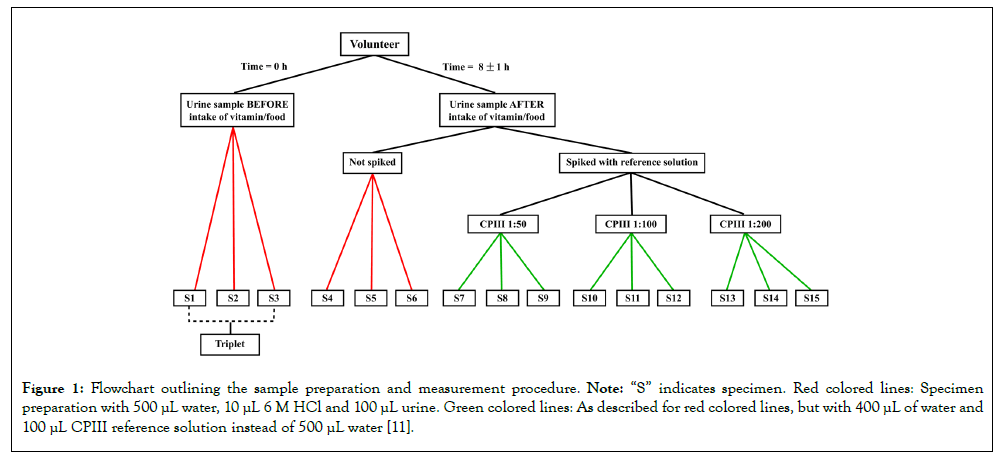
Figure 1: Flowchart outlining the sample preparation and measurement procedure. Note: “S” indicates specimen. Red colored lines: Specimen preparation with 500 μL water, 10 μL 6 M HCl and 100 μL urine. Green colored lines: As described for red colored lines, but with 400 μL of water and 100 μL CPIII reference solution instead of 500 μL water [11].
Urine samples and CPIII reference solutions were prepared in specific proportions with hydrochloric acid and water (500 μL HPLC water, 10 μL HCl 6 mol/L, 100 μl of urine sample). Fluorescence spectra were measured using a prototype spectrofluorometer (FerroSens GmbH, Munich, Germany), in the emission wavelength range of 490-800 nm at an excitation wavelength of 407 nm. Fluorescence intensity at 518 nm ± 3 nm was analyzed to assess inter- and intra-individual variations. This wavelength was chosen due to its prominence in control samples. Please note that this is just an artificial maximum, as it is caused by the transmission slope of the device’s long pass filter. Excitation-Emission Matrices (EEM) were additionally conducted at excitation wavelengths from 300- 500 nm and emission wavelengths from 400-700 nm [11].
CPIII recovery rates were calculated by dividing the measured CPIII concentration in spiked urine with CPIII concentration in reference solutions [11]. Based on EMA guidelines recovery rates in a range of 0.85 to 1.15 could be acceptable [11,16,17].
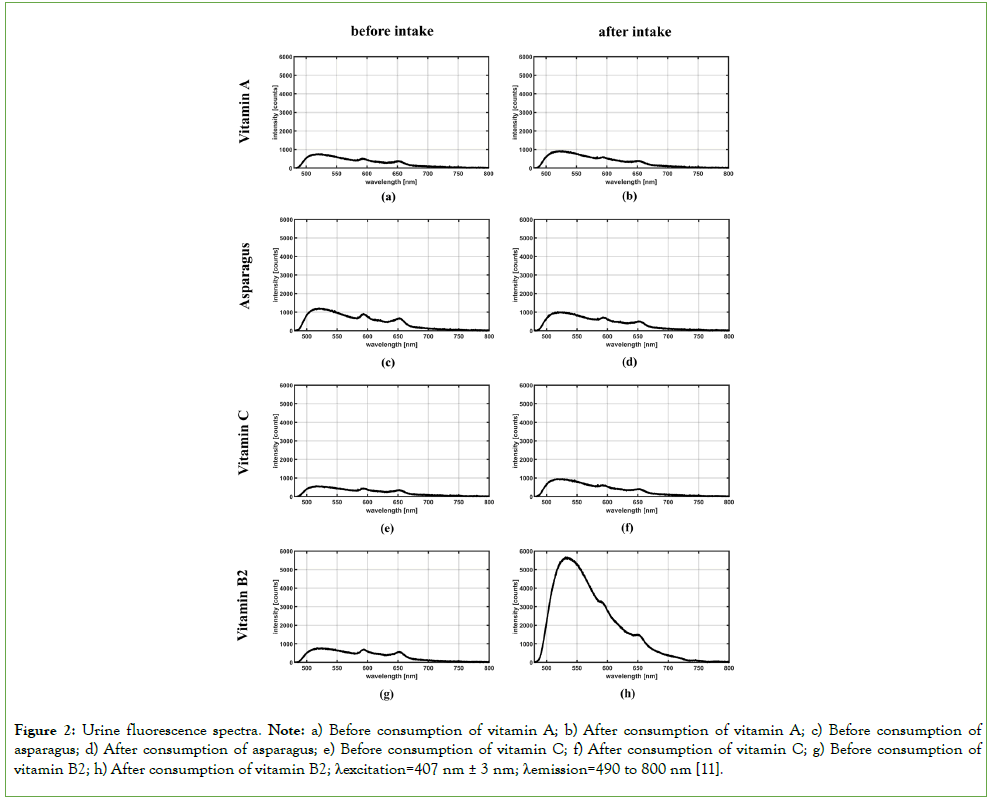
Unspiked urine samples from healthy volunteers, prepared in an acidic environment, showed an unstructured fluorescence spectrum, with three maxima related to CPIII at the wavelength 595 nm, 620 nm and 650 nm. Intake of vitamin B2 caused an approximately sevenfold increase and a shift in the artificial maximum to approximately 535 nm (Figure 2). No notable changes in the urine fluorescence spectrum were observed when testing the other supplements, including fat-soluble vitamins and foods (spinach, asparagus and beetroot) [11].
Figure 2: Urine fluorescence spectra. Note: a) Before consumption of vitamin A; b) After consumption of vitamin A; c) Before consumption of asparagus; d) After consumption of asparagus; e) Before consumption of vitamin C; f) After consumption of vitamin C; g) Before consumption of vitamin B2; h) After consumption of vitamin B2; λexcitation=407 nm ± 3 nm; λemission=490 to 800 nm [11].
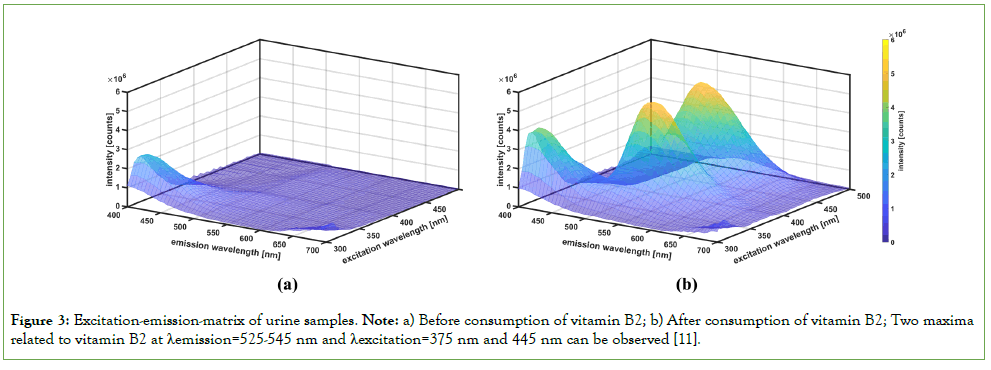
EEM analysis showed two fluorescence maxima related to vitamin B2 at excitation wavelengths of 375 nm and 445 nm, with emission wavelengths between 525 nm and 545 nm (Figure 3) [11].
Figure 3: Excitation-emission-matrix of urine samples. Note: a) Before consumption of vitamin B2; b) After consumption of vitamin B2; Two maxima related to vitamin B2 at λemission=525-545 nm and λexcitation=375 nm and 445 nm can be observed [11].
Furthermore, Chalissery et al. investigated CPIII recovery rates in spiked urine samples. Most recovery rates fell within the acceptable range (0.85-1.15). However, a few outliers were observed, particularly with urine samples after intake of certain vitamins and spinach. Recovery rates out of the acceptable range for some samples were attributed to measurement errors or naturally lower CPIII concentrations, as after intake of spinach (Table 2) [11].
| Supplement/Food | CPIII 1:50 | CPIII 1:100 | CPIII 1:200 |
|---|---|---|---|
| Vitamin A | 0.93 | 1.01 | 1.2 |
| Vitamin B Complex | 1.07 | 1.07 | 1.18 |
| Vitamin B1 | 0.97 | 1.29 | 1.04 |
| Vitamin B2 | 1.01 | 0.99 | 1.12 |
| Vitamin B3 | 1.05 | 1.14 | 1.19 |
| Vitamin B5 | 0.91 | 0.89 | 0.95 |
| Vitamin B6 | 0.89 | 0.87 | 0.96 |
| Vitamin B7 | 0.86 | 0.91 | 0.91 |
| Vitamin B9 | 1.08 | 1.22 | 1.09 |
| Vitamin B12 | 1.01 | 1.11 | 1 |
| Vitamin C | 0.92 | 0.96 | 1 |
| Vitamin D | 0.92 | 0.98 | 0.92 |
| Vitamin E | 0.96 | 1 | 1.01 |
| Vitamin K1 | 0.96 | 0.99 | 1.09 |
| Vitamin K2 | 0.94 | 1 | 1.03 |
| Alpha-lipoic acid | 0.89 | 0.89 | 1 |
| Beetroot | 0.93 | 1.05 | 1.13 |
| Spinach | 0.8 | 0.81 | 0.84 |
| Asparagus | 0.92 | 1.12 | 1.03 |
| Pure urine | 1.01 | 0.9 | 1 |
Table 2: Calculated CPIII recovery rates for urine samples after intake of supplement. The majority of CPIII recovery rates are within the accepted range of 0.85 to 1.15. [11].
The results indicate that only vitamin B2 has a notable effect on the urine fluorescence spectrum, requiring its avoidance prior to an FC to prevent interference. No notable effect on CPIII concentration measurement in urine was noticed for any of the tested substances, implying that they can be consumed without affecting the accuracy and reliability of CPIII quantification in urine. This applies to the particular excitation and emission wavelengths tested [11].
Conclusion
The findings of the study by Chalissery et al. conclude that vitamin B2 affects the intensity of the urine fluorescence spectrum in the tested wavelengths. The overall determination of CPIII concentration in urine remains consistent regardless of all tested substances.
Nevertheless, further elaborate investigation is recommended. Firstly, a study with a significantly larger number of volunteers should validate the results. Secondly, it would be helpful to perform time related urine fluorescence spectrum measurements after vitamin B2 intake in order to precisely restrict vitamin B2 intake prior to fluorescence spectroscopy.
Acknowledgments
This work was financially supported by the University Hospital of LMU Munich, Munich, Germany. We thank FerroSens GmbH, Munich, Germany, for supply of the prototype spectrofluorometer. Chalissery and his co-authors. DOI: https://doi.org/10.1002/ lsm.23785
References
- Lang A, Heckl C, Vogeser M, Stauch T, Homann C, Hennig G, et al. Rapid spectrophotometric quantification of urinary porphyrins and porphobilinogen as screening tool for attacks of acute porphyria. J Biomed Opt. 2018;23(5):055006.
[Crossref] [Google Scholar] [PubMed]
- Dou J, Dawuti W, Zheng X, Zhang R, Zhou J, Lin R, et al. Urine fluorescence spectroscopy combined with machine learning for screening of hepatocellular carcinoma and liver cirrhosis. Photodiagnosis Photodyn Ther. 2022;40:103102.
[Crossref] [Google Scholar] [PubMed]
- Rajasekaran R, Aruna PR, Koteeswaran D, Padmanabhan L, Muthuvelu K, Rai RR, et al. Characterization and diagnosis of cancer by native fluorescence spectroscopy of human urine. Photochem Photobiol. 2013;89(2):483-491.
[Crossref] [Google Scholar] [PubMed]
- Huang L, Guo L, Wan Y, Pan P, Feng L. Simultaneous determination of three potential cancer biomarkers in rat urine by synchronous fluorescence spectroscopy. Spectrochim Acta A Mol Biomol Spectrosc. 2014;120:595-601.
[Crossref] [Google Scholar] [PubMed]
- Zvarik M, Martinicky D, Hunakova L, Lajdova I, Sikurova L. Fluorescence characteristics of human urine from normal individuals and ovarian cancer patients. Neoplasma. 2013;60(5):533-537.
[Crossref] [Google Scholar] [PubMed]
- Kamada Y, Murayama Y, Ota U, Takahashi K, Arita T, Kosuga T, et al. Urinary 5-aminolevulinic acid concentrations as a potential tumor marker for colorectal cancer screening and recurrence. Anticancer Res. 2016;36(5):2445-2450.
[Google Scholar] [PubMed]
- Aycock RD, Kass DA. Abnormal urine color. South Med J. 2012 ;105(1):43-47.
[Crossref] [Google Scholar] [PubMed]
- Raymond JR, Yarger WE. Abnormal urine color: Differential diagnosis. South Med J. 1988;81(7):837-841.
[Crossref] [Google Scholar] [PubMed]
- Skrajnowska D, Bobrowska-Korczak B. The effects of diet, dietary supplements, drugs and exercise on physical, diagnostic values of urine characteristics. Nutrients. 2024;16(18):3141.
[Crossref] [Google Scholar] [PubMed]
- McIntire PJ, Kilic I, Wojcik EM, Barkan GA, Pambuccian SE. The color of urine: Then and now-xA comprehensive review of the literature with emphasis on intracytoplasmic pigments encountered in urinary cytology. J Am Soc Cytopathol. 2020;9(1):9-19.
[Crossref] [Google Scholar] [PubMed]
- Chalissery P, Homann C, Stepp H, Eisel M, Aumiller M, Rühm A, et al. Influence of vitamins and food on the fluorescence spectrum of human urine. Lasers Surg Med. 2024;56(5):485-495.
[Crossref] [Google Scholar] [PubMed]
- Kenefick RW, Heavens KR, Dennis WE, Caruso EM, Guerriere KI, Charkoudian N, et al. Quantification of chromatographic effects of vitamin B supplementation in urine and implications for hydration assessment. J Appl Physiol. 2015;119(2):110-115.
[Crossref] [Google Scholar] [PubMed]
- Ramamoorthy A, Sadler BM, van Hasselt JC, Elassaiss‐Schaap J, Kasichayanula S, Edwards AY, et al. Crowdsourced asparagus urinary odor population Kinetics. CPT Pharmacometrics Syst Pharmacol. 2018;7(1):34-41.
[Crossref] [Google Scholar] [PubMed]
- Zellweger M, Martoccia C, Mengin M, Iselin C, Bergh HV, Wagnières G. Study of the influence of over-the-counter vitamin supplement intake on urine fluorescence to optimize cancer detection by fluorescence cystoscopy. J Biomed Opt. 2015;20(6):066011.
[Crossref] [Google Scholar] [PubMed]
- Birková A, Oboril J, Kréta R, Čižmárová B, Hubková B, Šteffeková Z, et al. Human fluorescent profile of urine as a simple tool of mining in data from autofluorescence spectroscopy. Biomed Signal Process Control. 2020;56:101693.
- Agency EM. Guideline on bioanalytical method validation. 2011.
- van Amsterdam P, Companjen A, Brudny-Kloeppel M, Golob M, Luedtke S, Timmerman P. The European Bioanalysis Forum community’s evaluation, interpretation and implementation of the European Medicines Agency guideline on Bioanalytical Method Validation. Bioanalysis. 2013;5(6):645-659.
[Crossref] [Google Scholar] [PubMed]
Citation: Chalissery P, Homann C, Sroka R (2024). Vitamin Supplements and Nutrition: Impact on the Urine Fluorescence Spectrum. J Food Process Technol. 15:1123
Copyright: © 2024 Chalissery P, et al. This is an open-access article distributed under the terms of the Creative Commons Attribution License, which permits unrestricted use, distribution, and reproduction in any medium, provided the original author and source are credited.
