

Indexed In
- Open J Gate
- The Global Impact Factor (GIF)
- Open Archive Initiative
- VieSearch
- International Society of Universal Research in Sciences
- China National Knowledge Infrastructure (CNKI)
- CiteFactor
- Scimago
- Ulrich's Periodicals Directory
- Electronic Journals Library
- RefSeek
- Directory of Research Journal Indexing (DRJI)
- Hamdard University
- EBSCO A-Z
- Publons
- Google Scholar
Useful Links
Share This Page
Journal Flyer
Open Access Journals
- Agri and Aquaculture
- Biochemistry
- Bioinformatics & Systems Biology
- Business & Management
- Chemistry
- Clinical Sciences
- Engineering
- Food & Nutrition
- General Science
- Genetics & Molecular Biology
- Immunology & Microbiology
- Medical Sciences
- Neuroscience & Psychology
- Nursing & Health Care
- Pharmaceutical Sciences
Original Research Article - (2021) Volume 11, Issue 1
Production of Hydrogen by Reaction of Pet-Al Residues of Food Bricks in the Presence of NaOH and KOH
Aymen Souilhi* and Rym AbidiReceived: 29-Nov-2020 Published: 17-Jan-2021, DOI: 10.35248/2252-5211.21.11.394
Abstract
Aluminum being stacked between two layers of polyethylene in food bricks, is a source of hydrogen production highly demanded as energy in our days. With aqueous solutions of NaOH and KOH at concentrations ranging from 1 M to 10 M for T=40, 60 and 80°C, we conclude that the activation energy Ea (NaOH)=36416 J.mol-1 is lower than that of Ea (KOH) at T=60°C and a concentration of 4 M, the reaction is strongly influenced by temperature and concentration. Sodium hydroxide generally promotes more cost-effective reactions. Obtaining an aluminum hydroxide accompanied by salt (NaCl or KCl) after acid treatment of the residual alkaline solution was verified by SEM and IR, thus preserving the nature.
Keywords
Hydrogen; Aluminum; Food brick; Alkaline corrosion
Introduction
In recent years new methods of energy production have been explored due to concerns about fuel depletion. Hydrogen gas become an important source of energy, its use is an attractive approach due to its high calorific value. Despite his advantages, the storage and transport of hydrogen requires energy and special materials [1] due to its very low boiling point (20K). Also the non-existence of hydrogen in its free molecular form on earth and the dependence of noble catalysts such as Pt, which are expensive and rare, for the electrochemical oxidation reaction of hydrogen in batteries is a disadvantage. Other methods of obtaining hydrogen such as the gasification of coal and biomass [2-5], but gaseous products which will mix with hydrogen, such as methane, dioxide of carbon and sulfur or nitrogen monoxide compounds. The chemical reaction of the Aluminum element with water in the presence of a strongly alkaline compound, such as NaOH or KOH [6,7] gives rise to hydrogen because this metal has a very thin passive layer of Al2O3 to its surface, which prevents direct attack on the water molecule [8,9]. It should be noted that aluminum is a source of recyclable energy through daily use materials (can, packaging, waste electrical components ...), thus preserving the nature.
Food bricks are also an important source of energy as they are made of three raw materials: cardboard, plastic (polyethylene) and aluminum. The objective of this work is to study the production of hydrogen by means of the reaction of aluminum stacked between the two layers of polyethylene from the food brick, with an alkaline solution of NaOH and KOH.
Experimental Study
The samples of Rsd (Pet-Al) are obtained by simple pulping with distilled water delicately cleaned by hand and then dried, then cut into the shape of a square of area S = 1 cm2 and weighed using a scale model Kern (0.001g) giving a mass m = 6.5 mg. Six solutions of NaOH (Novachim) of concentration1 M, 2 M, 4 M, 6 M, 8 M and 10 M are prepared; likewise for 6 solutions of KOH (Panreac) and a hydrochloric acid solution 1 M (SIGMA-ALDRICH 37%). We have a syringe of 6 mL which is introduced into, the sample of Rsd ( Pet-Al ) with a volume V = 2 mL of basic solution, the syringe needle was inserted into a silicone stopper to prevent the solution from leaking into the water bath model Stuart RE300B (Figure 1). The volume of hydrogen formed is measured by recording the displacement of the piston as a function of time every 5 minutes. Three repetitions were carried out for each concentration and reagent at 40°C, 60°C and 80°C. To avoid the addition of a correction factor (T bath-water / T room temperature) [10], it was chosen to immerse the total volume (6 mL) of the syringe in the water bath. The end of the experiment is marked by the total consumption of the layer of aluminum stacked between the plastic. The objective of this study is to evaluate the hydrogen yield, the behavior of the reaction rate under different conditions and to estimate the adequate kinetic parameters. The evaluation of the presence of several compounds in the basic solution at the end of the reaction was carried out by a scanning electron microscope (SEM) model Thermo scientific Q250.

Figure 1: Experimental mounting.
Results and Discussions
Qualitative study in alkaline solution
The reaction that occurs easily gives H2 (gas) and aluminum tetrahydroxide anion according to the following reaction:
 [11]
[11]
The volume of H2 evolution under different conditions is given in Figure 2. For a good comparaison the following Table 1 is drawn. Indeed, the increase in temperature decreases the reaction time, this is true for all the concentrations of the solutions based on KOH and NaOH, but the behavior of the 10 M concentration is not the same for NaOH as for KOH, at this concentration the time of the reaction for 10 M in NaOH is 4 times longer than that of 10 M in KOH, also we can notice that the curve of evolution of the concentration 10 M in NaOH is almost confused with that of 1 M which presents the 1/10 of its value. This anomaly may be due to a blockage in the dynamics of the chemical reaction caused by complexations of aluminum for concentration values that exceed 6 M in NaOH.

Figure 2: Volume of H2 released as function of time and at different concentration of NaOH: (a); KOH: (b).
| NaOH | KOH | |
|---|---|---|
| T=40°C |  4M6M2M8M10M1Mt (min) |
6M10M4M8M2M1Mt (min) |
| T=60°C | 4M6M2M8M10M1Mt (min) |
4M6M10M8M2M1Mt (min) |
| T=80°C | 4M6M2M8M1M10Mt (min) |
10M4M6M8M2M1Mt (min) |
Table 1: Time consumed by the chemical reaction at different concentrations according to the temperature.
To understand well the kinetics of the reaction, we plot the velocity as a function of time, this is illustrated in Figure 3; however, the maximum speeds of the reactions occur in a time interval between 0 and 10 minutes, as a result, the reaction is very favorable in the direct direction of the reaction (1), except that for t>10 minutes, the reaction rate is generally slowed down.

Figure 3: Rate of H2released as function of time and at different concentrations of NaOH: (a); KOH: (b).
In Table 2 which follows, the totals of time for the data shown in Figure 3 are grouped together depending to the temperatures.
| Total time (min) | ||
|---|---|---|
| NaOH | KOH | |
| T = 40°C | 1235 | 835 |
| T = 60°C | 455 | 470 |
| T = 80°C | 170 | 230 |
Table 2: Totals of the reaction speed times at different concentrations as a function of temperature.
According to these statistics, it’s clear that the kinetic law is verified: the speed increases with the temperature as the total time decreases, this is true for KOH and NaOH; but for temperatures above 60°C, the reagent NaOH has a shorter duration than that of KOH. This indicates that the mechanism of catalysis is slightly different for each alkali. This is confirmed by the fact that the activation energy at this temperature is higher in the presence of KOH, according to Table 3. The speed of the higher reaction in the presence of KOH has also been reported by Sloter [12] but without any explanation for such behavior. The activation energy of the corrosion is related to the exchange current density i0: the higher the activation energy, the lower the intensity so that the corrosion progresses more slowly, and vice versa [13]. It can thus be said that i0 in the process of corrosion in the presence of KOH is lower than that of i0 in the presence of NaOH. In this sense, it can be considered that the temperature 60°C is the most suitable on the one hand for KOH and NaOH, on the other hand and more selectively for NaOH which shows that the reaction tends to proceed more rapidly. According to Table 2 the temperature 60°C and the concentration 4 M are the most practical kinetic parameters especially with the reagent NaOH.
| Activation energy (J.mol-1) | ||
|---|---|---|
| NaOH action | KOH action | |
| 1M | 56632 | 55322 |
| 2M | 50321 | 50445 |
| 4M | 36416 | 52815 |
| 6M | 44585 | 24718 |
| 8M | 53349 | 47795 |
| 10M | 62407 | 43584 |
Table 3: Activation energy of the reaction.
Quantitative study in alkaline solution
Any gas has particularly simple macroscopic properties in a diluted state. This is also true for monoatomic gases such as rare gases (He, Ne, Ar, Kr) as for diatomic gases, such as H2 gas treated in our case. Indeed the application of the model of the perfect gas is well allowed considering that the conditions of pressure and temperature of the experiment of the Figure 1 give molecules with little interaction, the shocks are elastic (supposedly punctual particles) and without reactions. The deduction of the value of the gas pressure is illustrated in the following Figure 4.

Figure 4: Diagram of pressing forces.
Ftot =F + Fatmso we getFtot = SP - SPatm = S(P-Patm)
At the end of the experiment the equilibrium is reached : Ftot = S(PP atm) = 0 so we getP=Patm
In conclusion, the value of the pressure inside the syringe is equal to 1 atm when the reaction is complete (separation of the Pet and Al)
The perfect gas equation connects P, V and T:PV = nRT(2)
With P is the pressure (Pa), V the volume (m3), T temperature (K), n is the number of moles of the gas, R is the constant of the perfect gases = 8.314 JK-1 = 0.08207 liter atm K-1 moles -1; allows us to calculate the number of moles of H2 released by the action of the reagents KOH and NaOH on the Rsd (Pet-Al) grouped in Table 4.
| Quantity of H2 moles (10-5) (NaOH) | Quantity of H2 moles (10-5) (KOH) | |||||||
|---|---|---|---|---|---|---|---|---|
| T=313,15 K | T= 333,15 K | T= 353,15 K | Haverage | T= 313,15 K | T= 333,15 K | T= 353,15 K | Haverage | |
| 1M | 7 | 7 | 8 | 7.33 | 9 | 8 | 8 | 8.33 |
| 2M | 7 | 10 | 10 | 9 | 8 | 10 | 8 | 8.66 |
| 4M | 10 | 10 | 9 | 9.66 | 9 | 10 | 9 | 9.33 |
| 6M | 8 | 9 | 9 | 8.66 | 10 | 8 | 8 | 8.66 |
| 8M | 7 | 8 | 8 | 7.66 | 10 | 8 | 8 | 8.66 |
| 10M | 7 | 8 | 7 | 7.33 | 9 | 8 | 10 | 9 |
| Vaverage | 7.66 | 8.66 | 8.5 | 9.16 | 8.66 | 8.5 | ||
Table 4: Quantity of H2generated in moles by the action of the reagents KOH and NaOH on Rsd (Pet-Al).
The intersection of the vertical and the horizontal average of the number of moles of H2 recovered make easy to say that the concentration 4 M, and the temperature T = 333.15 K (60°c) are the most suitable kinetic parameters for NaOH (Haverage = 9.66 10-5 mole, Vaverage = 8.66 10-5 mole) and for KOH(Haverage = 9.33 10-5 mole, Vaverage = 8.66 10-5mole) which produce a maximum of gas. It can be generalized that, beyond 4M, the yield in mol of hydrogen is not very useful if one works at a temperature equal to 333.15 K. As for the choice between the two reagents, it seems that NaOH is not very favorable compared to KOH except that NaOH is less expensive.
Aluminum yield
The generation of hydrogen gas causes the formation of [Al (OH)4]- (basic pH) in the solution, the mass of the starting aluminum is deduced by the experimental difference between m Pet-Al before reaction and m Pet at the end of the reaction. The equation of the reaction (2) allows us to establish a relationship in quantity of matter between released H2 and dissolved aluminum, the estimation of aluminum yield by the action of NaOH and KOH is illustrated in Figure 5. It can be said that the amount of aluminum that goes into solution is important for KOH and NaOH, except that for a 10M concentration the yield is not appreciable for NaOH relative to KOH.

Figure 5: Action of NaOH: (a); KOH: (b).
Activation energy Ea
The Arrhenius law k=A exp (-Ea / RT), where Ea is the activation energy of the reaction, A is the pre-exponential factor, R is the constant of perfect gases (8.314 j.mol-1k-1) and T the temperature in Kelvin; allows us to calculate the activation energy. Plotting lnk versus 1/T for KOH and NaOH gives the following Figure 6. Adjustments of the regression models (R2) for all concentrations were more satisfactory for NaOH (0.9551) than for KOH (0.9425), the values of the relative activation energies for the two reagents in question are given in Table 3.

Figure 6: Arrhenius curve for NaOH: (a) and KOH: (b)reaction with Pet- Al.
The comparison of the activation energies for the two alkalis at different concentrations shows a decrease in the values of these energies for concentrations ranging from 1 M to 4 M for NaOH and from 1 M to 6 M for KOH, this is expected because higher concentrations produce faster reaction rates ; but at higher concentrations we observes for both cases an increase in the value of the activation energy much clearer for NaOH than for KOH which can be explained by a slowing of the speed of the reaction. In the literature, similar results have been obtained [14], the study of high purity aluminum (99.9%) yielded an activation energy of approximately 46 - 53 kJ mol-1 with NaOH in a temperature range of 293 K to 343 K. The activation energy found depends on the thickness of the aluminum layer (it increases with thickness) [15], the value of the activation energy at 2 M is equal to 54743 J.mol-1 for NaOH and 59945 J.mol-1 for a thickness of 0.5 mm. From the results obtained in this work and compared to the activation energies evaluated in the literature, it is clear that the alkaline concentration, the purity, the sample thickness and the temperature act as a primordial factor in this type of reaction.
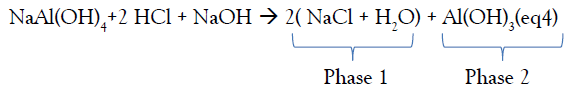
Treatment of the residual basic solution coustic soda
In order to minimize the impact on the environment, also restore the aluminum which exists in the form of [Al(OH)4]- in the strongly basic solution, an acid treatment is used by adding 1 M HCl solution (SIGMA-ALDRICH 37%) until a neutral pH solution is formed, consisting of two phases, Figure 7 show a white phase and a second transparent phase above the first. Indeed, the free OH-in the solution ( NaOH reagent initially introduced) are in excess compared to the hydroxides forming NaAl(OH)4, so free OH- are dosed first according to reaction (eq2), which generates downward of the solution pH. For pH<11 a white precipitate begins to appear, at this moment we are witnessing at the dosage of the OH- linked to pass to the form of aluminum hydroxide Al(OH)3 according to reaction (eq3).

Figure 7: Residu solution after addition of 1M HCl.
HCl + NaOH → NaCl + H2O(eq2)
NaAl(OH)4 + HCl → NaCl + H2O + Al(OH)3(eq3)
The sum of the chemical equations (eq2) and (eq3) give:
The two phases 1 and 2 are then separated, filtered under vacuum and then heated to a temperature above 100°C, after drying, two solid products SD2 from phases 1 and SD3 from phases 2 with different appearance are obtained.
SEM Analysis of the solids SD2 and SD3: The SEM analysis of the solid SD2 in Figure 8, shows a crystalline appearance which appears sharper for an enlargement of 50 μm . The SEM spectrum is given in Figure 9, the appearance of two intense lines characteristic of sodium and chlorine confirms the presence of the sodium chloride salt. According to Table 5, chlorine and sodium present approximately the same atomic percentage which gives x = y = 1 for the crude formula NaxCly, the elements which appear such as C and O which may have originated from (EMAA) are considered as impurities.

Figure 8: The SD2 micrograph for an enlargement of 1 mm (A), then 50 μm (B).

Figure 9: The SD2 SEM spectrum.
| Element | Net Counts | Weight % | Atom % | Formula | Compnd % |
|---|---|---|---|---|---|
| C | 307 | 4.39 | 9.75 | C | 4.39 |
| O | 413 | 3.12 | 5.21 | O | 3.12 |
| Na | 25153 | 37.73 | 43.81 | Na | 37.73 |
| Cl | 31180 | 54.76 | 41.23 | Cl | 54.76 |
| Total | 100.00 | 100.00 | 100.00 |
Table 5: The SEM SD2 composition.
SEM analysis of the solid SD3 (white precipitate) in Figure 10 shows an aspect that reminds us of aluminum hydroxide. The SEM spectrum of the solid SD3 in Figure 11 shows two intense lines for aluminum and oxygen which proves the formation of a white precipitate of aluminum hydroxide. According to Table 6, the atomic percentage for a compound of crude formula AlzOt gives t / z=3.9 ̴4.

Figure 10: The SD3 micrograph for an enlargement of 50 μm.

Figure 11: The SD3 SEM spectrum.
| Element | Net Counts | Weight % | Atom % | Formula | Compnd % |
|---|---|---|---|---|---|
| C | 960 | 7.93 | 12.82 | C | 7.93 |
| O | 16543 | 58.05 | 55.69 | O | 58.05 |
| Na | 781 | 1.53 | 7.92 | Na | 1.53 |
| Al | 20205 | 31.69 | 14.27 | Al | 31.69 |
| Cl | 450 | 0.80 | 9.30 | Cl | 0.80 |
| Total | 100.00 | 100.00 | 100.00 |
Table 6: The SEM SD3 composition.
Infrared analysis of SD2 and SD3: The experiments of rehydration of amorphous aluminum oxides carried out by Verdes.G (1987), showed that the phase formed in weakly basic medium at 25°C is Bayerite, these experiments also show the considerable influence of the adsorption phenomena on the solid surface. Boehmite, can sometimes precipitate at the same time as bayerite and gibbsite, probably in small pores where certain water molecules are strongly linked to the surface of the solid [16]. Studies carried out in the laboratory have made it possible to demonstrate the absorption intensity component located at approximately 3460 cm-1 on the infrared spectrum in transmission of pellets of gibbsite diluted in KBr [17-19]. The infrared spectra of the solid SD2 and SD3 are respectively presented in Figures 12 & 13, the spectral identification is deduced by comparison with the reported data [20,21], the results are grouped in Table 7.

Figure 12: The SD2 IR spectrum.

Figure 13: The SD3 IR spectrum.
| Solid | Experimental position (Cm-1) | Bibliographic position (Cm-1) | Attribution |
|---|---|---|---|
| SD2 | 1391 | - | link C-O |
| 1639 | - | link C=O | |
| 3395 | 3395 | Gibbsite | |
| 3439 | 3439 | Gibbsite | |
| SD3 | 976 | 970 | Gibbsite |
| 1631 | 1660-1740 | link C=O | |
| 3227-3264 | 3328-3338 | H2O | |
| 3358 | 3375 | Gibbsite | |
| 3424 | 3422 | Bayerite | |
| 3460 | 3459 | Gibbsite | |
| 3533 | 3548-3557 | Bayerite | |
| 3606 | 3619 | Gibbsite |
Table 7: Comparison of experimental and bibliographic values of infrared spectra in the region of the vibrations of elongation and deformation of OH according to (Saalfeld and Wedde, 1974) and taken up by (Wang and Johnston, 2000).
The SD2 solid presents a broad band of non-binding OH and OH linked to the aluminum hydroxide which is already detected by SEM in a trace form, the deformation vibrations which appear for the two solids are due to the carbon-oxygen bonds. single and double type of EMAA, except that for SD3 solid the band 976 cm-1 corresponds to the Al-OH signal of gibbsite [22,23]; forSD3 solid it appears in the form of mixtures of Bayerite and Gibbsite in proportions not yet identified.
Conclusion
From the results presented, it’s possible to conclude that aluminum is an interesting alternative for generating high purity dihydrogen. The reaction rate is strongly affected by the temperature and concentration of the alkali. In addition, high yields close to stoichiometric prediction are obtained under certain conditions. The rate of aluminum consumption can be controlled by connecting such a system to a fuel cell or other device capable of burning hydrogen to generate energy. The main objective of this study is to show that it is possible to use aluminum stacked between two sheets of polyethylene from the food brick, as a renewable source of hydrogen. Nevertheless the transport of the hydrogen gas and its storage remains an abuse and this is the subject of several studies and the cost can be competitive for the stationary supply . The recovery of a salt and aluminum hydroxide is a result in favor of the environment (no rejection of products).
Acknowledgments
I warmly thank Pr. Rym Abidi for hosting me in his lab and to all the technicians of the science faculty of Bizerte.
REFERENCES
- Tzimas E, Filiou C, Peteves SD, Veyret JB. Hydrogenstorage: state-of-the-art and future perspective. EU Commission, JRC Petten, EUR 20995EN. 2003.
- Gerun L, Paraschiv M, Vijeu R, Bellettre J, Tazerout M, Gøbel B, et al. Numerical investigation of the partial oxidation in a two-stage down draft gasifier. Fuel. 2008;87(7):1383-1393.
- Giltrap DL, McKibbin R, Barnes GR. A steady state model of gas-char reactions in a down draft biomass gasifier. Solar Energy. 2003;74(1):85-91.
- Zainal ZA, Ali R, Lean CH, Seetharamu KN. Prediction of performance of a down draft gasifier using equilibrium modeling for different biomass materials. Energy Convers Manag. 2001;42(12):1499-1515.
- da Porciúncula CB, Marcilio NR, Godinho M, Secchi AR. Fluid dynamics simulation for design of a biomass gasifier. Comput Aided Chem Eng. 2009;27:1071-1076.
- Soler L, Candela AM, Macanás J, Muñoz M, Casado J. In situ generation of hydrogenfrom water by aluminum corrosion in solutions of sodium aluminate. J Power Sources. 2009;192(1):21-26.
- Soler L, Macanás J, Munoz M, Casado J. Aluminum and aluminum alloys as sources of hydrogen for fuel cell applications. J Power Sources. 2007;169(1):144-149.
- Grosjean MH, Zidoune M, Roué L. Hydrogen production from highly corroding Mg-based materials elaborated by ball milling. J Alloys Compd. 2005;8(404):712-715.
- Wang HZ, Leung DY, Leung MK, Ni M. A review on hydrogen production using aluminum and aluminum alloys. Renewable and sustainable energy reviews. 2009;13(4):845-853.
- Porciúncula CB, Marcilio NR, Tessaro IC, Gerchmann M. Production of hydrogen in the reaction between aluminum and water in the presence of NaOH and KOH. Braz J Chem Eng. 2012;29(2):337-348.
- Aleksandrov YA, Tsyganova EI, Pisarev AL. Reaction of Aluminum with Dilute Aqueous NaOH Solutions. Russ J Gen Chem. 2003;73(5).
- Soler L, Macanás J, Munoz M, Casado J. Aluminum and aluminum alloys as sources of hydrogen for fuel cell applications. J Power Sources. 2007;169(1):144-149.
- Brett C, Oliveira Brett AM. Electrochemistry: principles, methods, and applications. 1993.
- Zhuk AZ, Sheindlin AE, Kleymenov BV, Shkolnikov EI, Lopatin MY. Use of low-costaluminum in electric energy production. J Power Sources. 2006;157(2):921-926.
- Porciúncula CB, Marcilio NR, Tessaro IC, Gerchmann M. Production of hydrogen in the reaction between aluminum and water in the presence of NaOH and KOH. Braz J Chem Eng. 2012;29(2):337-348.
- Petrovic J, Thomas G. Reaction of aluminum with water to produce hydrogen. US Department of Energy. 2008;1-26.
- Gilles V, Robert G. Rehydration of amorphous aluminum oxides. Application to the study of Bayerite Boehmite balance. In: Bulletin de Minéralogie. Minéralogie et géochimie expérimentales [1st Experimental Mineralogy, Petrology and Geochemistry (EMPG) symposium]. 1987;110:5.
- Phambu N. Preparation of aluminum hydroxide. Structural, morphological and superficial characterization: Application to the study of an aluminum passivation layer. Thesis, Henri Poincaré University.1996.
- Phambu N, Humbert B, Burneau A. Relation between the infrared spectra and the lateralspecific surface areas of gibbsite samples. Langmuir. 2000;16:6200-6207.
- Rinnert E. Characterization by vibrational microscopy and adsorption of probe molecules from reactive sites of the surface of an aluminum hydroxide. DEA chemistry and molecular physico-chemistry, Henri Poincaré University.2001.
- Saalfeld H, Wedde M. Refinement of the crystal structure of gibbsite, AI (OH) 3. Zeitschriftf Ur Kristallographie, Bd. 1974 Oct 2;139:129-35.
- Wang SL, Johnston CT. Assignment of the structural OH stretching bands of gibbsite. American Mineralogist. 2000;85(5-6):739-744.
- Marie-Camille Jodin. From taking into account morphological and structural heterogeneities towards the interpretation of the global reactivity of an aluminum hydroxide, thesis. Henri Poincaré University.2004.
Citation: Souilhi A, Abidi R (2021) Production of Hydrogen by Reaction of Pet-Al Residues of Food Bricks in the Presence of NaOH and KOH. Int J Waste Resour 11: 394. doi: 10.35248/2252-5211.21.11.394
Copyright: © 2021 Souilhi A, et al. This is an open access article distributed under the terms of the Creative Commons Attribution License, which permits unrestricted use, distribution, and reproduction in any medium, provided the original work is properly cited.