
Indexed In
- Open J Gate
- Genamics JournalSeek
- Academic Keys
- JournalTOCs
- The Global Impact Factor (GIF)
- China National Knowledge Infrastructure (CNKI)
- Ulrich's Periodicals Directory
- RefSeek
- Hamdard University
- EBSCO A-Z
- OCLC- WorldCat
- Publons
- Geneva Foundation for Medical Education and Research
- Euro Pub
- Google Scholar
Useful Links
Share This Page
Journal Flyer
Open Access Journals
- Agri and Aquaculture
- Biochemistry
- Bioinformatics & Systems Biology
- Business & Management
- Chemistry
- Clinical Sciences
- Engineering
- Food & Nutrition
- General Science
- Genetics & Molecular Biology
- Immunology & Microbiology
- Medical Sciences
- Neuroscience & Psychology
- Nursing & Health Care
- Pharmaceutical Sciences
Research Article - (2025) Volume 16, Issue 3
Molecularly imprinted polymers: Paving the way for Future Drug Delivery Innovations
Roongnapa Suedee*, Watchara Pholsathien, Kanok-on Jaisawan, Jittiya Rodruksa and Pistawus KhomintrReceived: 19-Jul-2025, Manuscript No. PAA-25-29459; Editor assigned: 22-Jul-2025, Pre QC No. PAA-25-29459; Reviewed: 05-Aug-2025, QC No. PAA-25-29459; Revised: 11-Aug-2025, Manuscript No. PAA-25-29459; Published: 19-Aug-2025, DOI: 10.4172/2153-2435.25.16.822
Abstract
This study investigates environmentally friendly components in Molecularly Imprinted Polymers (MIPs) and their integration into nanocapsules for drug delivery. We developed a novel carrier for MIP-based drugs, enhancing the efficacy of biotherapeutic proteins. Optimizing peptide-based nanospheres with recombinant Fc proteins aims to improve drug delivery efficiency while preserving critical recognition sites. Using X-ray fluorescence microscopy, we analyzed the impact of molecular size and fluctuation movement affect the binding of MIP-based drugs, suggesting that polar additives influence the protein concentrate’s excipient-rich phase. Our drug analysis indicated that the solubility of Cannabidiol (CBD) and monoclonal antibody/insulin combinations increased at 40 °C, which aligns with findings from SEM and thermogravimetric analysis. HPLC-UV and LCMS/MS studies showed effective binding and release of antibody Complementarity Determining Region (CDR) peptides in our delivery system, with a correlation between rapid-release phases and elevated CBD concentrations facilitating protein reabsorption through HSA-imprinted receptors. Higher CBD concentration with anti-IgE antibodies and insulin minimizes target depletion, enhancing CDR persistence and efficacy. The improved drug delivery via nanocapsules enhances FcRn functionality while preserving protein integrity, highlighting its potential for treating chronic diseases and improving patient convenience.
Keywords
Molecularly Imprinted Polymers; Biotherapeutic Protein; Monoclonal Antibody Nanocapsule; Direct Probe; UHPLC-QTOF-MS
Introduction
Molecularly Imprinted Polymers (MIPs) mimic antibodies, enabling recognition of essential bioactive molecules and biopharmaceutical peptides, which opens new possibilities in drug delivery and advanced chemical sensors. Numerous recent studies have demonstrated the successful development of selective recognition for bioactive and biopharmaceutical agents [1,2] or the utilization of alternative approaches that involve computer-aided design [3]. In this study, we incorporate prominent therapeutic agents, including Cannabidiol (CBD), monoclonal Antibodies (mAbs), and insulin, essential for effective diabetes management, into the innovative use of MIP to significantly enhance drug delivery systems, composed of water-compatible components within the sophisticated formulation of MIP-hydrogels.
The formation of a selective recognition site within this MIP involves creating pre-assemblies with template molecules and functional monomers, followed by crosslinking to form binding sites. After template removal, selective recognition at these sites enables the effective use of drug combinations while maintaining structural integrity [4,5].
Recent insights into protein degradation and its link to cellular health are advancing our understanding of neurodegenerative diseases like Alzheimer's and Parkinson's [6,7]. The discovery of amyloid aggregation, i.e., insulin, raises significant global health concerns. Research on protein turnover dynamics of the biotherapeutics is essential for rescuing the ubiquitin-proteasome system [8,9]. Stabilizing approaches in drug design show promise for enhancing the longevity and efficacy of biopharmaceuticals [10,11].
Techniques involve binding biotherapeutics to larger molecules and attaching antibodies to surfaces by binding to macromolecules and immobilizing antibodies on the hydrophilic or hydrophobic surfaces [12-14], enhance the safety and efficacy of biotherapeutics or improve antibody persistence. Understanding how recombinant Molecularly Imprinted Polymers (MIPs) mimic antibodies, enabling recognition of essential bioactive molecules and biopharmaceutical peptides, which opens new possibilities in drug delivery and advanced chemical sensors. Numerous recent studies have demonstrated the successful development of selective recognition for bioactive and biopharmaceutical agents [1,2] or the utilization of alternative approaches that involve computer-aided design [3]. In this study, we incorporate prominent therapeutic agents, including Cannabidiol (CBD), monoclonal Antibodies (mAbs), and insulin, essential for effective diabetes management, into the innovative use of MIP to significantly enhance drug delivery systems, composed of water-compatible components within the sophisticated formulation of MIP-hydrogels.
The formation of a selective recognition site within this MIP involves creating pre-assemblies with template molecules and functional monomers, followed by crosslinking to form binding sites. After template removal, selective recognition at these sites enables the effective use of drug combinations while maintaining structural integrity [4,5].
Recent insights into protein degradation and its link to cellular health are advancing our understanding of neurodegenerative diseases like Alzheimer's and Parkinson's [6,7]. The discovery of amyloid aggregation, i.e., insulin, raises significant global health concerns. Research on protein turnover dynamics of the biotherapeutics is essential for rescuing the ubiquitin-proteasome system [8,9]. Stabilizing approaches in drug design show promise for enhancing the longevity and efficacy of biopharmaceuticals [10,11].
Techniques involve binding biotherapeutics to larger molecules and attaching antibodies to surfaces by binding to macromolecules and immobilizing antibodies on the hydrophilic or hydrophobic surfaces [12-14], enhance the safety and efficacy of biotherapeutics or improve antibody persistence. Understanding how recombinant Fc proteins interact with antibodies is key for effective drug delivery of payloads [15]. This helps incorporate surveys into biopharmaceutical models.
Monoclonal antibodies and recombinant insulin show promise for diabetes treatment, though their efficacy can be hindered by inflammation and immune responses. Recent advancements in amyloid aggregation research have identified agents that enhance insulin function and address neurodegenerative diseases. While issues like neuropathic disorders and age-related conditions can affect transport rates and safety in polymedicine, the rapid clearance of insulin, especially alongside cannabinoids like CBD, presents interesting avenues for further study. The stability of recombinant Fc proteins and targeted delivery systems, guided by amino acid sequences [16], faces challenges such as the short lifespan of insulin [17] and the rapid clearance of the neonatal Fc Receptor (FcRn) with short onset of action [18]. Co-administering Biologically Therapeutic Proteins (BTPs) with poorly soluble cannabinoids has shown potential to reduce first-pass metabolism and enhance drug bioavailability [19]. CBD and biotherapeutic agents, such as an anti-human IgE antibody and insulin, are explored to improve the efficacy of therapeutic proteins. Researchers are developing methods to stabilize biomolecules in aqueous environments [20], thereby enhancing the delivery of the drug-protein in enzyme-rich contexts [21]. The benefits of CBD are noteworthy, leading to this approach seeking to reduce sensitivity reactions and minimize adverse effects, such as potential immune responses to specific antigens to CBD and other biotherapeutics, by allowing for single doses rather than multiple repetitions. Ultimately, this can lead to a more favorable patient experience.
Significant progress has been made in achieving high specificity in protein imprinting, but challenges remain. Researchers are making significant advancements in stabilizing biomolecules within aqueous environments, a development that could markedly enhance drug delivery systems in enzyme-rich contexts. This evaluation emphasizes the mechanisms underlying human immunoglobulin aggregation and its significance in the interactions of the developed MIPs. Such interactions are vital for the diffusion of proteins and small molecules, paving the way for innovative therapeutic strategies, particularly through the co-administration of CBD with therapeutic proteins to achieve optimal drug levels. Additionally, our research reveals that variables such as the exopolysaccharide matrix and pH levels significantly influence the permeability of the solubilization matrix, which is vital for preserving the longevity and stability of biopharmaceutical agents. Employing Atomic Force Microscopy-Surface Enhance Raman (AFM-SER) mapping spectroscopy analysis, to assess a dry MIP blending of CBD particles facilitates enhanced drug dissolution, underlying the formation of nanovoids effectively optimizing the release profiles of payloads within the hydrogel entrapment, binding affinity and the kinetic release in conjunction with proteins. The AFM-SER mapping provided valuable insights into binding sites and pore accessibility. Our research further highlights the exceptional compatibility of antibody Complementarity-Determining Region (CDR) peptides within functional nanospheres, which substantially enhances binding at HSA-imprinted sites. The innovative MIP-biocomposite nanolayers demonstrate promise in promoting payload entrapment, positively influencing mAb efficacy and interactions with albumin and peptides.
This study aims to the production and control of environmentally friendly components within Molecularly Imprinted Polymers (MIPs), exploring their integration into nanocapsules. We have created a new carrier to deliver Molecularly Imprinted Polymer (MIP) drugs effectively, especially in water-based environments. This carrier uses a gel composed of a 1:1 weight ratio of polyethylene glycol methacrylate and Polycaprolactone-Trimethylene glycol (PCL-T), known for being safe and flexibility. We combine this gel with MIPs and chosen excipients. Our MIP-hydrogel formulation includes important therapeutic agents: Cannabidiol (CBD), which may have health benefits; monoclonal Antibodies (mAb), essential for targeted therapies; and insulin, which is an essential biopharmaceutical for managing diabetes. This carrier enables for drug release, solvent evaporation, and coacervation by interacting with exopolysaccharides in extracellular lysate. By improving peptide-based nanospheres and using recombinant Fc proteins, we used fluorescence microscopy to identify key components. We also examined how CBD is utilized in the body, enabling certain parts of the immune system to function more effectively. This work is crucial for enhancing the delivery of drugs like anti-IgE antibodies and insulin. By making these advancements, we're getting closer to more effective ways to deliver medicine.
Materials and Methods
Methacryloyl chloride, Ethylene Glycol Dimethacrylate (EDMA), octyl-β-Dglucopyranoside, cholic acid, sodium alginate, N-acetyl-D-glucosamine, potassium chloride, sodium chloride, adenosinetriphosphate disodium hydrate, adenosine diphosphate disodium, HSA, wheat germ agglutinin, recombinant human insulin (expressed in yeast), anti-human IgE antibody (epsilon chain specific) (peroxidase) in the IgG fraction of antiserum, and Cocktail Protease Inhibitors, CPIs (in DMSO solution) were obtained from Sigma-Aldrich Chemical Company (Milwaukee, WI, USA). CBD was kindly provided by AVS Innovation (Bangkok, Thailand) and was used in the same batch throughout. CBD standard was used as an authentic compound, and HPLC-QTOF-MS was used for identity (C21H30O2, theoretical mass=315.2319 and mass found=315.2318 with mass error=-0.32 ppm). D-(+)-Maltose was obtained from Amersham (Ohio, USA). Lysozyme from hen egg white (muramidase) was purchased from Fluka Chemie (Buchs, Switzerland). Perfluoro Methyl Cyclohexane (PMC), Pentafluoro Propionic Anhydride (PPA), and Polycaprolactone-Trimethylene glycol (PCL-T) were procured from Sigma-Aldrich (Milwaukee, WI, USA). Potassium peroxidisulfate, sodium phosphate dibasic anhydrous, and sodium chloride were procured from Fluka Chemie (Buchs, Switzerland). Potassium chloride was purchased from Univar (NSW2147, Australia). Sodium monophosphate monohydrate was obtained from Sigma-Aldrich (St. Louis, MO, USA).
Methanol was used as LC-MS grade, which was procured from Sigma-Aldrich (St. Louis, MO, USA). Standard LMX broth was obtained from Fluorocult(R) LMX Broth (Merck, USA). Rappaport Vassiliadis Soya (RVS) broth, Baird Parker media, and constituents for the enzymatic assay were sourced from Merck (USA). All the broths were sterile solutions, used for microbiological analysis-an ultra-pure water of the type defined by authority (ISO 3696), and a Milli-Q water. Phosphate Buffer Saline (PBS) was prepared by dissolving sodium chloride (8 g), anhydrous disodium phosphate (1.44 g), sodium monophosphate monohydrate (0.245 g), and potassium chloride (0.2 g) before diluting to 1 L of distilled water, substantially adjusting to pH 7.4 with NaOH or HCl. All other solvents used were of analytical reagent grade and used without further processing.
Preparation of MIPs
The MIPs, which consist of recognition sites for a template were prepared by a thermal polymerization process, using potassium peroxydisulfate as the radical initiator. In a typical MIP preparation, a monomeric component in the presence of a pre-polymerized mixture obtained from the template (200 mg) was initially dissolved in 200 mL of pure Milli-Q water, then β-D-glucopyranoside (70 mg, 0.37 mM) was added, followed by a dropwise addition of cholic acid (160 mg, 0.4 mM) and methacryloyl chloride (2.5 g, 24 mM) was made to the reaction mixture, which was stirred for 15 minutes before the adding a solution of the template, following by EDMA (5.5 g, 15 mM) at room temperature. After the initiator (130 mg, 0.5 mM) was admixed, the reaction mixture was stirred (125 rpm) at 85°C. After three hours, the resultant particles were then passed through a 0.45 μm nylon membrane filter (VentPureTM Nylon, Vertical Chromatography, Thailand) and washed with an admixture of ethanol and Milli-Q water (v/v, 1:1), followed by three washings with 250 mL portions of water and ethanol.
Complete extraction of the template molecule from the polymer was confirmed by FT-IR
(Perkin Elmer, Spectrum One, MA, USA), which was verified by the omission of the template(s) in the rinses after the polymer washing, which was dried in vacuo and analyzed by fluorescence intensity. The NIP was used as a control and was prepared using the same procedure as that for the MIPs, except that the template was omitted. Finally, the polymer particles were obtained as fluffy white solids, which were dried under vacuum and stored in air-tight containers at ambient temperature until needed. The surface morphology of the recognition materials was examined using Scanning Electron Microscopy (SEM) on a JSM5800 LV electron microscope (Jeol, MA, USA).
Analysis of the Binding Efficiency of CBD in the Prepared MIPs
Determine the CBD concentration ranges between 10-2500 μg/mL in 5 mL of various solvents (n-propanol, ethanol, or DMSO) for the binding test for MIPs. In a typical batch binding experiment, the resultant MIP particles (250 mg) were admixed with 12.5 mg of a CBD ethanol solution (1 mL) in 15 mL of PBS and incubated at room temperature. The tube was then mounted on a vertical rotator and incubated at a rotatory speed of 20 rpm. At predetermined time intervals, samples were drawn for analysis of CBD. Thereafter, 200 μl of the supernatant was collected and filtered through a 0.45 μm filtered syringe. To enhance the binding and adsorption of CBD within the imprinted polymer, a 24hour incubation period was chosen. The MIPs (WA-MIP, NAG-MIP, and HSA-MIP) and corresponding NIPs were also examined for the CBD adsorption efficiency with an incubated amount of 200 mg. In the preliminary experiment, batch template-rebinding evaluations were conducted using phosphate buffer saline at pH 7.4, and after designated periods. The present work found that the fluorescence spectra of free CBD and CBD incubated with the obtained MIPs were also identical (excitation wavelength at 280 nm, emission wavelength at 307 nm).
Each MIP was weighed into 5 mL of PBS containing NAG, WA, HSA, ATP, or ADP and incubated for 5 hr, 24 hr, 48 hr, or 96 hr. All samples were placed into a 96-well fluorescence plate and analyzed using a micromax 384 microwell fluorescence plate reader (Horiba Scientific, CA, USA), with each sample containing 1.5 mL, before measuring fluorescence intensity with a Fluoromax 4P Spectrometer (Horiba Scientific, Tokyo, Japan) at an excitation wavelength of 280 nm and emission wavelength of 307 nm. The amounts of CBD in the samples were determined using a standard solution calibration curve obtained from fluorescence spectroscopy. The eight replications were performed for all samples (Table 1).
| Polymer | Template | Mw (template) | Methacryloyl chloride (M) | Cholic acid (mM) | EDMA (M) | K2S2O8 (mM) | Porogen (ml) |
|---|---|---|---|---|---|---|---|
| HSA-MIP | Human serum albumin | 66,500 da | 0.24 | 4 | 0.15 | 5 | 800 |
| WA-MIP | Wheat germ agglutinin | 36,550 da | 0.24 | 4 | 0.15 | 5 | 800 |
| NAG-MIP | N-acetyl-D-glucosamine | 221 g/mol | 0.24 | 4 | 0.15 | 5 | 800 |
| NIP | - | - | 0.24 | 4 | 0.15 | 5 | 800 |
Table 1: The preparation of MIPs and corresponding NIP in this study.
The study of the in vitro release of CBD
The WA-MIP, NAG-MIP, and HSA-MIP were subjected to the release study for CBD in an aqueous solvent, which was determined using a drug blend of solid powder-based MIP for CBD analysis. The blend comprised CBD (12.5 mg/1 mL in ethanol) and MIP blend (250 mg) and PBS pH 7.4 (1.5 mL), which were admixed, followed by the adding of NAG (40 mg), and adenosine triphosphate (20 mg) and then incubated in a 10 mL-tube at a rotation speed of 20 rpm at room temperature. The combination of the excipients and the premade gel was assessed after a five-hour of incubation period, and the CBD concentration in the vials was measured by fluorescence intensity. Samples of the in vitro release study were centrifuged at 4000 rpm for 30 min. Then, 200 ml of the supernatant was taken and filtered (0.45 mm, nylon membrane) and added in a 96-well plate for each of 1.5 mL of supernatant for determination by a spectrofluorometric technique using an excitation wavelength of 280 nm and emission wavelength of 307 nm and a slit width at 10 nm. The eight replications of all trials were examined for the study.
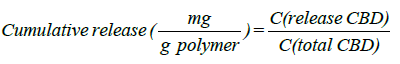
Where the was calculated in units of mg from the ratio between C release and CBD, which refers to the amount of CBD released in the samples to C, the total CBD, divided by 1 g of polymer added. Thermogravimetric analysis was performed using TGA/DSC3 Thermal Analyzer (TGA/DSC3, Toledo, Switzerland) at a scan rate of 10°C/min for the sample at temperatures ranging from 50.00 °C to 500.00 °C in nitrogen. Further, the solid residues from an ethanol mixture, consisting of hydrated CBD after air-drying at room temperature, were assessed for surface area and average pore diameter of the chosen MIPs upon degassing at 120°C and 200°C, corresponding to the elimination of surface moisture of the constituent substances and the water of crystallization. The Brunauer, Emmett and Teller (BET) isotherm, surface area of the test samples and average pore diameter were obtained using nitrogen gas absorption (ASAP2460, Micromeritics, USA).
The evaluation of the release of payloads from the biocomposite-based MIP
We investigated the effect of release media additives on protein drug delivery into an octanol/PBS (1:1) mixture using a U-tube with an interfacial area of 4.1 cm2. A total of 50 mL vehicle comprising of the octanol/PBS (1:1) vehicle was filled into the U-tube where each vial of the test powder mixture was subjected to a molding process which involved the moistening of a product mixture consisting of MIP (500 mg), a template (40 mg) and 1 mL of ethanol containing CBD (12.5 mg) for the release study into an aqueous external phase at the receiving end. During the experiment involving the excipient, 250 mg of CBD in octanol was moistened with alginate before transferring the final paste into the donor side of the U-tube containing the octanol/PBS mixture (10 mL).
The preparation of the pre-mixed formulation was achieved either with the addition of WA (40 mg), NAG (40 mg), and ATP (20 mg) along with D-maltose (150 mg) and sodium alginate (350 mg) as stabilizers for dispersive polypeptide drugs and as a binder of thickening agent, respectively, and admixed in 1 mL of PBS. For the typical release of CBD, nanocapsules or microspheres containing biotherapeutic proteins and CBD were encapsulated in MIP or NIP. The drug blends for both MIPs and NIPs consisted of 500 mg of polymer, along with the addition of 30 μL/mL of antibody and 7 mg of insulin. The CBD loaded MIP was weighed in 1 mL of PBS (pH 7.4, 1 mL), followed by the premixed material being admixed before transferring into the donor phase. At predetermined time points, release samples were collected from the supernatant using a U-tube (rotating with a magnetic bar at 1400 rpm) and replaced with an equal volume of fresh blank media. NIP served as the control experiment.
The supernatant was centrifuged at room temperature for 5 minutes at 4000 rpm to isolate the residual particles. Twenty μl aliquots from each of the screwed-cap vials were removed. The quantitative analysis of CBD present in the release tests of either MIP-CAI or NIP-CAI (both from the powder and with hydrogel encapsulation) was conducted by measuring fluorescence intensity at an excitation wavelength of 280 nm and an emission wavelength of 307 nm and the concentration of CBD in the samples was obtained from an external standard calibration with the PBS as a control. Eight replications of all trials were carried out in this study. At the end of the experiments, the residual solid paste was recovered, separated, and air-dried at room temperature before microstructure analysis. Eight replications of each MIP and NIP were executed in this experiment.
Preliminary study of the interaction of CBD with therapeutic proteins
We validated the interaction of CBD with therapeutic proteins to verify that they do not induce any changes in CBD with MIP within the chosen component using Fluorescence Laser Techniques (FLT), along with an in-situ fluorescence image of a sample and microsystem analysis. Additionally, we monitored the DPs, which involved testing of biorelevant media for a supplement. The morphology of both low and high CBD containing samples was examined through real-time photo imaging of the test biocomposites (before and after exposure to the relevant medium), by fluid imaging technologies, using a fluorescence stereo microscope (Leica M205, FCA, Switzerland) coupled with the two probes (Ebq 100-04). Microprobe adherence was facilitated with the Z-stack procedure for the solid samples prepared by lithography on the nylon membrane before air-drying or as a liquid filling sample. The characterization and chemical analysis of the compositions and molecules in either loaded and unloaded MIPs or NIPs were conducted, when supplemented with various media additives and the lysozyme and CPIs. The microstructure of MIP-C, or protein-loaded MIP as a solid blend, was examined using air-liquid interface experiments. Measurements were taken using 10X, 40X, or 100X objectives and the laser probe at red, blue, or green channel. The time-lapse imaging was done before acquiring a Z-stack, and followed by microsystem analysis of the microstructure of the test sample, with at least 10 traces by fluorescence microscopy microsystem (Leica M205, FCA, Switzerland). Microsystem analysis of three FL for 100 traces was performed. A threshold was applied, and the total fluorescence of the MIP in the region of interest was obtained for the entirely self-arranged sample.
The preparation of solid powder-based HSA-MIP
The preparation of solid powder-based HSA-MIP involved a thorough protein analysis. Specific amounts of CBD (10.5 mg and 250 mg) were mixed with HSA-MIP or NIP in 1 mL of ethanol, using a physical method. The drug blend typically consists of 500 mg of HSA-MIP (or NIP), CBD, ATP (20 mg), HSA (40 mg), sodium alginate (350 mg), and D-maltose (150 mg). Total protein in the sample was meticulously determined via amino acid analysis, ensuring the accuracy of results. For the protein-loaded MIPs (M-CAI or N-CAI), a mixture of CBD, HSA (25 mg), IgG (0.994 mg), and insulin (2.97 mg in pH 7.4 PBS) was combined with the solid powder blend. Hydrogel encapsulation followed the same methodology, substituting insulin with a different amount (4.456 mg). A pre-made gel was created using a 1:1 w/w ratio of gel to PCL-T known for its biocompatibility and flexibility, to which the drug blend (1:1 w/w) was added along with other excipients. The pre-gel mixture included MAA (1 g), EDMA (1 g), and PPA (1 mL) with an initiator, then treated with N, N’-azobisbutyronitrile (10 mg/mL) and heated at 70 °C for 3 days. The resulting product was isolated and rinsed with ethanol before vacuum drying. This gel is meticulously combined with MIPs and a selection of carefully chosen excipients.
The in vitro release and evaluation of drug delivery
This study explores the in vitro release and drug delivery of CBD from MIP-based DDS in a biocomposite solid powder. To assess the single drug loading of CBD, a drug partitioning experiment was conducted over 96 hours. This experiment was crucial for understanding the CBD behaviors and the interactions of the combined antibody and insulin in the DDSs over time, particularly when extended to 14 days. The experimental setup consisted of a U-tube with an interfacial area of 4.1 cm2, containing octanol and phosphate-buffered saline (PBS), stirred at 300 rpm at room temperature. This set-up was designed to mimic the physiological and biorelevant media of drug release. The drug blend was placed in the donor side of the U-tube and stirred at 100 rpm for release testing. A solid suspension of the test samples was loaded on the donor side of the U-tube to facilitate drug release at specified time intervals. Fluorescence intensity was measured at an excitation wavelength of 280 nm and an emission wavelength of 307 nm to analyze CBD concentrations, following previously established methods. Quality control was based on an external standard calibration curve for CBD concentrations. After the permeation study, 2 mL of the remaining viscous material in the donor phase was filtered at room temperature through a 0.45 μm nylon membrane filter for the microstructure analysis. All experiments were conducted in four replicates, including two independent runs, to ensure the robustness of our findings.
Characterization of the MIP-based DDSs and evaluation of loading capacity
Dynamic molecular analysis: The dynamic surface analysis of residual and in-situ HM-CAI was performed via liquid/solid interfaces for tested samples from the MIP-C and HM-CAI (before or after incubation with the additive and excipients). A 5 ml sample of octanol or phosphate buffer from a U-tube, was isolated and syringe-filtered through a nylon membrane with a pore size of 0.45 μm (vertical chromatography, Thailand). The wetting of the coating of the filtered solid was measured, and the drop shape of a dispersed liquid was captured and analyzed at 23 ± 2°C, and 50 ± 5% RH using the WI-RES-Contact angle method with an Optical Contact Angle analyzer (OCA25, Dataphysic, Germany). The effect of liquid viscosity on wettability was examined by measuring the characteristic relaxation of interfacial layer tension against pure dispersive liquids (H2O and octanol, respectively) via the oscillating drop method. The calculated mean drop values (n=3) of 5 μl samples were reported for interfacial tension. The surface free energy of the samples was calculated according to Owens, Wendt, Rabel and Kälble (OWRK) using the SCA21 software. The polar and dispersive contributions for MIP-C and HM-CAI were calculated after measuring surface tension. The mean value of triplicate measurements on the same batch was reported (Table 2).
| BET isotherm | ||
|---|---|---|
| WA-MIP | Specific surface adsorption (m2/g) | Average pore diameter (Å) |
| Unloaded MIP | 11.012 | 157.623 |
| Loaded MIP | 13.873 | 158.624 |
| Loaded MIP and supplement HSA | 31.899 | 191.322 |
| Loaded MIP and supplement NAG | 12.181 | 148.572 |
| Loaded NIP | 16.204 | 197.574 |
Table 2: BET isotherm of WA-MIP incubated with CBD or supplement HSA, or NAG, and the CBD loaded NIP in the solvent/PBS mixture (1:15, v/v) for 48 h.
Scanning Electron Microscopy (SEM)
SEM coupled with Field Emission (FE) has also been used for the microstructural analysis of the prepared MIPs. The microstructure determination and imaging of MIP-CAI were conducted with and without loading insulin/mAb and with HN-CAI as a control. This confirmed the miscibility of the compositions before further testing. The solid component of MIP-CAI underwent microstructure analysis via the in-situ capture of the residual MIP. The filtered solid pastes of the sample were drop-coated onto glass substrates before being goldsputtered to reduce the charging effect. The test sample was placed onto a self-adhesive carbon tape and inserted into the FEI Apreo C (Thermo Fisher Scientific, MA, USA) at 0°C with a vapor pressure of 1000 Pa; elemental compositions and cooling systems were used throughout for all samples to protect against chemical degradation and evaporation.
X-ray microanalysis
The precision of X-ray microanalysis was harnessed during the trials to characterize the MIP-based DDS or CBD loaded with a combination of mAb and insulin. Scanning Electron Microscopy (SEM), equipped with Field Emission (FE) and Energy-Dispersive X-ray (EDX) analysis from Thermo Fisher Scientific, was employed for the investigation. An elemental map of the particle images was created using EDX analysis in low vacuum conditions with an Apreo Nicole electron column. The beam current used ensured that charging was minimized. The solid component of the MIP- CAI was subjected to microstructure analysis at various locations of interest, leading to significant findings. X-ray scan mapping was performed on the selected exposed components, generating a quantitative profile of emitted X-rays within a specific energy range of 0-20 keV. Six scanned images were recorded for each object, including drug protein-loaded MIP and NIP, which were either before or initially incorporated into the encapsulating hydrogel, exposed to the release media, resulting in an overlaid qualitative profile of the identified atomic elements.
Atomic force Microscopy-Surface Enhance Raman mapping spectroscopy (AFM-SER)
Nano probe analysis was performed using AFM-SER mapping spectroscopy, following the previously outlined application of this technique [22] Roy, et al. Three categories of samples were examined: (1) samples exposed in the insulating layer, (2) combinations of initially added excipients, and (3) changes observed after incubation with lysozyme and CPIs. SERS signals were acquired using nikon objective lenses (Japan) at a laser setting of 532 nm with 16 mW power to monitor chemical changes. The signal-to-noise ratio, crucial for SERS analysis, was adjusted to reduce light scattering disturbances while maintaining a constant laser absorption depth.
Point measurements were taken from three to five target locations to capture the residual MIP and the corresponding NIP in situ, and these measurements were overlaid to compare trials from the dependent experiments. AFM images were obtained using a Flex AFM (Nanosurf, Switzerland) in non-contact mode at a scan rate of 1 Hz. Specimens were cast onto glass or gold electrodes and allowed to dry at ambient temperature. A surface map was created from the AFM images for the films of the MIP, or NIP, and the constituents in the gel mixture. The Z-axis position of the surface, a crucial aspect of the AFM image analysis, was measured with precision using Nanosurf software. The distance measurement (DM) was calculated and normalized to 100% using treated mAb and insulin, with additional lysozyme and CPIs considered the penetration thickness. This was compared between the initially mixed excipients and the samples after incubation with lysozyme and CPIs. The test concentrations used in this analysis included 0.65% w/v CBD, 0.02% w/v mAb, and 0.1% w/v insulin.
ATR-FTIR spectroscopy
The residual constituents in the solid matrix were separated, and the filtered sample was characterized using the FT-IR spectrum. The FT-IR spectrum was obtained using an Invenio S Bruker Fourier transform infrared spectrometer (Bruker, Germany) in a spectral range of 4000-600 cm-1, before and after vacuum drying at 0°C.
Fluorescence microscopy and microsystem in biopharmaceutical testing
Region of interest was analyzed using Fluorescence with a UV laser (FL) applied to the hydrogel-entrapped MIP-C (HMIP-C), MIP-C, M-CAI, and HM-CAI in a fluorescence channel. S-pyrene butyryl propranolol (50 mg) served as a dye marker for fluorescence microscopy and was utilized for the Z-stack of the biopharmaceutical solid test. The brightfield fluorescence images of the amorphous high solids for the specimens from experimental HM-CAI and HN-CAI (dry stage) were meticulously assessed using a Stereoview fluorescence microscope (Leica M205, FCA, Switzerland). A Leica M205 FCA microsystem was employed to monitor differences in the Z-stack for more precise imaging. The combination of transmitted light and fluorescence in the 375 nm mode of laser optic fiber, and green fluorescence in the 477 nm and 589 nm, reveals the protein interactions with the fluorescence dye in the samples. Each image volume of the fluorescent particles was acquired within the area of interest, ensuring comprehensive coverage. The analysis of the fluorometric assay and images involved adjusting laser power at specific XY positions for the fluorescent objects, which were visualized under laser optics in red, green, and blue modes, and capturing images of the objects. A standard threshold was applied, and the total fluorescence from antibody interactions and proteins per sample was measured.
Additionally, the particle size distribution of 20 mL samples in a Petri dish, contained within a PBS solution via gel suspension and air interface, was analyzed using fluorescence images. The resulting protein precipitation was located in the Petri dish, using a combination of transmitted light, and measured in the green fluorescence channel. The interlayer distance in the axial position, FI, allowed for imaging of the fluorescent objects, with mean diameter and standard deviation reported.
The effect of the combination of lysozyme and CPIs
This study investigates the effect of lysozyme and CPIs on the fluorescence performance of MIP-DDS. For the incubation experiment, the respective MIP or NIP was loaded with a DMSO solution containing 44 mg of CPIs and 40.45 mg of lysozyme (in PBS, 500 μl) at a high CBD loading of 250 mg. The mixture was stirred at room temperature for 24 hours to ensure accurate results. Afterwards, the proteins incorporated in the MIPs were analyzed for Z-stack images, illustrating the MIP system and the presence of proteins and CBD. The kinetics of aggregation and antibody adherence to preformed target antigenic epitopes in the reaction of monoclonal antibodies were monitored after being captured within a microsystem. The fluorescence intensity was continuously recorded under the experimental conditions, ensuring a thorough data analysis. Samples were withdrawn from U-tubes at predetermined time points for fluorescence intensity measurements. The lysozyme concentration led to multivariate fluctuations, causing relative fluorescence intensity at the predetermined reaction, as indicated by the reduction in CBD fluorescence when the sample reached the MIP solution. These fluctuations were monitored for changes after combining insulin and the antibody. Fluorescence intensity values for CBD in the MIP system were calculated by subtracting the intensity of the product mixture from that of the blank (the premade CBD solution mixed into the polymer bulk). The average results from eight trial repetitions measured the antibody bound to the target, which were plotted against those in the matrix over time.
Evaluation of diffusion and affinity of MIPs
This study involved release experiments conducted with solid mixtures of MIP-C and HM-CAI in Phosphate-Buffered Saline (PBS). The mixtures included MIP and CBD or a combined formulation of insulin and mAb at varying CBD concentrations (0-3.4 mg/mL). Seven U-tubes with different interfacial areas (4.1, 5.7, and 8.8 cm²) were tested. The U-tube setup was chosen to mimic the conditions of a biological membrane, with the octanol representing the lipid bilayer and the PBS representing the aqueous environment at physiological pH 7.4. Each U-tube contained 30 or 50 mL of octanol and 10 or 20 mL of PBS.
Data analysis was conducted, and samples from the U-tubes were centrifuged at 5000 rpm for 10 minutes at 25°C. The fluorescence intensities of the samples were measured to analyze the CBD content using fluorescence spectroscopy. The diffusion characteristics of HM-CAI and HN-CAI were determined, and high-performance liquid chromatography- Ultraviolet (HPLC-UV) analysis was employed to simultaneously monitor the concentrations of mAb, insulin, and CBD in the withdrawn liquid from the U-tubes. This studied the loading capacity and kinetic release of the MIP system.
The diffusion coefficients (represented by the slope) between HM- CAI and HN-CAI were compared. The interaction parameter, denoted as kd, was derived from the intercepts of the plots. Changes in protein-protein interactions were assessed using the equation:
Dm = Ds (1 + kd C),
where Ds is the self-diffusion coefficient, a measure of the diffusion of a substance in the absence of the other substance, and kd is the interaction parameter, a measure of the strength of the interaction between the MIP and the substances it carries [23]. The fit quality of the tests was evaluated using regression coefficients (R2). After evaluating the prolonged-release efficiency, the chemical analysis and molecular characterization of the residual gel matrices in the filtered solid samples were conducted via near or real-time analysis and microstructure.
High-Performance Liquid Chromatography (HPLC-UV)
The quantities of the anti-IgE antibody and human insulin in the supernatant samples from the diffusion study were assessed by the HPLC-UV method. The HPLC system included a Hitachi 5110 Chromaster pump, a 5430 diode array detector, and a 5210 was obtained evenly at 213.15 mg/5 mL and adjusted evenly with the mobile phase. A 0.5 mL sample was added to a 1 mL Eppendorf tube, followed by 13 μL of standard insulin and filtered through a syringe filter (0.45 micron). The mAb of anti-human IgE and IgG in goat serum showed a peak associated with soluble protein eluted at 3.0 min, 4.0 min, and 7.0 min for monomeric chain and heavy chain amino acids, respectively. Human insulin in the samples exhibited a prominent peak at 4.8 min, while a significant peak was assigned for CBD that was eluted at 15 min. Also, the HM-CAI showed a chromatogram for soluble aggregate and monomer in the samples compared to the reference standard solution of mixed antibody antiIgE and insulin.
Significant study on CBD, mAb, and Insulin diffusion for HM-CAI
HM-CAI and HN-CAI were analyzed using Franz diffusion cells. A unique bacterially derived cellulose membrane was created as the model membrane for this study, cultivated at the harvest plant and characterized. Its thickness was measured using a Micro Thickness gauge (Check Line, MTG-D, USA) at the Office of Scientific Instrument Testing (OSIT) at Prince of Songkla University. Seven Franz diffusion cells, each with an interfacial surface area of 3.20 cm², were mounted with the model membrane to investigate the effect of CBD loading on the release of CBD and the recovery of protein abundance. The donor chamber contained various concentrations of CBD in oil suspension. In contrast, the receiving chamber was filled with 15 mL of PBS at pH 7.4 and stirred at 130 rpm using a magnetic stirrer, following an infinite dose administration to maintain sink conditions in the receptor phase. Samples were periodically withdrawn from the receiving chamber and replaced with fresh PBS solutions. We measured the levels of CBD, insulin, and antibodies in the donor and receiving chambers at the start and end of the transport. We thoroughly examined degradation profiles and calculated the logarithm of CBD uptake concentrations, referred to as logC, using fluorescence intensity measurements. By plotting this data over time, we were able to assess absorption patterns. Moreover, we conducted a careful comparison of total protein changes after specific incubation periods for the test drug products, which helped us evaluate the accuracy of biotherapeutic protein recovery, as well as analyze 17 amino acids against their initial amounts.
The deposited layer of proteins/CBD delivery has been studied through direct microscopic observation using state-of-the-art AFM-SER mapping spectroscopy and X-ray to assess the chemical constituents of the deposited materials, which were altered by the pH of the residual component solution at the interface. X-ray fluorescence (XRF) microscopy and mapping were performed at room temperature using an X-ray analytical microscope (XGT5200WR, Scientific, Tokyo, Japan), with a detection limit of 0.1% wt.
pH and viscosity
pH of the test samples was measured using a Mettler pH meter (Mettler Toledo, Seven Compact, Switzerland). Three pH values were recorded as a mean value ± SD. The viscosity of the samples was determined using a Digital Viscometer, Model LVDV-I Prime (Brookfield, USA) to measure the dynamic viscosity. Samples were loaded into a bottle with a screw cap sealed to prevent solvent evaporation, followed by measurement of viscosity with three repetitions, at a stirred speed of 24 rpm and an actual temperature of 24.5-25.2°C.
Solubility limits on the biomembrane
The development of a solid-phase localized delivery system is crucial for enhancing the binding capacity of HSA imprints. The interaction of free CBD with recycling binding affinity and the transfer of FcRn in cellular lysate is vital for IgG catabolism, drug uptake efficacy, and stability, which have been monitored using advanced spectroscopic techniques. Through the effect of endogenous biomolecules on molecular and protein interactions, we focused specifically on the cross-reactivity of Dopamine (DA) with the permeated Directed Peptides (DPs), used in the additive assay. The DA permeating through the wheat germ agglutinin loading was isolated and identified. Its quantification in the total protein assay was conducted through amino acid analysis and its authenticity was confirmed using Raman spectroscopy. We obtained a wheat germ agglutinin-based extract for the spiked dopamine assay, which acts as an inhibitor of cell wall agglutination. This enabled us to assess the function and activity of the proteins involved. In a typical assay with a modifier ligand inhibitor, we reconstituted freeze-dried samples and permeated equal volumes of each sample across a suitable membrane alongside 20 μL of spiking DA. At the onset of the assessment process, we observed a rapid release phase comprising CBD concentrations ranging from 20 to 200 mg/mL (0.06 to 0.63 mmol). After 7 days of diffusion through a uniformly measured thickness of cellulose membrane, the composition of each sample was reduced, and we confirmed that half of the original content remained detectable using fluorescence intensity. This test was significant in understanding the solubility limits of CBD and the combined biotherapeutic proteins in MIPs on the Biomembrane (BM). Four replicates of the pooled quality control sample from the filtered reservoirs were characterized for target peptide sequences and the higher-order molecular structure of the proteins in the final product mixture using 500 MHz NMR spectroscopy (an AVANCE NEO, Bruker, Germany) with D2O as the solvent, in which 15 mg of all the sample was weighed and dissolved in 600 μl of D2O. Before the microscopic examination of the adsorbed components remaining on the membrane surface, we compared assays without supplements to those supplemented with different concentrations of DA (50 μL) under non-liquid stirring conditions, ensuring that molecular interactions within the MIP system were preserved.
Ultra-High-Performance Liquid Chromatography-Quadrupole Time-of-Flight Mass Spectrometry (UHPLC-QTOF-MS)
This study aimed to determine the compositions of the solution- rapid release phases from the processed samples for CBD analysis in biological lysates, which were determined using UHPLC-QTOF- MS, following previously published research [24]. The separation system included a TOF/Q-TOF mass spectrometer (1290 Infinity II, LC-6545A QuadrupoleTOF, Agilent Technologies, USA) equipped with a binary pump (Model G7120A). A Model G71168 column (Agilent Technologies, USA) was connected to the TOF/ QTOF mass spectrometer via a Dual AJS ion source in positive ion mode. Electrospray Ionization (ESI) and high-resolution mass spectrometry were performed using the MassHunter 6200 series. The instrument specifications, which play a crucial role in the combined CBD and BTPs process analysis were as follows: capillary voltage of 4000 V, nozzle voltage of 2000 V, nebulizer pressure of 2.4 bar, drying gas flow rate of 13 L/min, gas temperature of 325°C, and Fragmentor voltage of 175 V. The mobile phase flow rate was set at 0.2 mL/min, and the injection volume was 2 μL. The reference masses (m/z 121.0508 for purine, C5H5N4, and 922.0097 for hexakis (1H,1H,3H-tetrafluoropropoxy) phosphazine, C18H19F24O6N3P3) were used as internal reference masses for the analysis. The UHPLC-QTOF-MS spectrometer confirmed protein abundance and qualitatively analyzed both peptides and CBD. Our research was comprehensive, assessing the degradation profiles of the targeted proteins, their dissociation, and constituents in the liquid-solid phase of the DP samples, as well as the residual liquid component. Amino acid contents in the filtered samples were determined through amino acid analysis. The total protein abundance was plotted against various CBD loadings, aligning with the loading kinetics of MIP-based DDS. The calculated log(sFc) was derived from the ratio of the abundance of the targeted protein to the total protein abundance obtained from amino acid analysis.
Determination of microbiology
The determination of the growth of E. coli, S. aureus, coliforms (lipopolysaccharide), and Salmonella spp. is conducted through enzymatic activities, as recommended by BP 2023 (Supplement Chapter IVL, pp. V-A 841-843). The microbial assay involves examining the drainage of the DPs from the membrane filtration using previously established methods [25] at the Office of Scientific Instrument and Testing (OSIT) at Prince of Songkla University. The turbidity method determines coliform and E. coli levels in LMS broth, which precedes the thorough strain typing on XLD agar plates. Colony counts are performed using colony- forming units (CFU/ml). Strain typing, a comprehensive process, involves quantifying microorganisms through autofluorescence and bioindication. Adhering to the BAM guidelines, appropriate dilutions of 0.1, 0.01, and 0.001 g inoculum are prepared, with MPNs per gram used to test and confirm the sensitivity of the lysate. A sample solution is prepared while ensuring it remains below the Maximum Valid Dilution (MVD), based on the endotoxin limit of 5 IU/kg, corresponding to a mass value of 0.4 IU/mg. A change in color from yellow to green-blue in LMX broth indicates a positive result for coliforms and E. coli, which is then meticulously confirmed using the highly reliable MALDI Biotyper on the serial diluted test samples after incubation at 41.5°C for 24 hours (OVEN IF55, Memmert, Germany). Quantitative determination of S. aureus is conducted using colony spot counts on Baird-Parker agar plates. The quantitative enumeration of E. coli in filtered reservoir samples is performed using a fluorometric method, followed by plating on standard agar. After conducting the turbidity test in RVS broth, microorganisms are further quantified using culture media for XLD. CFU counts of Salmonella spp. are also performed and confirmed using MALDI.
Statistical analysis
The release rate was presented as the mean ± SE, where SE represented the standard error, and the number of replications is shown. Statistical analysis was carried out using Microsoft Excel. The differences were compared, and the difference was considered significant at a p-value less than 0.5. Three statistical parameters, namely the standard deviation of the regression, the standard deviation of the slope, and the correlation coefficient, along with plots of experimental values against residual values. This assessment determined the extent of conformity for the data obtained from the processed samples and was then verified by analysis of variance.
Results
Preparation and Characterization of MIPs (MIPs)
The MIPs for selective recognition of NAG, HSA, and WA was prepared through chemically induced polymerization, using potassium peroxidisulfate as the initiator and ultrapurified water as the porogen. A biosurfactant is utilized in the polymerization process, as high protein concentrations can limit specific binding sites on the prepared MIPs. A polar protic porogen disrupts hydrogen bonding between the protein template and functional monomer. Thus, the organic-solvent-soluble crosslinker EDMA is an effective choice for protein and epitope imprinting, enabling the formation of adsorption sites through the self-organization of a functional monomer that interacts with biomolecules in the crosslinked networks. The preassemblies formed between the biogenic template molecules and functional monomers enhance specific binding at imprinted sites. The chemical structure of the cholic acid moiety connected to the respective MIPs and cannabidiol reveals the molecular design, which involves the hydrophobic material- cationic amphiphilic interactions between the template and cholyl- methacrylate-co-ethylene glycol dimethacrylate within the cross- linked networks of the polymers. Previous studies, including those by Takaomi, et al. [26], demonstrated the embedding of imprinted cavities in a solid matrix with methacryloyl cholate ester, given the selective recognition of the MIPs obtained, which is primarily linked to the templates through non-covalent interactions and charge-supported hydrogen bonds between the functional groups of the template and the respective MIP. The imprinted cavities, which carry the binding site matches in surface chemistry, charge contour, along with a reciprocal 3D topology image of the biomolecule template, significantly enhance a pronounced high recognition of the original template.
In (Figure 1A), SEM images show small particles present in all MIPs and NIPs, along with distinct morphologies observed in WA- MIPs. The porous granules of WA-MIPs, characterized by smaller aggregated particles, and the HSA-MIPs with interconnected woven layers, may enhance binding efficiency and template accessibility. In contrast, NAG-MIPs exhibit numerous spherical particles clustered around a larger particle, resulting in substantial material aggregation in the corresponding NIP. The IR spectrum provided characteristic peaks indicative of the polymer's functional groups at around 1745 cm-1 for carbonyl stretching, 3200 cm-1 for an OH group of cholic acid, and at 2890 cm-1, a CH2 stretching band for both MIP and NIP. The DSC endotherm of the MIPs and NIP, revealed the % wt loss in TGA within the temperature range of 90-170°C, except for NAG-MIP. The absence of a distinct endotherm for NAG-MIP suggests a different thermal behavior, which may be related to its unique structure and thermal stability. CBD did not display a temperature within a 5-200°C range. These results indicate the successful formation of the MIPs, marking a significant achievement in molecular imprinting, and provide valuable insights into their structure and thermal properties.

Figure 1A: SEM images of NIP and MIPs prepared in this study: HSA-MIP, NAG-MIP, and WA-MIP.
BET Surface Area, Adsorption, and Pore Size of Prepared MIPs
(Figure 1B) displays the BET analysis results for NIP, WA-MIP, NAG incubated with WA-MIP, and HSA and CBD both incubated with WA-MIP, that strongly adsorbed, ultimately leading to the clustering around hydrated sites within the imprints when they interact with biomolecules. (Table 3) presents key data from the BET surface analysis. The tests of CBD with water-compatible MIPs (WA-MIP) in phosphate-buffered saline (PBS, pH 7.4) show similar surface areas and pore sizes before and after incubation: 11.012 m²/g and 157.623 Å before incubation; 13.873 m²/g and 158.624 Å after. When only HSA was used, the surface area rose to 31.8995 m²/g, with a pore size of 191.322 Å. In the next experiment with N-acetylglucosamine (NAG), the surface area and pore size were lower at 12.181 m²/g and 148.572 Å, respectively. This helps us understand the interactions of MIPs with smaller molecules. The optimal CBD amount is linked to the powder surface area, a key finding. The NIP powder combined with extra HSA had a surface area of 16.204 m²/g, approximately half that of the MIP. The NIP's average pore size was larger at 197.574 Å. The added HSA in WA imprints reduced the surface area and pore size, which lowered adsorption. Larger HSA molecules likely blocked the WA template from entering the pores, minimizing the MIPs' binding efficiency, hence providing insights into their characteristics and interactions of these substances.

Figure 1B: BET analysis on NIP, WA-MIP, NAG with WA-MIP, HSA, and CBD in relation to WA-MIP. Insert: the pore volume and diameter of different imprinted molecules within the molecularly imprinted polymers (MIPs) as they undergo hydration.
| Sample | Viscosity *[cP] | pH** | ||||
|---|---|---|---|---|---|---|
| Non-gel | Hydrogel encapsulated |
Non-gel | Hydrogel encapsulated | |||
| MIP-CAI | 5.30 ± 0.01 | 1.37 ± 0.01 | 4.94 ± 0.01 | 6.32 ± 0.02 | ||
| MIP-C | 4.27 ± 0.01 | 1.60 ± 0.01 | 4.94 ± 0.06 | 4.50 ± 0.05 | ||
| NIP-CAI | 3.74 ± 0.01 | 1.41 ± 0.01 | 4.67 ± 0.01 | 5.70 ± 0.03 | ||
| NIP-C | 2.50 ± 0.01 | 1.37 ± 0.01 | 5.63 ± 0.03 | 3.95 ± 0.03 | ||
Table 3: Viscosity and pH of in the encapsulated hydrogel MIPs or NIPs containing of CBD (0.75% w/v) as individual and combination with antibody and insulin.
We employ spectroscopic techniques and mapping images to investigate the interactions between the drug and HSA, as well as other components, during the drug release process. AFM images indicated significant molecular interactions in the residual MIP-C particles, as shown in (Figure 1C(a)). FE-SEM revealed dehydrated layers and NaCl coatings on HM-CAI micrographs EDX mapping identified a high level of protein salts and a microlayer matrix within the protein-imprinted polymer hydrogels. This was attributed to a higher binder concentration and the degree of swelling of the protein solution. FE-SEM results suggested that the transition to a dry state is associated with enhanced drug dissolution, as depicted in Figure 1C(b). This transition underscores the robust molecular interactions between the CBD loaded MIP and various components during drug release. AFM analysis revealed the presence of nanovoids within the dried particles, resulting in a reduction of interstitial space by a factor of 6.5. Furthermore, the observed increase in amplitude values, from 5.77 mV to 140 mV. This phenomenon influences the drug release profiles of CBD, mAb, and human insulin in HM-CAI, indicating potential modifications in hydrogel morphology and DDSs. Raman-mapped images (Figure 1C,c) show a mix of particles and vesicles that form a bilayer. The interactions between the hydrogel and NIP, with HSA present, created clusters of globular protein near two barrier lines. This indicates that droplets merge with fine particles on their surfaces. Van der Waals forces made the MIP embedded in the lipid-protein mixtures stronger in the oil-in-water (o/w) phase, as shown in the AFM image. Dipole-dipole interactions also strengthened the liquid bridges created by HSA, which helped particles merge. HSA affects hydrogel-loaded NIP differently from MIP, causing gel suspension to form in a protein-rich CBD mixture and impacting solubility. Additionally, a pressure transition was recorded, indicating roughness levels increased from 64.46 mN/m before protein loading to 72.8 ± 0.05 mN/m when in contact with water, alongside a contact angle of 50.44°, which significantly decreased upon exposure to a nonpolar phase. In PBS, the CBDloaded MIP had a contact angle of 16.5° and a low dispersive force of 0.83 mN/m, ass also the contact angle and drop shape. The surface tension of nonpolar solvents was measured at 27.6 ± 0.2 mN/m, with a contact angle of 40.02°. These results suggest that significant changes in roughness and contact angle occur upon exposure to water and the nonpolar solvent. The created materials and components interact with the peptides and antibodies within a dense, leached-out protein, enhancing the notable liquid proteinadsorbed MIP and the other component, revealing valuable insights into their performance, which we will explore further in the following sections.

Figure 1C: (a) This shows an AFM image of a hydrogel containing HSA-MIP. The inset displays a hydrogel with NIP. (b) SEM image of the powder formulation and a hydrogel that includes CBD along with HSA-MIP, NIP, antibodies, and insulin. (c) Raman mapping of HSAMIP and NIP that contain CBD, either mixed with CBD, combined with some antibodies and insulin, before and after the encapsulation of gel coating.
Thermal analysis for the MIPs and additives
In Figure 1(D), a-c, a loss of 20% was evident for all MIPs between 115-130°C and 282-437°C. All MIPs exhibited degradation of the substance and solvent evaporation within these temperature ranges. The TGA indicates that the glass transition of CBD occurs between 179.5 and 290.5°C. The NIP experienced weight losses of 6.25% (130-150°C) and 17.0% (270-370°C). WA-MIP showed similar weight losses but demonstrated differences in thermal stability. The addition of the WA template led to weight losses of 13.4% and 70.7% (309-438°C). NAG-MIP exhibits unique behaviors, with interactions that affect thermal stability. NAG-MIP displayed significant thermal behavior, with weight losses of 65.55% to 79.35% due to interactions with ATP ranging from 129.5- 315°C. Adding CBD to NAG-MIP increased thermal instability, similar to HSA-MIP's behavior, correlating with enhanced solvent sorption and evaporation. The results suggested that hydrophobic interactions influenced the thermal properties of MIPs, with WA-MIP showing higher stability. Additionally, CBD and additives affect thermal stability and weight loss in NAG and HSA-MIPs, which is essential for MIP applications (Figure 1A,B,C,D).

Figure 1D: TGA curves for HSA-MIP, NAG-MIP, and WA-MIP interacted with different excipients and additives, including CBD, over a 24-hour incubation period at ambient temperature.
The binding properties of MIPs
In this study, we investigated the binding affinity of MIPs prepared to a template to improve the adsorption of CBD in Phosphate- Buffered Saline (PBS) solution. We tested different solvent types and found that the highest relative fluorescence (I/Iâ??) occurred in ethanol compared to n-propanol and DMSO. CBD adsorption and release studies provide valuable insights into the adsorption efficiency of CBD across different polymer types. MIPs created through molecular imprinting show a strong attraction for CBD. After incubating the HSA template and HSA-MIP, as illustrated in Figure 2a (top panel), we achieved an equilibrium state with the maximum amount of adsorbed CBD at 19.4 mg/g of polymer. The addition of different media affected the template bound to CBD. ATP increased CBD adsorption for NAG-MIP (6.5 mg/g polymer) and HSA-MIP (2.4 mg/g polymer). In contrast, the WA-MIP had the lowest adsorption at 5.5 mg/g polymer, while the addition of ATP increased CBD adsorption to 18.2 mg/g polymer, in Figure 2b (top panel). The NAG-MIP showed the highest CBD amount (23.4 mg/g polymer).
The release of CBD from different polymers is shown in Figure 2 (a-c, bottom panel), suggesting the impact of bioactive molecules (NAG, ATP) and other substances during the dissolution process for HSA-MIP, NAG-MIP, and WA-MIP after five hours and 48 hours of incubation. With HSA-MIPs mixed with CBD and the template, an increase in CBD release is observed even with supplements like NAG and alginate. Remarkably, the addition of HSA resulted in little to no significant release of CBD, indicating strong adsorption of CBD to the polymers. In contrast, WA-MIP and NAG-MIP demonstrated a marked increase in CBD release when NAG and ATP were added. Initially, these MIPs released about 50% of CBD within the first 12 hours, which significantly differed at the 48-hour mark, where they released approximately twice as much. HSA-MIP had a slower CBD release, reaching only 37.5% when the rebound template was included, exceeding the 52.5% release achieved with NAG alone. The findings highlight the mechanisms by which CBD is released during the template rebound process, such that the addition of different media had a substantial effect on the template bound to the CBD. Meanwhile the reversible binding and desorption of CBD are directly influenced by the steric environment of the imprinted cavities and the fit of CBD molecules within the HSA imprinted binding site in the context of protein binding and drug self-association. The results suggested the release of CBD molecules into a PBS/octanol mixture and examined the effects of ATP and various additives on the release dynamics. A comparative analysis was conducted among the obtained MIPs and respective non-imprinted characteristics concerning drug delivery for CBD, and the investigation considered for factors that influence adsorption (Figure 2).

Figure 2: The amount of CBD adsorbed (measured in mg per 1 g of polymer) during incubation at an initial concentration of 12.5 mg of CBD over 5 and 48 hours. (bottom panel): The amount of CBD released into a PBS/octanol mixture after incubation during template rebound, along with a mixture of template rebound and ATP, and various additives. (a) HSA-MIP, (b) WA-MIP, and (c) NAG-MIP, as well as their corresponding NIP.
Dynamic morphology determination
The innovative system effectively diminished viral interference and microorganisms in the liquid-antibody system, as evidenced by enzyme activity measurements and SEM-EDX mapping of ligand and antibody binding (Figure 3a). Dynamic analysis via AFM-SER mapping confirmed the presence of CBD in nanocapsules, displaying specific spectral peaks at 1500 cm-1 and 3100 cm-1 (Figure 3b), which indicated interactions between CBD and MIP matrices. The SER spectra of M-CAI exhibited broad merged peaks that transformed into narrow, intense separate peaks at 1400 and 1448 cm-1, as shown in Figure 3b for HM-CAI incorporated various amounts of CBD (20 mg and 50 mg). A test ligand modifier enhances protein conformation and improves anti-IgE interactions, resulting in smaller and more effective nanocapsules. We confirm that HSA-MIP carriers enhance uptake efficiency and binding interactions with CBD. Additional factors also influence the reuptake efficiency of biotherapeutics, which differ for the mAb molecule associated with MIP nanocapsules. The SER spectra indicated that protein self-association and aggregation occur through proteinprotein interactions with CBD, resulting in distinct conformational variations of the peptide or protein at the air-solid interface. AFM analysis revealed that the CBD-loaded MIP microcapsules were larger and exhibited different roughness compared to globular NIPs (Figure 3c). The roughness analysis suggested an increase in the nanostructure sizes of CBD/HSA supramolecules compared to M-CAI. This highlights the unique characteristics of the MIP within the hydrogel matrix, indicating that the arrangement of functional groups or the shape of the template protein within the MIP system affects the local protein concentration in the micropores, thereby facilitating enhanced interactions between CBD and MIP macromolecules (Figure 3 a,b,c).

Figure 3: (a)FE-SEM and EDX mapping; (b)AFM images and AFM-SER spectra with and without the added lysozyme and CPI. (c) AFM images of microcapsules created from powder particles, excluding hydrogel, that contain CBD in both HSA-MIP and NIP, highlighting differences in the roughness measured on the Z-axis.
The total CBD accumulated in MIPs and NIPs with CBD (0.67% w/v) as they effectively released into PBS medium over 48 hours from a non-hydrogel, MIP-based DDS see (Figure 4). When CBD is loaded into the MIP (MIP-C), it initially releases quickly. In the first 12 hours, the concentration of CBD in the solution reaches its highest level. After 24 hours, the release rate slows down and remains relatively constant over 48 hours. The rate of CBD transport from the MIP-C embedded hydrogel is 0.633 mg/min (R²=0.929), which is much higher than the NIP-C rate of 0.0038 mg/min (R²=0.80) after 48 hours. At 12 hours, only 0.50% of the CBD had been released. However, by 48 hours, MIP-C had released a remarkable 79.40% of CBD into the surrounding water, while NIP-C showed high adsorption and a slower release rate. The differences in CBD release rates happen because CBD binds nonspecifically to the templating protein, which helps MIPs recognize and release the CBD effectively.

Figure 4: Shows the total CBD released from MIPs and NIPs loaded with 0.67% w/v CBD in PBS over 48 hours.
Controlled release of CBD and protein
We found that the hydrogel's properties promote strong interactions between CBD and proteins, facilitate drug delivery, and enhance the efficacy of antibodies. The HM-CAI system achieved sustained release of insulin and antibodies, particularly with high CBD loading (250 mg) compared to low loading (10 mg). Over 20 days, insulin and monoclonal antibodies released approximately 3,000-3,500 μg and 500-650 μg, respectively, as shown in Figure 5a. The HM-CAI showed a slow CBD release, starting at 51.24% on day one and stabilizing at 62.0% after 10 days. In contrast, protein release from the MIPs began after 5 days, with the NIP hydrogel showing progress in CBD release after 7-9 days (see Figure 5d). Notably, the HN-CAI achieved a cumulative CBD release exceeding 100% after 10 days, likely due to agglomeration of particles. Figure 5 (b,d) shows how mAb/insulin and CBD are steadily released from HM-CAI with a high CBD loading of 250 mg. When tested at pH 7.4, as seen in Figure 5(d), the amount of CBD that moved into the surrounding water increased until it leveled off after 5 to 10 days. This indicates a continued release of CBD from HM-CAI, which was stronger than that from a lower CBD loading of 10 mg during the same period. Overall, a significant percentage of CBD, ranging from 83.5% to 102.14%, was released from HM-CAI. However, the total CBD concentration in the solution dropped by approximately 40% over 14 days. The results indicate that the low-loading amount of CBD (10 mg) in the hydrogel enhances the solubility of mAb and insulin compared to the high-loading formulation (250 mg). HM-CAI increases in the diffusion of these agents, enhances CBD incorporation, and promotes the passive permeation of mAb and insulin into the PBS solution. The sustained release of antibodies, insulin, and CBD by HM-CAI illustrates their intermolecular interactions. Conversely, hydrogen bond interactions between CBD, insulin, and mAbs with HSA show notable differences due to weaker bonds, which aid in the molecular recognition of HM-CAI based on their chemical properties, enabling the diffusion of recognized molecule with selectivity (Figure 5).

Figure 5: The in vitro release of hydrogel-encapsulated MIPs and NIPs containing CBD (0.75% w/v) combined with antibody and insulin, examined at the octanol/PBS medium interface. Panels (a) and (b) the relationship between the anti-human IgE antibody and insulin. Panels (c) and (d) the total amount of CBD released from two types of formulations, HM-CAI and HN-CAI, with different CBD amounts: 20 mg and 250 mg. A total of seven experiments were conducted in sets of 2 and 5, all incorporating the anti-IgE antibody and insulin (mean ± SD).
In the diffusion experiment, the octanol/buffer HM-CAI system demonstrated its capabilities by enabling a sustained release of insulin and antibodies into an external aqueous phase, particularly with a high CBD loading of 250 mg. The release of mAbs and insulin from HM-CAI was about 15 times and 85 times higher, respectively, than from the NIP. The levels of steady-state release and the lag time increased by 5 days, helping to capture CBD and proteins, which considerably improved CBD flow over the 14-days. The MIP had the highest selectivity for release compared to the NIP in the first two hours, due to higher amino acid concentrations at lower pH levels. However, a decrease in the selective level in the cumulative CBD release as the polymer swelled in an oil-water mixture, consistent with prior studies [27]. We used fluorescence microscopy to identify key components, which showed differences in the inner surfaces of MIPs. X-ray fluorescence microscopy revealed that molecular size and movement affect interactions, showing an additional chloride layer on cellulose films. The nanolayer composed higher levels of Calcium (Ca), Magnesium (Mg), and saline ions; i.e. Chloride (Cl) and Sodium (Na) Fluorescence intensities, that are appeared important for enzyme activity [28], that is a consequence of small molecule binding to HSA receptor and of the IgE receptor preference to ABD either free or bound antibody. The results indicated that the effective release of CBD from the NIP system relied on advanced ligand modifiers, while also demonstrating that these innovative carriers significantly improved the release of antibodies and insulin, thereby enhancing the delivery of large macromolecules.
The evaluation of the remaining MIP-based DDS
The analysis of HSA-MIP, after the drug release using FE-SEM- EDX before and after combining it with a monoclonal antibody and insulin (Figure 6A, a). The hydrogel-entrapped HM-CAI has distinct protein properties. The new nanolayer for protein loading in the MIP promotes CBD incorporation, as shown by AFM images, in Figure 6A, b. Structural modifications in surface- exposed proteins enhance stabilization through HSA-imprinted binding sites. The mixed hydrogel, loaded with protein and treated with supplemental media, forms a strong nanoscale thin film, both with and without HSA. Fluorescence imaging reveals that combining lysozyme and CPIs produces strong red fluorescence, while HM-CAI shows green fluorescence, as depicted in Figure 6A, c. Furthermore, the lysozyme mixture also displays yellow fluorescence, indicating it binds with HSA-lipid complexes, whereas hydrogel NIP shows only green fluorescence. Lysozyme has different effects on NIPs and MIPs, leading to reduced NIP expansion. MIPs exhibit a marked reduction in fluorescence, indicative of decreased ATP levels, alongside an increase in fluorescence due to enhanced charge distribution. This suggests improved protein accessibility and drug-protein binding, which are vital for eliciting a robust antibody response by minimizing the propensity for protein aggregation and stabilizing mAb/insulin-loaded MIPs and CBD. AFM confirms that thicker films in NIPs result from the incorporation of drug peptides and proteins into the gel layer (see Figure 6A, panel d). This study is crucial for advancing our understanding of drug- protein mAb interactions with lysozyme. We observed a pH shift from approximately 1.88-1.9 to 4.1-4.3, while charged amino acids remained stable at a physiological pH of 7 to 7.5. By maintaining sodium chloride concentrations above 0.2 mM, the pH stabilizes around 6.6, optimizing antibody stability. The acidic environment partially compromises neutralization, while the blanching activity of adsorbed water influences antibody persistence, mediated by the pH-dependent association of the Fc region (Figure 6A) [29].
Further, we analyzed the molecular interactions between the Fc and Fab regions of antibodies bound to glycoproteins, which led us to optimize specific areas for enhanced functionality. This system provides robust screening of biotherapeutic protein drugs, facilitating targeted treatments against anti-human IgE antibodies, essential for managing allergies and immune responses. The therapeutic benefits of these antibodies are well-established in treating bronchitis, asthma, allergies, and inflammation with minimal side effects. The analysis of membrane permeability in HSA-MIP carriers, conducted in both nonpolar and aqueous environments, demonstrates a notable enhancement in their interaction with the IgE receptor. By employing a labeled Fc- linked peroxidase probe, we investigated fluorescence changes in CBD through multivariate fluorometric analysis, allowing for visualization of the interactions and effects of the treatments. We observed significant shifts in the kinetic affinity of the IgE receptor, particularly at varying pH levels when interacting with lysozyme and CPIs, as illustrated in Figure 6B(b). Over a 12-day incubation period, HM-CAI exhibited relative fluorescence fluctuations ranging from 10 to 15, whereas multivariate HN-CAI showed lower measurements varying between -5 and 2.5. By day 12, the incorporation of ATP or ADP revealed strong interactions between Fc and FcRn, suggesting that the immobilized protein template predominantly facilitates sustained interactions. In the NIP system, we initially observed an increase in positive values, followed by a return to previous patterns, indicating potential self-association among monoclonal antibodies and other active components. This dynamic interplay between CBD concentration and permeable CBD within the dynamic layer may impact antibody clearance rates. Salts and cholate anions enhance drug dissolution by counteracting sodium cations. HSA binding results in green fluorescence imaging, with HSA-containing particles measuring 1-2 mm2, leading to larger vesicle areas and increased densification and aggregation, which is linked to the self-association of the molecule of this aromatic amino acid (Table 4).
| Sample | Viscosity*[cP] | pH** | ||
|---|---|---|---|---|
| Without | With lysozyme and CPIs | Without | With lysozyme and CPIs | |
| unloaded MIP | 60.03 ± 9.38 | 67.62 ± 13.60 | 4.67 ± 0.01 | 3.90+0.02 |
| Protein loaded MIP | 66.17 ± 12.29 | 78.32 ± 7.57 | 4.27 ± 0.03 | 4.22 ± 0.04 |
| unloaded NIP | 36.26 ± 9.35 | <0.4 | 1.88 ± 0.04 | 4.31 ± 0.10 |
| Protein loaded NIP | 5.07 ± 0.29 | 65.54 ± 4.57 | 4.10 ± 0.01 | 4.29 ± 0.02 |
Table 4: Calculated distance measurement for (mAb/insulin)-loaded MIPs or NIPs containing of CBD (1.5% w/v) with or without the supplemented lysozyme and CPIs.

Figure 6A: The FE-SEM-EDX analysis of HSA-MIP before and following its combination with the monoclonal antibody (mAb) and insulin (a). The AFM image: panel (b) that displays the MIPs loaded with mAb and insulin; Panel (c), a fluorescence image obtained using laser illumination, along with a Z-stack evaluation. Panel (d), the changes in the volumes captured and the topography of the vacuum-dried layer surface about CBD loading after exposure to HSA, NAG, and the loaded NIPs in solvent/PBS, both with and without the addition of supplementary additives and enzymes.
Identification of CDR peptides and their binding affinity
Figure 6B, in panel (b), the Raman shifts are presented, detailing the residual viscous components in the mixture before and after the introduction of lysozyme and CPI. Notably, these components include HM-CAI and HN-CAI, which may exhibit distinct spectral features that provide insights into the molecular changes induced by lysozyme and CPI affect the physicochemical properties of the mixture. Hydrogen bonding is essential for these interactions. Additionally, the presence of neutral ions or positively charged amino acids alters CBD fluorescence when co-incubated with lysozyme, as shown by raman shifts validating [30]. CPI (see Figure 6B,b), demonstrating effective charge transfer (Figure 6B).

Figure 6B: The effects of supplemented lysozyme and CPI on the relative intensity (I/I0) in an octanol/PBS mixture with a fluorescently labeled Fc antibody (panel a). Panel (b) displays the Raman shifts of the residual viscous components for HM-CAI and HN-CAI, before and after treatment with lysozyme and CPI.
Atomic Force Microscopy (AFM-SERS) showed that mixing recognition material with CBD promotes drug dissolution, which was evident by raman peaks observed at 1403 cm-1 and 1443 cm-1, which were attributed to CBD. The structure with the stability of these peaks was confirmed before and after supplementing with lysozyme and CPIs (see Figure 6C). Additionally, a complex ligand modifier can induce changes in protein conformation and influence amino acid interactions within the imprinted interface. After adding lysozyme, a broad peak at 1375 cm-1, reflecting the bending and twisting of CH2 groups within the amino acid chains, was observed. The supplemented lysozyme strongly influenced HN-CAI in the hydrogel, that positively charged particles improve intermolecular interactions to anionic amino acids’ enzyme, influencing the clustering of antibody and protein groups. This interaction leads to a significant increase in the dynamics of methyl group fluctuations in the antibody at the alcohol-water interface [16]. The dynamics of the mobile methyl group are essential, influencing both hydrophobic and hydrophilic surfaces of the double layer. This significantly affects the hydrogel's properties and enables the sustained release of biotherapeutic proteins. In Dynamic Polymers (DPs), proteins interact more with MIPs than NIPs. For unloaded MIPs, the DM value increased from 60.03% to 67.62%, while for loaded MIPs, it rose from 66.17% to 78.32%. Furthermore, the introduction of CPIs significantly limited the expansion of NIPs, resulting in a DM value of just 5.07% for protein-loaded NIPs. This indicates a considerably lower level of protein entrapment in NIPs compared to their MIP counterparts. The hydrophilic nature of CAI leads to lower fluorescence due to protein self-association. HSA in MIPs reduces CBD adsorption and considerably enhances therapeutic protein. Higher CBD levels facilitate mAb movement and stabilize the nanostructured HSA-MIP.

Figure 6C: Separation of CBD, mAb, and insulin by using HPLC-QTOF-MS of HM-CAI in the o/w mixture and the solubility of sink dissolution in PBS.
Using UHPLC-QTOF, we identified antibody fragments, peptides, and CBD in the remaining component from the octanol/buffered gel composite via HM-CAI and HN-CAI, with mass peaks at 613, 727, and 315 m/z (Figure 6C). The monoclonal antibody weighed between 30 and 40 μg. While insulin levels were lower at 10-12 μg as determined by the HPLC-UV, which revealed the unique properties of NIP see (Figure 6D), the effect of the combination of MIP on the release kinetics of the CBD and the antibody interaction was assessed.

Figure 6D: Analysis of amino acids for prolonged release of biotherapeutic proteins from HM-CAI and HN-CAI in o/w mixtures, along with solubility of mAb and insulin in PBS, based on 4 independent runs of 7 experiments each.
The pH and viscosity measurement
The pH values under experimental conditions are depicted in Figure 6A(d). NIP-C had an acidic pH of 1.88 to 1.92, increasing to 4.67 for N-CAI. The hydrogel HN-CAI had a pH of 3.90, while the non-gel MIP-CAI and MIP-C remained stable at 4.94. In contrast, HM-CAI had a pH of 4.37. Over 10 days in an octanol/PBS mixture, antibody and insulin levels in HM-CAI remained stable, with pH shifting slightly from 3.9 to 4.6 after active agent release. Viscosity measurements showed that mAb and insulin-loaded NIPs had a viscosity of 3.74 cP, while HN-CAI was 1.41 cP. HM-CAI’s viscosity varied from 4.27 cP to 1.60 cP, reaching 5.30 cP overall. At elevated biotherapeutic concentrations (ten times the initial component), HM-CAI shows a viscosity of 39.05 cP, decreasing to 37.8 cP after passing through the cellulose EPS matrix. This reduction is attributed to enhanced dipole-dipole interactions that strengthen liquid bridges formed by HSA [17], resulting in increased protein self-association and interactions between the Fc and FcRn domains onto the interfacial surface. The diffusion and binding affinity of the imprint-based carrier: A self-association between protein molecules and a viscous gel using PCL-T, where the viscous protein-concentrate affects the mass transfer of large biotherapeutic molecules within the macromolecular components. This strengthens the protein dynamics and mobility of molecules, based on the diffusion and binding affinity of the imprint-based carrier.
The mutual diffusion coefficients (Dm) were examined as a function of molecular complexes under constant CBD loading of the binding of rebound template molecules to the IgE receptor, influenced by an increasing number of molecules in the ABD see left panels (Figure 7). The results show diffusion coefficients of Dm=0.505 × 10⁻⁷ cm2/s (R2=0.9998) for HM-CAI and Dm=0.495 × 10⁻⁷ cm2/s (R2=0.9998) for HN-CAI. The corresponding selfdiffusion coefficients, Ds(Dmvalue at C=0) were Ds=-0.0027 for HM-CAI and Ds=0.0027 for HN-CAI, with HN-CAI indicating interaction parameters (kd values) varying from 4 to -3 over time. Three levels of interaction parameters were identified: positive (magnitude), zero (intermediate), and negative (minimum), reflecting molecular dissociation and binding site interactions. Both HM-CAI and HN-CAI exhibit self-association. HN-CAI begins with a negative kd that becomes positive, similar to HMCAI from days 4 through 13. After day 14, the kd turns positive, while HM-CAI remains predominantly negative, which indicate the attractive interaction of the intermolecular interaction between Fc and FcRn. Notably, HM-CAI exhibits a more significant increase in Dm values after CBD exposure compared to HN-CAI [31].

Figure 7: Right panel, Diffusion coefficients (Dm) plotted against mAb and insulin concentration. Left panel:Interaction parameter (kd) values over time, mean ± SD, n=8.
After 14 days, a notable increase in positive kd for HN-CAI with ADP. Decreased Dm values suggest that the binding affinity weakens over time, while structural changes in surfaceexposed proteins likely enhance stabilization through the imprinted binding sites. The result demonstrates that the diffusion rates related to protein’s interaction with the IgE receptor, MIPs, and control polymers showed similar performance. However, specific interactions with amino acids gradually decreased the binding affinity of imprinted molecule. The clustered association of peptides/proteins integrated into the IgE receptor within the ABD exists in a stabilized equilibrium state, leading to a significant increase in the average ratio of MIP to NIP during various dynamic processes of the biopharmaceuticals.
HMPhysicochemical characterization of the MIP for CBD/protein delivery
The physicochemical characterization of the MIP for CBD/protein delivery underscores advancements in DDSs. The UHPLC-QTOFMS analysis (Figure 8A) revealed the CBD with monoisotopic peaks at 315 m/z. To thoroughly analyze the degradation profiles of CBD and receptor dynamics related to effective drug accumulation, we employed UHPLC-QTOF-MS. In our analysis (see Figure 8B), we identified distinct CBD absorption peaks at 3301, 1643, and 1146 cm-1, alongside a notable peak for cholic acid at 1401 cm-1. The pronounced increase in the peak at 1150 cm-1, which inversely influenced the peak at 1643 cm-1, transitioned from the octanol-rich phase to the aqueous phase. A comparative analysis of recovery outcomes from octanol-buffered protein-unloaded and loaded NIP with various additives (refer to Figure 8B, a) revealed meaningful shifts in the FT-IR spectra of the filtered rapid release phase, particularly for HN-CAI across varying CBD loadings. The FT-IR spectra at the highest CBD loading in HM-CAI, as well as the spectra of the protein-unloaded MIP changes, displayed subtle molecular interactions, with variations in IR bands being minimal (99% correlation) (see Figure 8B, b), suggesting that the active components do not self-associate during dissolution. Furthermore, the merging of vibrational tones at 1643 and 1565 cm-1, combined with the decrease in intensity at 1150 cm-1 shifting to higher wavenumbers (illustrated in Figure 8B and c), highlights the high level of CBD’s potential to enhance protein interactions [32]. The FT-IR spectra of HM-CAI show medium-intensity peaks at 1647 cm-1 and 1456 cm-1, along with a prominent peak at 1146 cm-1 observed at low to medium CBD concentrations (see Figure 8B, d). Additionally, peaks at 1615, 1565, and 1460 cm-1 were also linked to CBD, while insulin exhibited a peak at 1683 cm-1. These findings confirm that variations in CBD loading do not negatively impact the secondary structure or crystallinity of the protein drug within HM-CAI. High-resolution FT-IR spectroscopy indicated structural changes in insulin within a matrix that related to antibody activity. The results suggest that small molecules clustered within the imprinted polymers, creating effective steric barriers and significantly enhancing the physicochemical properties of co-administered proteins. Additional findings indicated that the transport and diffusion of macromolecules depend on specific interactions that are influenced by amino acid ratios and molecular dynamics. In contrast, the NIP may interact with lysozyme, potentially influencing insulin aggregation [17].
Further, the studies on protein interactions, both with and without hydrogel, using SERS, indicated the following findings: Raman peaks observed at 1480 and 1150 cm-1 during prolonged exposure, along with shifts related to disulfide linkages in protein composed in HM-CAI. After 15 minutes of rapid protein exposure on hydrogel and non-hydrogel interfaces, the SER spectra for octanol/ buffered, HM-CAI, and HN-CAI showed consistent wavelengths, indicating stable protein interactions across the different BM compositions. A distinct highintensity peak between 1300 and 1200 cm-1 denotes the protein hydrate form after seven days, as shown in Figure 8C (insert). Prominent peaks at 1510, 1350, and 1150 cm-1 in Figure 8C (b) correspond to the CBD and protein mixture in the dried matrix, with additional significant peaks at 1150, 1345, 1480, and 1780 cm-1. Notably, no shifts or new bands were detected in the 1000-500 cm-1, confirming consistency across different mass separations and excipient concentrations. Figure 8C (c) highlights the typical SER spectrum of HM-CAI, showing medium-intensity peaks at 602, 807, 954, and 1050 cm-1, along with broad peaks at 2929, 2940, 3115, and 3110cm-1. Raman shifts in the 1210-1270 cm-1 range vary with CBD concentrations, while the 1350 cm-1 intensity suggests cholyl methacrylate groups at imprinted sites, indicating significant shifts in the 1300-1200 cm-1 range, suggesting the induction of steric barriers and enhancing the properties of co-administered proteins. In summary, the Ramanmapped spectra highlight the critical role of protein properties and membrane uptake efficiency. The exocyclic double bond of CBD enhances protein-small molecule interactions, leading to increased diffusion rates of biomolecules at higher concentrations. This is linked to greater mobility of methyl group fluctuations within the protein complex and altered absorption dynamics. Additionally, dihydroxyl groups on CBD improve membrane perturbation, slowing its transport and facilitating ion neutralization through self-associating proteins. Changes in protein volume within the membrane, supported by liquid bridges of the human serum albumin, further enhance protein interactions with the other additives. Consequently, higher CBD levels correlate with increased protein diffusion rates, resulting in the importance of solubility, ionic strength, and viscosity in loading kinetics [33].
The effect of CBD loadings on biocomposite-based MIP stability
This study investigates the effects of CBD on peptide stability and its implications for pharmaceutical applications. CBD levels affected the stability of the rapid-release phase of the filtered product from MIP-based DDS, with melting occurring at 110-117°C and weight loss at 210-230°C, as depicted in Figure 8D. Higher CBD concentrations increased the anhydrate peak and weight loss plateau between 219-263°C. The glass transition temperature (Tg) ranged from 200°C to 260°C for higher CBD. Higher CBD concentrations resulted in an enhanced intensity of the anhydrate peak (170°C to 290°C) and a weight loss plateau between 219°C and 263°C in TGA/DGA curves, indicating unique CBD-peptide interactions. In contrast, lower CBD levels led to decreased Tg and weight loss for HM-CAI, highlighting the role of CBD on peptide stability. TGA analysis indicates that CBD concentrations impact peptide stability, with stability being maintained above 265°C, as detailed in (Figure 8A,B,C,D,) (Table 5).
| DP | TGA/without | TGA/with the DA | pH* | MS/MS (m/z) | ||||
|---|---|---|---|---|---|---|---|---|
| Tg | Weight loss (%) | Tg | Weight loss (%) | Before | After | CBD | CDR-Fc (AUC) | |
| HM-CAI | ||||||||
| 1 | 244 | 27.98 | 212 | 4.8 | 4.30 ± 0.01 | 6.67 ± 0.01 | 315.1370(890), 315.1759(595) | 613.2178 (620) |
| 1/2 | 244 | 4.4 | 208 | 3.9 | 4.27 ± 0.03 | 6.67 ± 0.02 | 315.1377(925), 315.1745(210) | 613.2186 (13.5), 613.338 (6.35), 613.414 5 (6.27), 613.720 7 (7.10) |
| 1/4 | 240 | 9.1 | 210 | 4.1 | 4.22 ± 0.02 | 6.52 ± 0.04 | - | - |
| 0.1 | 207.5 | 1.72 | 207 | 4.4 | 4.26 ± 0.01 | 6.67 ± 0.01 | 315.1375(1000) | 613.1746 (8.25) |
| HN-CAI | ||||||||
| 1 | 238.7 | 36.47 | 208 | 7.3 | 4.10 ± 0.01 | 6.60 ± 0.01 | 315.1364(1170), 315.1761(570) | 613.7244(21) & 614.5-614.9 (280, 5 peaks) |
| 1/2 | 204.8 | 10.16 | - | - | - | - | - | - |
| 1/4 | 213.7 | 17.58 | - | - | - | - | - | - |
| 0.1 | 205.9 | 32.0 | - | - | - | - | - | - |
Table 5: Tg (the frozen glass temperature) and weight loss of the freeze-dried samples of rapid-release phase of (mAb/insulin)-loaded MIPs or NIPs comprising various CBD concentrations at the initial solution (0.75% w/v), pH and MS/MS (m/z) of the protein before and after the supplemented with the DA in pH 7.0 solution (20 mmol).
The amino acid analysis indicated alterations in the protein content within the polymer matrix and in the buffer at pH 7.4, contributing to the formation of a stable biocomposite, as depicted in (Figure 9A). This nanolayer has the potential to function as MIP carriers, which are critical for the binding of antibodies to CBD. The MIP system preserves the integrity of proteins while enhancing the functionality of FcRn within the deeper extracellular matrix and decelerating the convective flow into the underlying membrane. The gradual liquid flow, combined with nano-interstitial spaces, allows MIP-bound biomolecule and protein to rebound from the adsorbent. This rebound facilitates a spatial disturbance and a change in protein volume, leading to a temporary dimensional alteration in the protein-based drug delivery over the residual particles, thus promoting efficient antibody transport. The 1H-NMR and 13C-NMR analyses, illustrated in Figure 9B, showed the significance of the 4-aryl group in the antibody complex. The shifts observed in CBD’s 7’C and 10’-methyl signal at 2.2 and 2.4 ppm, along with the CH2 signals, indicated decreased levels of CBD, while the protons on the exocyclic double bond of CBD for DP were noted at 5.4 and 5.1 ppm, exhibiting a 25 Hz shift in HMPhysicochemical CAI and HN-CAI. A significant amplification of the multiple CH2 intensity in the 70-80 ppm range was observed in the 13C-NMR. Maximal stabilization is associated with the critical threonine proton at 3.5 ppm in NOESY (see Figure 9B), which modifies the protein hydration and reduces the transition temperature of the thermally sensitive subpopulation. This results in minimal weight loss between 200°C and 260°C in TGA/DTG analyses. These changes reduce protein abundance, affecting amino acid degradation (such as lysine) by enzymes, thereby improving HMCAI efficacy over HN-CAI (Figure 9B,C) [34].

Figure 8a: The UHPLC-QTOF-MS spectra for HM-CAI after the release of the active components. (B) The ATR-FTIR analysis of lyophilized proteins and CBD for NIP-C and NIPCAI, following exposure to co-incubated lysozyme and CPI (a), and for MIP-C and MIP-CAI (b); without the encapsulated hydrogel (c), the rapid-release phase of the filtered product from HN-CAI (d), specifically HM-CAI.

Figure 8b: AT-FTIR.

Figure 8c: SER mapping spectra.

Figure 8d: The concentration-dependent effects between the lyophilized sample reservoirs for HN-CAI and HM-CAI in phosphate solution. TGA, derivative TGA (DTG), and TGA/DSC curves at CBD loadings of 0.6, 0.32, 0.16, and 0.06 mmol.

Figure 9a: A typical chromatogram displaying 17 amino acids from the filtered device sample reservoir for HM-CAI and HN-CAI after permeation at the interfacial cellulose/PBS for 7 days.

Figure 9b: The effect of CBD loading on 1H-NMR, 13C-NMR, DEPT-90, COSY, and NOESY in D2O for a rapid-release phase lyophilized sample reservoir of HM-CAI and HN-CAI at various CBD loadings: 0.6, 0.32, 0.16, and 0.06 mmol.

Figure 9c: The effect of CBD loading on 1H-NMR, 13C-NMR, DEPT-90, COSY, and NOESY in D2O for a rapid-release phase lyophilized sample reservoir of HM-CAI and HN-CAI at various CBD loadings: 0.6, 0.32, 0.16, and 0.06 mmol.
The efficacy of protein uptake and targeted protein concentration
Figure 10A (a-b) shows different patterns of CBD uptake in HM-CAI and HN-CAI, where HM-CAI increases and HN-CAI decreases. The MIP/NIP ratio peaked at 3.3 during the first CBD transfer (under 2 hours), indicating substantial CBD accumulation before stabilizing at about 2.0 for higher concentrations and 1.2 for lower levels. Figure 10B (a-b) illustrates how CBD concentration affects protein uptake, with consistent log(sFc) values. The CBD transport rate from MIP-C is higher than from NIP-C. HN-CAI shows strong protein selectivity with significant transfer of the targeted protein (CDR), achieving an 8.6-fold increase in IF(MIP/NIP) for total protein abundance due to CBD’s influence. The MIP highlights the importance of the CBD-to-protein ratio at pH 7.4. This system uses EDMA-crosslinked hydrogel networks and MIP-based carriers to modulate therapeutic delivery. The surface properties derived from polar additives and the excipient-rich phase indicate a spatial disturbance and protein volume change, in NMR causing a temporary dimensional alteration in the protein concentrate due to water’s reverse movement through the nanoporous membrane. As a result, HM-CAI achieves a protein concentration of 2.91 mg·g⻹/ mm³, significantly higher than HN-CAI’s 0.336 mg·g-1/mm3. This increased concentration enhances pH stability and improves protein uptake during CBD release, thereby affecting dissolution and transference dynamics.
Consequently, NIPs enhance distribution but yield lower protein levels and show amino acid proportions that vary from 23% to 44% across CBD loadings, as illustrated in the circle histogram in Figure 10C. In contrast, MIPs achieve approximately 53% amino acid composition at the same loadings, except the high CBD loading. The molecular recognition of CAI causes notable changes in the cellular lysate matrix, promoting the uptake of protein and peptide and enhancing the diffusion of recognized molecules for macromolecular transport. The higher polarity of biotherapeutics at the interfacial membrane enhances their diffusion, as evidenced by the superior CBD loading that exceeded that of HN-CAI (see Figure 10C, bottom panel). Research indicates that dipeptides are crucial for the release of monoclonal antibodies [34]. Additionally, the incorporation of 17 amino acids significantly improved absorption during the incubation period from days 2 to 3, leading to notable changes in the protein complex composition, particularly at the 0.32 mmol CBD concentration. This mass sink is influenced by factors such as membrane association and variations in solute polarity. In contrast, for all the CBD loading, HN-CAI notably increases histidine levels, which modulates the adsorption of lysozyme, leading to the pH stability are influenced by secondary agglomeration and protein reorientation due to charge effects. Additionally, proline of hinge regions is vital for the stability of antibodies and insulin, despite a decrease in their protein composition. This emphasizes the important roles of histidine and proline in optimizing protein interactions and stability. Differences in the relative content of amino acid reuptake between HM-CAI and HN-CAI were observed due to CBD loadings. Importantly, charged amino acids remain unaffected at physiological pH levels (7 to 7.5), where the isoelectric points of biopharmaceutical agents like mAb, insulin, HSA, and lysozyme exceed pH 7, minimizing concerns about selfaggregation and degradation. The dehydrolysis products (217 m/z) in the NIP formulation with a high load of CBD. Meanwhile, the MIP formulation showed greater stability for CBD, as indicated by the MS peak at 315 m/z. We found that approximately 10.3% of the CBD degraded to 385 m/z in the MIP formulation, whereas the NIP formulation showed a concerning disappearance of CBD corresponding to 385 m/z, 386 m/z, and 361 m/z [M+2Na]+.
Microbiological assessments of nanofiltration lysates confirmed the clearance of viruses and bacteria, revealing undetectable levels of S. aureus, E. coli, and Salmonella spp. While a minor coliform count was noted at maximum CBD loading for HM- CAI, the system effectively reduced viral interference and microorganisms. Enzyme activity measurements and SEM- EDX mapping supported this finding. Fluorescence intensity from X-ray microscopy indicated that sulfur and potassium had lower adsorption energies in the NIP carrier, while phosphorus remained stable (Figure 10).

Figure 10: Logarithm of CBD concentration (Log(C) as a function of time for (a) HM-CAI and (b) HN-CAI, when released through the EPS cellulose membrane (n=7). Panel (c) imprinting efficiency [IF(MIP/NIP)]. Panel B: The effect of CBD loading on (a) log(sFc) attributed to the presence of a single small fragment of antibody, and (b) the protein abundance measured by [IF(MIP/NIP)] through amino acid analysis. Total protein data for HN-CAI (a-d) and HM-CAI (e-h) are presented at CBD levels of 0.6, 0.32, 0.16, and 0.06 mmol. Amino acid amounts are shown in μg/g (n=3), with standard deviations from 0.15 to 6.1. Print color is provided for clarity.
The importance of antibody CDR peptides in CBD metabolism
The study of HSA-MIP carriers in nonpolar and water-based environments shows improved antibody transport and a biological response. As shown in AFM, Figure 11A reveals that a nanolayer composed of the aqueous-soluble biocomposite, the liquid absorbed by HM-CAI affects amino acid interactions important for antibody binding to CBD, demonstrating how different CBD concentrations impact HM-CAI nanocapsules, or microspheres, at the liquid/matrix interface. This process is guided by CBD binding concentration over a week. Raman analyses intriguing raman shifts between 1350-1420 cm⻹ that relate to the amino acid side chains of the nanocapsule’s HM-CAI, for the higher peak intensity at 1640 and 1730 cm⻹ and degradation with the detection of free CBD at 1330 cm⻹ linked to amino acid side chains in the HM-CAI, see in Figure 11A. This result indicated enhancement in convective flow positively influences antibody transport and the delivery of CBD from these carriers, greater than that with the permeated dopamine effectively limiting the penetration of larger macromolecules as demonstrated through Atomic Force Microscopy (AFM) in top panel (Figure 11A). Various CBD levels largely lack the target protein, corresponding to modifications to hydroxyl groups of the cholate-MAA system and carbonyl of carboxylic acid to carboxylate ester of the peptides and strongly influence mAb interactions in FT-IR, in Figure 11B, and NOESY analyses of the lyophilized powder from the phosphate- rich phase of various CBD loading show changes in hydrogen bonding within protein networks, suggesting improved metabolism and clearance of Fc with interacting CBD to the protein carrier. We confirmed the presence of CBD within mAb devices and validated the existence of thiol groups (Figure 11B). In Figure 11C, steady-state concentration correlates with increased CBD loading levels, highlighting the impact of water adsorption on optimizing biomolecule interactions in recycled protein compositions. The rapid-release phase of gel behavior is crucial for the interaction between CBD and total protein abundance. Factors such as the IgG concentration at an altered volume of protein, based on the substantial biocomposite and buffer density, temperature, and the pressure transitions of the proteins in the octanol/buffer phase, affect the reuptake efficiency of the biotherapeutic agents. Interactions between DA and antibodies exhibited a specific CBD mass and a lower transition temperature, as evident in TGA. For HM-CAI with moderate CBD loading, no weight loss occurred between 200°C and 260°C, reinforcing the role of CDR peptides in stabilizing mAbs.

Figure 11a: AFM-SER spectra of the drug delivery system after the nanofiltration process, incorporating the permeated dopamine (DA).

Figure 11b: Franz's diffusion test by adding permeated Dopamine (DA) to the donor phase containing the hydrogen carbonate buffer. FT-IR analysis on the lyophilized powder from the phosphate-rich phase.

Figure 11c: The concentration of free drugs at the targeted site changes over time.
We also observed oxidative degradation of CBD with a molecular mass of 345 m/z, corresponding to C21H28O4 (neutral), in the samples. It is essential to note that hydrophilic metabolites, such as 7-OH and 7-COOH, can contribute to biomolecule oxidation. Hence, we examine the effects of varying CBD concentrations on proton coupling. Further analysis utilizing FT-IR and 1H NMR revealed notable hydrogen bonding effects on Fc metabolism, which improves the overall performance of the nanocapsules, AFM images in Figure 11C, with consistent shifts in peptide protons, showing the solubility of CBD and dehydrated mAb/insulin dropped at 40°C. The observation of channel hydrates of the biocompositions dried on the cellulose/PBS interface after the payloads in sink dissolution and diffusion. The results confirm the metabolites of CBD through 13C-NMR, as well as DEPT-90 (Figure 11D), highlighting carboxylated degradation products, suggesting that the payloads in the extracellular lysate enable the antibody to bind to cell-surface receptors and degrade the biocomposite, aligning with previous studies on piglet liver metabolism (Figure 11C,D) [19].
The analysis using the direct probe UHPLC-QTOF-MS/MS revealed hydrolyzed CBD (m/z 345) and dehydrolysis products (m/z 217) in the NIP formulation. In contrast, the MIP formulation demonstrated greater stability for CBD, with a mass spectrometry peak at 315 m/z. Additionally, we evaluated the degradation profiles and antibody longevity through the direct probe UHPLCQTOF- MS analysis. The data summarized in Table 5 provide ion mass information for CDR fragments and CBD.
We observed an inverse relationship between cellular matrix density and antibody levels in cellulose-based biomembranes, as depicted in Figure 11E (a and b). Varying CBD concentrations affected protein abundances, highlighting different binding characteristics in HM-CAI compared to HN-CAI. After recycling filtration, HM-CAI exhibits higher protein levels with decreasing CBD loading, whereas HN-CAI maintains a strong linear relationship. The relationship between apparent mass transfer and protein concentration varies for the mAb molecule in the HM-CAI and NIP systems, as determined by linear regression (see Figure 11E, c). After recycling filtration, we found that HM-CAI showed higher protein levels as CBD loading decreased, unlike HN-CAI. This result suggests that a test ligand modifier enhanced the efficiency of the imprinted sites in MIP nanocapsules. Degradation profiles indicated that target depletion in HM-CAI was six times lower at 0.06 mmol CBD compared to 0.6 mmol see (Figure 11E, d). While the HN-CAI had minimal target protein levels, as evidenced by a negative log (sFc). Moreover, a significant enhancement in binding to the site at a CBD concentration of 0.32 mmol, where we have observed a remarkable increase in target depletion within HM-CAI. Therefore, our findings highlight that MIP carriers significantly increase the longevity of antibodies. Following recycling filtration, HM-CAI demonstrates increased protein levels as CBD loading decreases, contrasting with HN-CAI, and exhibits strong linearity (R²>0.9998). The results suggested the differences in structure and thermal behaviors in MIPs during hydration. This process involves the adsorption of firmly bound water, followed by the condensation or clustering of water around the hydrated sites within the imprints when the biomolecules were co-diffused and transported (Figure 11E).

Figure 11d: The NOESY of the reconstituted phosphate-rich phase of the antibody/protein-loaded MIP in the reservoir, after incubation with the permeated dopamine during nano filtration.

Figure 11e: The amount of amino acids changes based on CBD concentrations and the relationship between total protein amounts (using the square root) for HN-CAI and HM-CAI. (D) The log(sFc) from the UHPLC-QTOF-MS analysis of the targeting peptide (a small single fragment antibody) are presented at CBD levels of 0.6, 0.32, 0.16, and 0.06 mmol. (mean ± sd, n=5).
The apparent weight average molecular weight, Mw, app at each radial position was defined with the following equation [23]:
where Cr is the IgG concentration at the radial position (0.3 mg/ml) r, Cp is the initial loading protein concentration (4 mg/ml), n is the partial specific volume (HM-CAI=281.17 mm3; HM-CAI=158.56 mm3), r is the buffer density, w is the angular velocity, or is the reference radial position (HM-CAI=4.126 mm; HM-CAI=6.810 mm), R is the gas constant (8.314 J/mol), and T is temperature=298 and 313 (kelvin). The apparent weight average molecular weight as a function of protein concentration for the mAb molecule in the HM-CAI and HM-CAI was obtained from linear regression of the slope of the log (protein concentration) vs. radial position (ln c vs. r2/2 plot). The corrections for the charge and excluded volume were obtained. For the relationship between Mw at weight/volume concentration, c, and the molecular weight of the CDR fragment of the antibody, Mw=613 Da:
where g is the activity coefficient of the mAb molecule, and Corr(c) is the multiplicative correction factor. The results showed a compelling relationship between rapid-release phases, particle sizes, and zeta potential within nanocapsules, where the rapid release phase was characterized by a particle size of 636.6 ± 6.4, a polydispersity index of 0.108, and a Zeta potential of -16.03. Recent advancements in fluorescence microscopy have revealed the existence of subvisible particles within HM-CAI as illustrated in (Figure 11F). This result is further corroborated by the application of convolutional neural networks. This comprehensive study has identified a range of particle morphologies, that play a critical role in addressing the inherent challenges in the manufacturing and storage of pharmaceutical products. These findings underscore the need for a sustainable optimization approach that enhances product quality and stability.

Figure 11F: The fluorescence image displays the eye frog biocomposite positioned on a layer of therapeutic material. It illustrates the contours of a convolutional neural network, showcasing various particle shapes along with the thick liquid from the filtered reservoir.
Additionally, we also examined the physicochemical properties of CBD, which are utilized in the body, enabling certain parts of the immune system to function more effectively through the use of advanced tools. Addressing challenges such as inflammatory responses is essential, although innovative strategies are emerging. Additionally, future analysis of downregulating the engagement of IgE receptors offers a viable approach to alleviate allergies, and progress in biotherapeutics will positively impact patient outcomes. The study emphasizes the importance of conducting drug analyses using environmentally friendly components, particularly those involving polymers that are integrated into nanocapsules. Investigating these materials under various stress conditions is vital for gaining insights into protein aggregation processes, which can significantly influence monoclonal antibodies in conjunction with insulin, specifically targeting anti-IgE antibody, presents a novel approach to modulating immune responses. This combination aims to enhance bioavailability, which is crucial for the effective management of conditions related to chronic therapeutic regimens [35].
Conclusion
We have developed a novel carrier designed to deliver Molecularly Imprinted Polymer (MIP) drugs effectively, particularly in waterbased environments. The results demonstrate the remarkable potential of N-Acetyl Glucosamine (NAG), Wheat Germ Agglutinin (WGA), and Human Serum Albumin (HSA) in creating MIPs that enhance the delivery of antibodies and insulin. We're particularly accomplished about the HSA-MIP, which provides release rates of cannabidiol. Furthermore, a significant finding is that the MIP carrier biodegrades through enzyme interactions, which promote drug-protein binding and facilitate antibody selfassociation, contributing to effective therapeutic solutions. By leveraging a self-assembling MIP system, not only can biomolecular structures be stabilized, but also the delivery of high-concentration CBD can be optimized, significantly improving drug effectiveness and bioavailability. Higher CBD concentrations improved the imprinting factor, preserved proteins, and reduced protease levels; hence, mixing recognition material with CBD promotes drug dissolution, yet enhances pH stability and improves protein uptake during CBD release, thereby affecting dissolution and transference dynamics. The composition-compatible components within the sophisticated formulation of MIP-hydrogels exhibit a viscosity characteristic of high protein concentration after passing through the cellulose EPS matrix.
The solubility of CBD and dehydrated mAb/insulin in Raman Mapping spectra matched our results from Field-Emission- Scanning electron microscopy and X-ray analysis, as well as solvent evaporation, and pulling molecular size through dynamic of molecule in water, resulting in structural changes in insulin within a matrix that correlated with antibody activity as alteration in the protein concentrate due to water's reverse movement through the nanoporous membrane. Studies using HPLC-UV and LC/MS-MS show that CDR peptides can bind and release in our MIP-based drug delivery system. The results highlight that the small fragment peptides enhance the stability and effectiveness of monoclonal antibodies (mAbs), which is crucial for drug-protein binding and dissociation of antibody CDR peptides in human serum albumin, as well as CBD metabolism. Rapid release phases are intricately linked to the formation of protein blend-associated nanocapsules of the MIP's drug. The resulting MIP nanocapsules play a crucial role in facilitating the delivery of anti-IgE antibodies and insulin, thereby optimizing the function of antibody CDR peptides. The results indicated that the biodegradability of MIPs in enzyme-rich nanocapsules offers promising possibilities for utilizing 3D printing in drug delivery systems. This innovative system holds promise for applications in new therapies, through single-dose strategies, improved health outcomes, and paving the way for transformative patient care.
Acknowledgements
The Fundamental Fund, under the subtrack “Creativity”, Project title “Development of Polymyxin B Formulation and Study of Biological Activity” (PHA6801059S), hosted by Prof. Dr. Teerapol Srichana, is acknowledged. We thank Dr. Krishna Mahesh for the preparation of the permeated dopamine in an aqueous system, Naruedom Tangthong for the bacterially derived cellulose membrane, Miss Apinya Sukulrut for AFM work, and Miss Pojchanad Putburee at OSIT, Prince of Songkla University, for the suggestions in the Microbial assay.
Conflicts of Interest
The authors declare that they have no conflict of interest.
Funding
This research received no external funding.
Author Contributions
Conceptualization, R.W.K.J.P.; methodology and experiment, R.W.K.J.P.; analysis, R.W.K.J.P.; investigation, R.K.J.P.; original draft preparation, R.W.K.J.P.; writing, review, and editing, R. and W. All authors have read and agreed to the published version of the manuscript.
References
- Gagliardi M. Design and development of molecularly imprinted biodegradable polymers for nanomedicine. Adv Ind Eng Polym Res. 2023;6(4):396-406.
- Bakhshi V, Poursadegh H, Amini-Fazl MS, Salari D, Javanbakht S. Synthesis and characterization of bio-nanocomposite hydrogel beads based on magnetic hydroxyapatite and chitosan: A pH-sensitive drug delivery system for potential implantable anticancer platform. Polym Bull. 2024;81(8):7499-7518.
- Sullivan MV, Dennison SR, Archontis G, Reddy SM, Hayes JM. Toward rational design of selective molecularly imprinted polymers (MIPs) for proteins: computational and experimental studies of acrylamide based polymers for myoglobin. J Phys Chem B. 2019;123(26):5432-5443.
- Hou T, Zhang N, Yan C, Ding M, Niu H, Guan P, et al. Curcumin-loaded protein imprinted mesoporous nanosphere for inhibiting amyloid aggregation. Int J Biol Macromol. 2022;221:334-345.
- Chan A, Haley RM, Najar MA, Gonzalez-Martinez D, Bugaj LJ, Burslem GM, et al. Lipid-mediated intracellular delivery of recombinant bioPROTACs for the rapid degradation of undruggable proteins. Nat Commun. 2024;15(1):5808.
- Yoshida T, Kojima H. Subcutaneous sustained-release drug delivery system for antibodies and proteins. AIMS Biophys. 2025;12(1):69-100.
- Varshosaz J, Jandaghian S, Mirian M, Sajjadi SE. Co-delivery of rituximab targeted curcumin and imatinib nanostructured lipid carriers in non-Hodgkin lymphoma cells. J Liposome Res. 2021;31(1):64-78.
- Bryniarski MA, Tuhin MT, Shomin CD, Nasrollahi F, Ko EC, Soto M, et al. Utility of Cellular Measurements of Non-Specific Endocytosis to Assess the Target-Independent Clearance of Monoclonal Antibodies. J Pharm Sci. 2024;113(10):3100-3111.
- Stephens EA, Ludwicki MB, Meksiriporn B, Li M, Ye T, Monticello C, et al. Engineering single pan-specific ubiquibodies for targeted degradation of all forms of endogenous ERK protein kinase. ACS Synth Biol. 2021;10(9):2396-2408.
- Andya JD, Maa YF, Costantino HR, Nguyen PA, Dasovich N, Sweeney TD, et al. The effect of formulation excipients on protein stability and aerosol performance of spray-dried powders of a recombinant humanized anti-IgE monoclonal antibody1. Pharm Res. 1999;16(3):350-358.
- Costantino HR, Curley JG, Wu S, Hsu CC. Water sorption behavior of lyophilized protein–sugar systems and implications for solid-state interactions. Int J Pharm. 1998;166(2):211-221.
- Mester S, Evers M, Meyer S, Nilsen J, Greiff V, Sandlie I, et al. Extended plasma half-life of albumin-binding domain fused human IgA upon pH-dependent albumin engagement of human FcRn in vitro and in vivo. InMAbs 2021;13(1)1893888.
- Zürcher D, Caduff S, Aurand L, Palmiero UC, Wuchner K, Arosio P. Comparison of the protective effect of polysorbates, poloxamer and Brij on antibody stability against different interfaces. J Pharm Sci. 2023;112(11):2853-2862.
- Hong L, Ye T, Wang TZ, Srijay D, Liu H, Zhao L, et al. Programmable protein stabilization with language model-derived peptide guides. Nat Commun. 2025;16(1):3555.
- Abdella S, Kim S, Afinjuomo F, Song Y, Upton R, Garg S. Combining the potential of 3D printed buccal films and nanostructured lipid carriers for personalised cannabidiol delivery. Drug Deliv Transl Res. 2024;14(4):984-1004.
- Woods KN. Modeling of protein hydration dynamics is supported by THz spectroscopy of highly diluted solutions. Front Chem. 2023;11:1131935.
- Ziaunys M, Sakalauskas A, Sneideris T, Smirnovas V. Lysozyme fibrils alter the mechanism of insulin amyloid aggregation. Int J Mol Sci. 2021;22(4):1775.
- Belliveau PP. Omalizumab: A monoclonal anti-IgE antibody. Med Gen Med. 2005;7(1):27.
- Koch N, Jennotte O, Lechanteur A, Deville M, Charlier C, Cardot JM, et al. An intravenous pharmacokinetic study of cannabidiol solutions in piglets through the application of a validated ultra-high-pressure liquid chromatography coupled to tandem mass spectrometry method for the simultaneous quantification of CBD and its carboxylated metabolite in plasma. Pharm. 2024;16(1):140.
- Liu F, Wawersik S, Tomlinson S, Thurman JM, Holers VM. Tissue-targeted regulators of complement for amelioration of human disease: Rationale and novel therapeutic strategies. J Immunol. 2025:53.
- Simard JR, Zunszain PA, Hamilton JA, Curry S. Location of high and low affinity fatty acid binding sites on human serum albumin revealed by NMR drug-competition analysis. J Mol Biol. 2006;361(2):336-351.
- Singha Roy S, Nagappan S, Satheesan AK, Karmakar A, Kundu S. Surface-Enhanced Raman Scattering Coupled with In Situ Raman Spectroscopy for the Detection of the OER Mechanism: A Mini-Review. J Phys Chem. 2024;128(33):13634-1350.
- Yadav S, Sreedhara A, Kanai S, Liu J, Lien S, Lowman H, et al. Establishing a link between amino acid sequences and self-associating and viscoelastic behavior of two closely related monoclonal antibodies. Pharm Res. 2011;28(7):1750-1764.
- Vázquez-Cancino R, Rodríguez-Morales S, Del Carmen Jiménez-Pérez Ne, Peña-Morán OA, Cerón-Romero L, Sánchez-Lombardo I, et al. Untargeted metabolic analysis using LC-Q-TOF-MS and toxicity assessment of Eryngium foetidum in zebrafish embryos. Acta Pharm. 2025;75(1):133-146.
- Geissler K, Manafi M, Amoros I, Alonso JL. Quantitative determination of total coliforms and Escherichia coli in marine waters with chromogenic and fluorogenic media. J Appl Microbiol. 2000;88(2):280-285.
- Kobayashi T, Kusunoki T, Zhang Q, Takeda K. Bile acid imprinting polymers prepared by covalent-ester monomer-template technique: synthesis, characterization and fluorescence application for BA recognition. J Chem Eng Japan. 2007;40(6):516-522.
- Peppas NA, Klier J. Controlled release by using poly (methacrylic acid-g-ethylene glycol) hydrogels. J Control Release. 1991;16(1-2):203-14.
- Elnatan D, Agard DA. Calcium binding to a remote site can replace magnesium as cofactor for mitochondrial Hsp90 (TRAP1) ATPase activity. J Biol Chem. 2018;293(35):13717-1324.
- Morrissey A, Parachuru L, Leung M, Lopez G, Nakamura TY, Tong X, et al. Expression of ATP-sensitive K+ channel subunits during perinatal maturation in the mouse heart. Pediatr Res. 2005;58(2):185-192.
- Separovic F, Lam YH, Ke X, Chan HK. A solid-state NMR study of protein hydration and stability. Pharm Res. 1998;15(12):1816-1821.
- Joshi AB, Rus E, Kirsch LE. The degradation pathways of glucagon in acidic solutions. Int J Pharm. 2000;203(1-2):115-125.
- Singh SN, Yadav S, Shire SJ, Kalonia DS. Dipole-dipole interaction in antibody solutions: Correlation with viscosity behavior at high concentration. Pharm Res. 2014;31(9):2549-2558.
- Witeof AE, Daniels AL, Rea LT, Movafaghi S, Kurtz K, Davis M, et al. Machine learning and accelerated stress approaches to differentiate potential causes of aggregation in polyclonal antibody formulations during shipping. J Pharm Sci. 2021;110(7):2743-2752.
- Bywater R, Eriksson GB, Ottosson T. Desorption of immunoglobulins from Protein A-Sepharose CL-4B under mild conditions. J Immunol Methods. 1983;64(1-2):1-6.
- Jennotte O, Koch N, Lechanteur A, Evrard B. Formulation and quality consideration of cannabidiol printed forms produced by fused-deposition modeling. J Drug Deliv Sci Technol. 2023;87:104837.
Citation: Suedee R, Pholsathien W, Jaisawan K, Rodruksa J, Khomintr P (2025). Molecularly Imprinted Polymers: Paving the Way for Future Drug Delivery Innovations. Pharm Anal Acta. 16:822.
Copyright: © 2025 Suedee R, et al. This is an open-access article distributed under the terms of the Creative Commons Attribution License, which permits unrestricted use, distribution, and reproduction in any medium, provided the original author and source are credited.