

Indexed In
- Open J Gate
- Genamics JournalSeek
- Smithers Rapra
- RefSeek
- Directory of Research Journal Indexing (DRJI)
- Hamdard University
- EBSCO A-Z
- OCLC- WorldCat
- Scholarsteer
- Publons
- Geneva Foundation for Medical Education and Research
- Google Scholar
Useful Links
Share This Page
Journal Flyer
Open Access Journals
- Agri and Aquaculture
- Biochemistry
- Bioinformatics & Systems Biology
- Business & Management
- Chemistry
- Clinical Sciences
- Engineering
- Food & Nutrition
- General Science
- Genetics & Molecular Biology
- Immunology & Microbiology
- Medical Sciences
- Neuroscience & Psychology
- Nursing & Health Care
- Pharmaceutical Sciences
Research Article - (2025) Volume 15, Issue 1
Kinetic and Thermodynamic Studies of Used Palm Olein Oil Using Alkaline-Activated Rice Husk as An Adsorbent
Mohammed J.G*, Uthman H, Aboje A.A, Afolabi A and Azeez O.SReceived: 11-Nov-2023, Manuscript No. ACE-23-23889; Editor assigned: 13-Nov-2023, Pre QC No. ACE-23-23889 (PQ); Reviewed: 29-Nov-2023, QC No. ACE-23-23889; Revised: 03-Jan-2025, Manuscript No. ACE-23-23889 (R); Published: 13-Jan-2025, DOI: 10.35248/2090-4568.25.15.354
Abstract
In this study, the effectiveness of bleaching used palm olein oil was investigated using alkaline-activated rice husk as an adsorbent. The rice husk sample was activated with Potassium Hydroxide (KOH). Characterization of the raw and Alkaline-Activated Rice Husk (AARH) was carried out using Brunauer-Emmett-Teller (BET) and Scanning Electron Microscopy (SEM). The AARH shows an improvement in the total surface area (65.220 m2/g) compared to the raw rice husk (60.500 m2/g). SEM micrograph investigation reveals an improvement in the morphological characteristics of the AARH. The examination of the bleached used palm olein oil using Fourier Transform Infrared spectroscopy (FT-IR) reveals the existence of distinctive functional groups. To evaluate the effectiveness of the bleaching process, operating temperature, contact time, and adsorbent dosage were varied. As the temperature and adsorbent dosage increased, the bleaching efficiency increased as well. A bleaching efficiency of 53.17% was recorded as the best. The adsorption process at 80°C is best described by the pseudo-second-order kinetic model, which has a coefficient of determination, R2, of 0.9848. The Temkin isotherm model offered the most accurate fitting for the adsorption figures, with the highest values of R2 (0.5395, 0.9967, 0.9650, and 0.9990) at temperatures of 60°C, 70°C, 80°C, and 90°C, respectively. The thermodynamic analysis of the adsorption process produced positive values for the Gibbs free energy, ΔG0, proving that the adsorption process was non-spontaneous and exothermic with increasing temperature. This investigation has proven that rice husk can be converted into an effective and efficient alkaline-activated adsorbent for vegetable oil bleaching.
Keywords
Used palm olein oil; Rice husk; Alkaline-activation; Kinetic study; Thermodynamic study
Introduction
Used cooking oil is waste vegetable cooking oil from industrial and households. The good and new cooking oil is used for cooking more than 3-4 times during the preparation process under high temperatures (160°C-180°C). When used cooking oil is exposed to either air or water during the frying process, the oil's quality degrades to the point that it can no longer be relied on for further frying and must be disposing of. Used vegetable oils are categorized as wastes in the EU waste catalog under the classification of edible oils and fats and thus may be employed as waste raw materials with additional value upon collection.
Deep frying is a method of cooking that includes submerging food in heated oil at temperatures ranging from 120°C to 190°C. Following its capacity to generate unique textures, flavors, and looks in foods, this approach is frequently utilized in diverse cuisines around the world. During frying, oxygen, moisture, high temperatures, and component leaching in the food cause vegetable oils to oxidize and hydrolyze (hydrolyze lipids, break down, and oxidize unsaturated bonds in fatty acids). Numerous degradation byproducts, including volatile and non-volatile compounds, are consequently created and accumulated. Volatile substances such as aldehydes, ketones, hydrocarbons, alcohols, acids, and esters, as well as aromatic substances like hexane, octane, heptadienal, and pentanol, are produced in frying oil depending on the fatty acid composition and state of preservation of the vegetable oil. Aldehydes are considered to be among the most hazardous substances since they are present in the highest concentrations, are easily absorbed by cooked food, and could be harmful to human life. The volatile compounds, which have a significant impact on the flavor of the frying oil as well as the fried food, are mostly absorbed from the oil and released to the environment through the steam during frying. The accumulation of non-volatile chemicals (total polar compounds) in frying oil, which encourages further breakdown, and their absorption by fried food, which alters the physiological and nutritional properties of the oil, make them a source of particular concern. Intake of a diet made from regularly heated oil may increase the risk of serious health problems such as cardiovascular disease, cancer, impaired renal function, hepatorenal toxicity, hypertension and atherosclerosis [1].
According to recent research, the production of used frying oils accounts for around 20–32 percent of total vegetable oil use. As a result, it is predicted that approximately 42 million tons of cooking oil are produced globally each year. Many environmental and economic difficulties arise when used oils are discarded within solid wastes or via drains and sinks. This may raise the running costs of waste and sewage treatment plants, accelerate the spread of pests and vectors, cause environmental and public health problems, and cause damage to infrastructure. Furthermore, dumping used oils into soil resources can harm the ecosystem since oil blocks soil from water and air, killing beneficial natural species like bacteria and worms. Used oil contamination in water bodies could obscure sunlight and limit oxygen levels, harming aquatic wildlife and plants. Refining of used vegetable oils is highly recommended in other to forestall the negative effect mentioned above.
Food processing industries produce waste when transforming unprocessed materials (raw) into valuable products. Researchers have focused on converting biodegradable waste from food, such as rice husk, groundnut hull, orange peel, etc., into a useful material. If there is no viable solution, such as conversion into adsorbent, biodiesel, or other usable resources, the growing amount of waste from food and other materials will become an important threat to the environment. Despite regulations and laws put in place by the government, there appears to be an upsurge in the disposal of waste bleaching materials. In Nigeria, most of the bleaching materials employed are traditional, while some of them cannot be reclaimed, causing environmental pollution. This can be mitigated to some extent by using renewable agricultural waste materials in bleaching processes.
Rice is the third highest cultivated cereal crop globally. In 2019, the Asia-Pacific region produced and consumed more than 90% of the world's rice, according to the Food and Agriculture Organization of the United Nations. The prominent producers of rice are India and China, with the production of 177.6 million metric ton and 211.4 million metric ton respectively. Rice husk are hard coverings that protect the rice grains during the growing season which accounts for 20% of the 677.0 million tons of rice produced annually worldwide. Two hundred kilogram of rice husk is produced for every one thousand kilogram (1 ton) milled paddy rice and forty kilogram of rice husk ash is generated from two hundred kilogram of rice husk incinerated. When rice husk is burned in an environment with no added oxygen, they produce Rice Husk Ash (RHA). The world produces 20 million metric tons annually. RH is difficult to handle and transport due to its low density and little commercial interest, which leads to disposal issues and significant environmental challenges. Rice husk has been widely utilized to adsorb phenolic compounds, copper, lead, 2,4-dichlorophenol, cadmium, zinc and manganese, oil and oil products, dye and fluoride. RHA is used to make activated carbon, silica gels, porous carbon, silica, zeolites, silicon nitride, silicon carbide, catalysts, cordierite, lithium-ion battery parts, graphene, carbon capture, and energy storage/capacitors. It is also used to make insulating materials for light weight construction, silica, cordierite, silicon nitride, and silicon carbide. Other uses for silicon based materials include making soluble silicate, silicones and their alloys, silicon based compounds, and fillers for reinforcement in natural and synthetic rubber [2].
In general, soluble organic compounds can be extracted from rice husk through the pretreatment process by applying a variety of modifying agents, such as base and acid solutions. Since base solutions remove inorganic substances like carbonate and silica from the surface of rice husk, treating rice husk with them has been utilized to improve its adsorption properties. This article provides the findings of a study that examined how chemical treatments affected the potential of an alkaline-activated rice husk adsorbent to bleach used palm olein oil and determined the bleaching efficiency. The Brunauer-Emmet-Teller (BET) method was used to analyze the raw rice husk and the adsorbent (alkaline activated rice husk) so as to measure the total surface area, pore size, and pore volume. Scanning Electron Microscopy (SEM) was used to examine the surface morphology of the raw rice husk and the alkaline activated rice husk adsorbent. We also used Fourier Transform Infrared (FTIR) spectroscopy to characterize and evaluate the physicochemical features of the bleached and unbleached used palm olein oils, and we used the batch technique to examine the impact of contact duration on the adsorption process. The findings of the investigation will advance our understanding of alkaline activation and offer guidance for producing alkaline-activated rice husk on an industrial scale. Using rice husk that is locally sourced, this process would help to reduce importation and boost the Nigerian economy [3].
Materials and Methods
A bag of rice husk was purchased from a nearby milling center, and a 5-liter gallon of used palm oil was purchased from an Akara vendor, all in Kasuwan Gwari Market in Minna, Niger State. The high quality analytical chemicals that were used had been purchased from Panlac Chemical Store in Keteren Gwari Minna, Niger State, Nigeria [4].
Adsorbent preparation
400 g of rice husk was weighed using the digital scale and placed into a 1000 ml conical flask. 500 ml of a 5.0 M potassium hydroxide solution was poured into the flask to activate the pores of the rice husk. The mixture was stirred and allowed to rest for about two hours at room temperature. Then, while being shaken occasionally, the solution was heated for three hours at 100°C. The pH (Ë?7) of the solution was measured with a pH meter to confirm that the sample's pH was neutral after washing the alkaline-treated rice husk in an adequate volume of distilled water. The neutrally activated rice husk was then dried for a further 12 hours at 70°C, and then sieve using 0.25 mm mesh size.
Acid degumming
500 ml of used palm olein oil were placed in a conical flask and placed in a thermostatic water bath shaker set at 85°C. Two (2) ml of Phosphoric acid (H3PO4) was then added to the mixture. The solution was stirred for ten minutes so as to thoroughly degum the oil. To help dissolve the hydratable gums and make sure the palm olein oil is free of gums, twenty (20) ml of distilled water were poured into the heated oil acid solution that had been divided into portions so as to help remove the hydratable gums as well as ensure that the used palm olein oil is free of gums. This was achieved by using a centrifuge machine for 5 minutes at 4000 rpm [5].
Neutralization
Used palm olein oil that had been degummed was neutralized by mixing 200 g of oil with 20 ml of sodium hydroxide (0.1 M) solution, producing stock soaps. After adding, stirring for ten minutes, and letting the mixture split into two layers, a centrifuge machine was employed to separate the oil stock soaps for five minutes at a speed of 4000 rpm.
Bleaching process
The neutralized used palm olein oil was bleached using a glass beaker that served as the bleaching container. The bleaching container (250 ml) was filled with 35 g of neutralized used palm olein oil and placed on a hotplate with a magnetic stirrer. 3 g of alkaline activated rice husk was then added to the container. At contact intervals of 15, 25, 35, and 45 minutes, the mixture was heated while being constantly stirred. After the bleaching process had been concluded, the alkaline-activated rice husk was separated from the oil by filtering using Whatman filter paper, and the absorbance of the bleached oil was determined with an ultraviolet visible spectrophotometer. The absorbance of the bleached oil at varying processing temperatures was measured for each oil sample at 450 nm wavelength. The studies were conducted at 60, 70, 80, and 90 degrees Celsius. A batch process was used to complete the bleaching experiment [6].
Different doses of alkaline-activated rice husk (2.0, 4.0, 6.0, 8.0, and 10.0 g) were used in the equilibrium adsorption study. The bleaching process was completed with contact times of 15, 25, 35, and 45 minutes at an operating temperature of 80 degrees Celsius. This was done to look at how much bleached used palm olein oil's absorption increased as alkaline-activated rice husk rose [7].
The bleaching performance
The reduction in absorbance was used to assess the effectiveness of the bleaching procedure and the percentage color reduction. Before the absorbance reading, the samples were diluted in acetone to a 10% (v/v) concentration. It was determined in accordance with Equation 1.
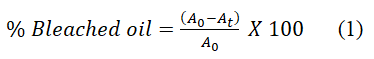
A0 is the measured absorbance of used palm olein oil (crude)
At is the measured absorbance of bleached palm olein oil at time t.
Adsorption kinetic study
The effectiveness of the adsorption procedure is revealed by the adsorption kinetic studies. It displays the rate of the reaction of the solute uptake. The actual source of adsorption is not depicted by the kinetic models, albeit. To assess the mechanism controlling the adsorption process and the impact of contact time on the effectiveness of bleaching used palm olein oil using alkaline activated rice husk, four kinetic models (pseudo-first order, pseudo-second order, the intra-particle diffusion and Elovich models) were simulated in the results. Table 1 contains a list of the models [8].
| Kinetic model | Kinetic equation | References |
|---|---|---|
| Pseudo first order |  |
Jasper, et al. |
| Pseudo-second-order | 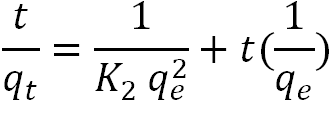 |
Almeida, et al. |
| Intra-particle diffusion | 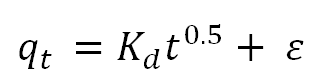 |
Jasper, et al. |
| Elovich | 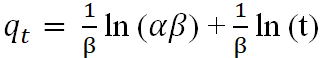 |
Nnanwube, et al. |
Table 1: Adsorption kinetic model fitted into the bleaching process using alkaline activated rice husk.
Adsorption isotherm
The adsorption isotherm is a graphical illustration of the interaction between the amount of adsorbate (molecules or ions) adsorbed onto a solid adsorbent surface and the concentration of the adsorbate in the surrounding solution at a constant temperature.
It assists in the comprehension of the adsorption technique and offers information on the surface area, adsorption capacity, and interactions between the adsorbent and adsorbate. The results of the experiment were fitted into the linearized form of Freundlich, Langmuir, Temkin, and Dubinin-Radushkevich isotherm models (Table 2).
| Isotherm model | Isotherm equation | Reference |
|---|---|---|
| Langmuir | 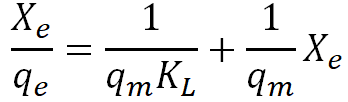 |
Dada, et al. |
| Freundlich |  |
Khairul, et al. |
| Temkin | 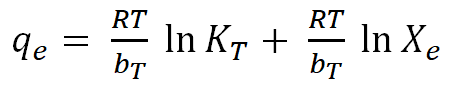 |
Khairul, et al. |
| Dubinin-Radushkevich (D-R) | 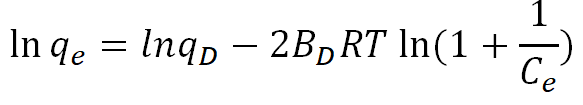 |
Igwe and Abia |
Table 2: Equilibrium isotherm models fitted into the bleaching process using alkaline activated rice husk.
Thermodynamic studies
The impact of temperature on adsorption is explained by thermodynamic parameters. They determine how strong the bonds will be between the adsorbent and adsorbate. These three parameters are Gibbs Free Energy (G), Entropy (S) and Enthalpy (H). Gibbs free energy examined the viability and spontaneity of an adsorption process. A process is considered spontaneous when the ΔG° value is negative, however a process is considered non-spontaneous when the ΔG° value is positive. Equation 2 was used to obtain the change in adsorption's standard Gibbs free energy (ΔG°).

Where,
ΔG°: Standard Gibbs free energy of adsorption in kJ/mol,
T: Temperature in Kelvin,
R: Universal gas constant as 8.314 J/mol K and
AT: Thermodynamic constant or distribution co-efficient.
The Van't Hoff equation below was used to get the relevant thermodynamic parameters of change in enthalpy (ΔH) and change in entropy (ΔS).
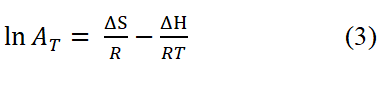
Where,
ΔH: Heat of adsorption in KJ/mol and
ΔS: Change in entropy in KJ/mol.
The graph of ln AT against 1/T reveals a linear relationship that enables the computation of ΔH (=−slope·R) and ΔS (=intercept·R) using the slope and intercept, respectively.
Results and Discussion
Scanning Electron Microscopy (SEM) analysis
SEM was employed to determine the morphological surfaces of the raw rice husk and alkaline-activated rice husk (at 3000X magnifications) for both before and after the adsorption process. The surface features of the alkaline-activated rice husk were slightly altered following the chemical treatment (KOH) as against the raw rice husk, shown in Figure 1 below. According to Kaur, et al. pretreatment using base and acid improved the morphology of rice husks by removing lignin and hemicellulose, reducing cellulose crystallinity, as well as removing the inorganic substances from the surface [9].

Figure 1: Scanning electron micrographs of (a) Raw rice husk, (b) 5 M KOH activated rice husk at 13,000x magnification.
The raw rice husk and adsorbent images below show that the particles that constitute them did not exhibit uniform sizes and shapes. The structures in the micrographs of the raw rice husk are sparse, rather big, and have some tiny agglomerates on their surface. The structures are also located in a porous matrix region with a lot of interstitial pore spaces. Alkaline-activated rice husk revealed gaps on the surface, but impurities were still noticeable. Daffalla et al., asserts that because the interaction between the base and rice husk does not take place adequately, the activation process in alkaline-activated rice husk has little effect on the surface. However, adsorbent's micrograph reveals a smaller, greater number of structures that are smoother, flatter but irregular distributed throughout their matrix, producing a surface area that is significantly greater and an increase in micropore volume. This is corroborated by the BET analysis, which shows that the alkaline-activated rice husk has increased in surface area (from 60.500 to 65.220 m2/g) and micropore volume (0.13440 to 0.155240 cm3/g). The morphological differences between the particles that make up the raw rice husk and the adsorbent materials can explain changes in adsorption performance in bleaching of used palm olein oil. For example, the adsorbent that received treatment has a greater surface area of contact [10].
Surface area analysis of the adsorbent using BET
A reliable indicator of the degree of porosity and surface adsorption sites is the assessment of BET specific surface area. The BET characterization of raw rice husk and alkaline-activated rice husk was done to determine their surface area. From the results in Table 3 below, noticed that the BET total surface area of the alkaline activated rice husk (65.220 m2/g) was 7.24% higher above that of the raw rice husk (60.500 m2/g). Reported similar findings. The AARH show an increase in BET total surface area as against the raw rice husk, suggesting that AARH could possess the strongest physical adsorption capacity. Again, the increase in BET total surface area and micropores volume of the AARH due to pore widening, may be as a result of ash content removal from the surface of the AARH or lower temperature [11].
| Biomass | BET total surface area (m2/g) | Total pore volume (cm3/g) |
|---|---|---|
| RRH | 60.5 | 0.6035 |
| AARH | 65.22 | 0.5835 |
RRH: Raw Rice Husk, AARH: Alkaline-Activated Rice Husk
Table 3: BET total surface area and total pore volume of RRH and AARH.
Again, findings in Table 3 below show a decrease in pore volume of the adsorbent that might also result from the activation process. This is because the chemical agents or physical treatments have the ability to remove some of the carbon content or collapse specific pores, resulting in overall pore volume reduction. The increase in surface area, however, outweighs the loss in pore volume, making activated adsorbent more appropriate for a variety of uses, including adsorption, catalysis, and soil improvement. Similarly, adsorption average pore width of the AARH increased from 30.3400 to 260400. This might be as a result of slower heating rates and longer activation times [12].
Fourier Transform Infrared (FT-IR) spectroscopy analysis of bleached and unbleached palm olein oils
FT-IR spectroscopy is among the most often employed spectroscopic methods for identifying compounds. High sensitivity and low cost are two qualities that make this method favorable for doing such analysis. The FT-IR were obtained for the used palm olein (crude) and bleached palm olein oil (with AARH) in a wavenumber range of 350-4400 cm-1. From Figure 2 below, the used presented residue in a wave number 3781.82 cm-1, this can be attributed to the carbon origin, which signifies the presence of high energy storage in the compound [13].

Figure 2: FT-IR spectra of the unbleached used palm olein oil.
The FT-IR analysis depictions (Figures 2 and 3) have slight changes between their spectra, although the bleached palm olein oil is chemically similar to that of used palm olein oil (crude). The characteristic adsorption band for used palm olein and bleached palm olein oil (with AARH) at 3457.73 cm-1 and 3457.00 cm-1 respectively, signifies the presence of O-H in the form of free carboxylic acids, confirming the presence of fatty acids in both oils. For peak 2934.47 cm-1, Figure 2 below is attributed to the asymmetric stretching (C-H) of fatty acid hydrocarbon present in the oil, showing the existence of alkane functional group (-CH3, -CH2). Also, figure 3 shows absorption band of 2361.53 cm-1, suggesting that the used palm olein oil (crude) contained a sharp signal and weak intensity alkynes compound with a functional group of -C≡C- symmetric stretching. From Figures 2 and Figure 3, broad signals and strong intensities absorptions at 11633.77 cm-1 and 1632.42 cm-1 suggested alkene compounds with functional group of -C=C- stretching, typical for esters carbonyl compounds. Similar ester carbonyl compound, -C=O stretching at a wavelength of 1712.70 cm-1 was presented in Figure 2 with sharp signal and strong intensity. This peak, which is a typical triglyceride oil absorption band, is frequently used to gauge how unsaturated the oil's fatty acids are. It suggests that there are triglycerides in the oil. The characteristics of the oil, such as its melting point and oxidative stability is impacted by the existence of unsaturated fatty acids. The peaks at 1437.50 cm-1 and 1445.78 cm-1 in Figures 2 and 3 respectively, indicates the presence of hydrocarbon compounds (C-H) with a functional group of (CH2, CH3) asymmetric stretching. Absorption band of 1387.00 cm-1 (Figure 3), suggest existence of trimethyl or “tert butyl” (tertiary alcohol) [14].

Figure 3: FT-IR spectra of the bleached palm olein oil with alkaline-activated rice husk.
The FTIR spectra (Figure 2) shows the peaks at the finger print region for the used palm olein used (1276.00 cm-1, 1114.33 cm-1, and 1062.00 cm-1), suggesting an ester group with an assigned functional compound (C-O, C-N) stretching. Also, noticeable is the presence of wavenumber at (663.57 cm-1 and 605.00 cm-1) with an assigned alkane compound (C-H) bending out of plane. Similarly, for the bleached oil (with AARH) Figure 3, the observed peaks at 1275.00 cm-1, 600.00 cm-1 and 370.17 cm-1, suggest the existence of skeletal -C-C- vibration, aromatic -C-H (out of plane bend), and Fe-O (out of plane bend) respectively (Tables 4 and 5).
| Peak no | Wavelength (cm-1) | Functional group | Mode of vibration |
|---|---|---|---|
| 1 | 3781.82 | Residue | - |
| 2 | 3457.73 | O-H (acidic) | Asym. stretching |
| 3 | 2927.45 | -C-H (CH3) | Asym. stretching |
| 4 | 2361.53 | -C≡C- | Sym. stretching |
| 5 | 1633.77 | -C=C (cis) | Stretching |
| 6 | 1437.5 | -C-H (CH2, CH3) | Bending |
| 7 | 1276 | -C-O (ester group) | Stretching bending |
| 8 | 1114.33 | -C-O (ester group) | Stretching |
| 9 | 1062 | -C-O, C-N (ester group) | Stretching |
| 10 | 663.57 | -C-H | Out of plane bend |
| 11 | 605 | -C-H | Out of plane bend |
Table 4: Functional groups observed by FT-IR spectra of used palm olein oil.
| Peak no | Wavelength (cm-1) | Functional group | Mode of vibration |
|---|---|---|---|
| 1 | 3457 | O-H (alcohol) | Asym. Stretching |
| 2 | 1712.7 | -C=O (ester) | Stretching |
| 3 | 1632.42 | -C=C (cis) | Stretching |
| 4 | 1445.78 | -C-H | Bending |
| 5 | 1387 | Trimethyl or tert-butyl | Sym. bending |
| 6 | 1275 | -C-C- (skeletal) | Vibration |
| 7 | 600 | -C-H (aromatic) | Out of plane bend |
| 8 | 370.19 | Fe-O | Out of plane bend |
Table 5: Functional groups observed by FT-IR spectra of bleached palm olein oil (with AARH).
Impact of operating factors on bleaching efficiency
The effect of operating temperature, adsorbent dosage, contact time and on the percentage of bleached Used Palm Olein Oil (UPOO) are given below.
Impact of adsorbent dosage on the bleaching process: Adsorption experiments were conducted at various adsorbent dosages between 2 and 10 g while maintaining optimum conditions of 80-degree Celsius temperature, 0.25 millimeter particle size, and 25 minutes’ time. The absorbance of Used Palm Olein Oil (UPOO) is 0.899. Figure 4 below shows that when the adsorbent dosage increased, the bleaching efficiency also increased. The bleaching process is immediately impacted by the amount of adsorbent (AARH) used, with more adsorbent producing more active adsorption sites and, consequently, higher bleaching power. However, it is vital to keep in mind that increasing the amount of adsorbent causes an immediate rise in efficiency (Table 6). For the UPOO bleaching process to be as effective as possible, more adsorbents must be employed [15].
| Adsorbent dosage (g) | Absorbance (A450) | Bleaching efficiency (%) |
|---|---|---|
| 2 | 0.665 | 26.03 |
| 4 | 0.533 | 40.71 |
| 6 | 0.498 | 44.61 |
| 8 | 0.455 | 49.39 |
| 10 | 0.421 | 53.17 |
Table 6: Absorbance and bleaching efficiency at varying adsorbent dosage.

Figure 4: Plot of bleaching efficiency against adsorbent dosage (AARH).
Impact of temperature on the bleaching process: Adsorption experiment was accomplished at various temperatures between 60 to 90°C while maintaining the optimum 3.0 g adsorbent dosage, 0.25 mm particle size, and 25 min contact time. The used palm olein oil's absorbance was determined to be 0.899. According to Figure 5 below, the bleaching efficiency rises initially as the temperature rises up to a certain point, and further increase in temperature resulted in decreasing bleaching efficiency. It can be concluded that the bleaching temperature has a direct impact on the bleaching process (Table 7). The higher energy and adsorption sites provided by the temperature increase caused the increase in bleaching power to occur, and the destruction of these adsorption sites by the higher temperatures may have caused the decrease in bleaching power. The bleaching temperature is a crucial component of bleaching used palm olein oil because, up until a certain point, its rise increases the process's efficiency.
| Temperature (°C) | Absorbance (A450) | Bleaching efficiency (%) |
|---|---|---|
| 60 | 0.651 | 27.69 |
| 70 | 0.617 | 31.37 |
| 80 | 0.535 | 40.48 |
| 90 | 0.553 | 38.49 |
Table 7: Absorbance and bleaching efficiency at varying temperatures.

Figure 5: Plot of bleaching efficiency against temperature (using AARH).
Impact of contact time on the bleaching process: Adsorption was carried out at various contact times between 15 and 45 minutes while maintaining the optimum 80-degree Celsius temperature, 0.25 millimeter particle size, and 3.0 gram adsorbent dosage. The used palm olein oil's absorbance value was 0.899. Figure 6 below demonstrate how the percentage of bleaching rose as the contact time increased. It may be concluded that the duration of the contact time directly affects the bleaching process, and that the increase in bleaching power results from a greater adsorption of the adsorbates to the active adsorption sites as a result of the longer contact time.

Figure 6: Plot of bleaching efficiency against contact time (using AARH).
Noticed (Table 8), increasing the contact time initially results in a rapid increase in bleaching efficiency, and successive increases in contact time leads to successive increase in bleaching efficiency. The bleaching of used palm olein oil depends heavily on contact time since a longer contact time makes the process more effective [16].
| Contact time (min) | Absorbance (A450) | Bleaching efficiency (%) |
|---|---|---|
| 15 | 0.687 | 23.58 |
| 25 | 0.535 | 40.49 |
| 35 | 0.513 | 42.94 |
| 45 | 0.465 | 48.28 |
Table 8: Absorbance and bleaching efficiency at varying contact time.
Adsorption kinetic study
The linearized model equations for the pseudo-first-order, pseudo-second-order, intra-particle diffusion, and Elovich kinetic models are provided in Table 9 above. These models were used to analyze the experimental data [17].
| Kinetic model | Constant/Parameters | ||
|---|---|---|---|
| Pseudo-first-order | K1 (min-1) | qe (mg/g) | R2 |
| 0.00027 | 0.5635 | 0.1489 | |
| Pseudo-second-order |
K2 (g/mg min) | qe (mg/g) | R2 |
| 0.9165 | 0.4633 | 0.9848 | |
| Intra particle diffusion |
Kd (g/mg min) | ε (mg.l-1) | R2 |
| 0.0665 | 0.9058 | 0.9757 | |
| Elovich |
α × 10-5 (mg/g min) | β (mg/g) | R2 |
| 2.4993 | 8.9686 | 0.9453 | |
Table 9: Kinetic parameters for the adsorption bleaching process.
As seen in the Figure 7 below, a plot of ln (A0-At) vs. t was used to represent the pseudo-first order at the temperature of 80 degree Celsius; The slope and intercept were used to calculate A0 and K1, respectively. The parameters of the pseudo first order kinetics for the adsorbates adsorption from used palm olein oil is shown in Table 9. The experimental data for the adsorbent (AARH) do not fit into the pseudo-first-order model as the regression coefficient R2 value is approximately 0.1489. Showing that the kinetic process was not first order, that is, the model is unable to describe the rate process, The observed adsorption capacity or theoretical (qe) for the activated rice husk was 0.899 while the calculated adsorption capacity (experimental) was 0.5635 which means that the theoretical adsorption capacity was 37.32% higher than the calculated [18].

Figure 7: Pseudo first order kinetic model plot for the bleaching process with AARH.
The pseudo-second-order rate constants K2 and At for the adsorbent at 80 degrees Celsius were calculated from the curve of t/At vs. t in Figure 8 below. The parameters for the pseudosecond- order kinetics of the adsorbate-adsorption from used palm olein oil (using AARH) are shown in Table 9. The experimental data for the adsorbent fit into the pseudo-secondorder model as the regression coefficient, R2, value is approximately 0.9848. Meaning that, the kinetic model was able to describe the rate process. With this high regression coefficient which is an indication that chemisorption is the rate controlling step of the kinetic adsorption process. The observed adsorption capacity or theoretical (qe) was 0.899 while the calculated adsorption capacity (experimental) was 0.4633 which means that the observed adsorption capacity was 48.5% higher than the calculated.

Figure 8: Pseudo second order kinetic model plot for the bleaching process with AARH.
The intra-particle diffusion rate constants, Kd, and the equilibrium concentration corresponding to the thickness of the boundary layer, ε, for the adsorbents at the optimal temperature were determined using the slope and intercept of the At versus t0.5 plot. If the linear plot of At vs. t0.5 went through its point of origin, intra-particle diffusion would be the only rate controlling process. However, the lines for the intra-particle diffusion model graph (Figure 9) did not pass through its point of origin, showing that there were other rate-controlling steps in addition to diffusion. Nevertheless, the computed coefficient of determination, R2 values is 0.9757, which was quite high but less than the R2 for the pseudo-second-order kinetic model. As a result, it does not adequately describe the experimental findings [19].

Figure 9: Intra-particle diffusion kinetic model plot for the bleaching process with AARH.
The experimental data was also modeled with Elovich kinetics equation (Table 1) above. The graph for the adsorption capacity (qt) against the logarithm of time (t) gave a straight line for the adsorption with alkaline activated rice husk (Figure 10). The intercept and slope were used to determine the Elovich parameters (α and β) respectively (Table 9). Since the R2 value of the Elovich model equation is 0.9453, which is lower than that of the pseudo-second-order kinetic model, it cannot adequately explain the experimental results [20].

Figure 10: Elovich kinetic model plot for the bleaching process with AARH.
Equilibrium and isotherm study
Values presented in Table 10.
| Isotherm model | Parameter/constant | Temperature (â??) | ||||
|---|---|---|---|---|---|---|
| 60 | 70 | 80 | 90 | |||
| Freundlich | KF | 0.0745 | 0.2505 | 0.8314 | 0.2550 | |
| n | 0.6428 | 2.1074 | 2.9373 | 2.2427 | ||
| 1/n | 1.5557 | 0.4745 | 0.3404 | 0.4459 | ||
| R2 | 0.5319 | 0.9908 | 0.1794 | 0.9857 | ||
| Langmuir | KL | 1.0820 | 1.0683 | 1.0610 | 1.0294 | |
| qm | 0.1500 | 0.0652 | 0.0760 | 0.0565 | ||
| RL | 0.5069 | 0.5101 | 0.5118 | 0.5194 | ||
| Langmuir | R2 | 0.3120 | 0.9119 | 0.7849 | 0.8922 | |
| Temkin | bT × 103 | 15.9087 | 3.5054 | 3.4776 | 3.5712 | |
| AT | 1.000 | 1.000 | 1.000 | 1.000 | ||
| R2 | 0.5395 | 0.9967 | 0.9650 | 0.9990 | ||
| Dubinin-Radushlkevich | BD × 10-4 | 1.8754 | 5.7519 | 7.9207 | 5.8326 | |
| qD | 0.438 | 2.15 | 18.20 | 2.900 | ||
| ED | 51.60 | 29.50 | 25.12 | 29.30 | ||
| R2 | 0.5404 | 0.9940 | 0.1913 | 0.9901 | ||
Table 10: Adsorption isotherm parameters for the bleaching process.
Adsorption isotherms are mathematical formulas that explain the correlation between the quantity of adsorbate adsorbed on an adsorbent and the concentration of adsorbate in solution as it attains equilibrium at a constant temperature. To carry out the adsorption isotherm inquiry on alkaline-activated rice, the equilibrium data were fitted to the Langmuir, Freundlich, Temkin, and Dubinin-Radushkevich isotherms. The isotherm equation's applicability and compatibility with the equilibrium data were assessed using the Correlation coefficients (R2). Linear regression was performed using an Excel spreadsheet. Table 10 contains the derived isotherm constants for the four models.
From Table 10 above at temperature 60â??, Freundlich plot give n value of 0.6428 and 1/n value of 1.5557, indicating chemisorption and favourable or cooperative adsorption process, at temperature 70 to 90°C, n values is between 2.1074 to 2.9373 and 1/n values between 0.3404 to 0.4745, indicating physisorption with a normal adsorption process. R2 values of 0.5319, 0.9908, and 0.9857 corresponding to 60°C, 70°C, and 90°C respectively, shows that the adsorption data fits the Freundlich isotherm model. However, R2 (0.1794) at temperature 80°C shows that the adsorption data does not fit the Freundlich isotherm model. The Kf value can be used to calculate the adsorption coefficient, which represents the number of adsorbate molecules adsorbed. The Kf value increased from 60 to 80°C, according to the study's results (Table 10), which can be attributed to an increase in the rate at which contaminants and undesirable components diffuse into the pores of the adsorbent at higher temperatures. Conversely, Kf values decrease as temperatures increase above 80°C posing the possibility that a high temperature (90°C) could be harmful to the adsorption sites [21].
According to the information obtained in Table 10 above, the RL values for used palm olein oil bleached with alkalineactivated rice husk is greater than zero but less than one, indicating that Langmuir isotherm is favourable. The values of qm obtained in this work (Table 10) is comparable to the value reported by, where low values of qm (<2) were also obtained after the calculation. Additionally, as the temperature of the adsorption process rose, the values of the Langmuir constant (KL) decreased. This could be because the high temperature caused some of the pore space on the surface of the adsorbent to be destroyed. The Langmuir plot was rather accurate in depicting the adsorption processes at temperatures of 70°C, 80°C, and 90°C, as shown by the plots and correlation coefficient (R2) values for the employed palm olein oil bleached with alkaline activated rice husk.
From the results obtained (Table 10), the values of ED are >8 for the bleached oil with AARH, reveals the adsorption process follows chemical adsorption process. The coefficient of regression (R2) for the bleached oil using AARH across the temperatures (60°C, 70°C, 80°C and 90°C) gave 0.5404, 0.9904, 0.1913 and 0.9901 respectively, with 0.6728 average value. We can therefore conclude from the average value of R2 that the experimental data for bleached oil with AARH did not follow the Dubinin-Radushkevich isotherm, even though one can argue that the respective equations are appropriate in and of themselves for describing the potential of alkaline activated rice husk for the bleaching of used palm olein oil (Figures 11-14).

Figure 11: Freundlich isotherm plot for the bleaching process of used palm olein oil with AARH at varying temperatures.

Figure 12: Langmuir isotherm plot for the bleaching process of used palm olein oil with AARH at varying temperatures.

Figure 13: Dubinin-Radushkevich isotherm plot for the bleaching process of used palm oil with AARH at different temperatures.

Figure 14: Temkin isotherm plot for the bleaching process of used palm oil with AARH at different temperatures.
For the Temkin isotherm, the values of x/m were plotted against Log Xe in the figure below and the Temkin constants AT and bT were determined from the slope and intercept of the graph. The Temkin model made it possible to calculate the heat of adsorption through the application of constant bT and bleaching of used palm olein oil using AARH. The findings (Table 10) for this constant were positive, indicating that an exothermic reaction took place. Also, the fact that the value of the constant bT is smaller than 16 KJ/mol suggests that physical adsorption is the mechanism taking place. The type of bond created during adsorption affects how much energy is released. Low adsorption energies are associated with the physisorption process because it involves weak Van Der Waals interactions to attach the adsorbates to the adsorbent. In comparison to the other models that were used, the R2 values for AARH (0.5395, 0.9967, 0.9650, and 0.9990) show that the relevant equations provide the best fit with the experimental data [21].
Adsorption thermodynamic study
The experimental thermodynamic findings is seen in Table 11.
| Adsorbent | ΔH (KJ/mol) | ΔS (KJ/mol) | ΔG (kJ/mol) | |||
|---|---|---|---|---|---|---|
| 333 | 343 | 353 | 363 | |||
| AARH | -6.3885 | -0.0228 | 1.1877 | 1.3770 | 1.8302 | 1.7878 |
Table 11: Thermodynamic parameters for the bleaching process.
The experiment's findings (Table 11) demonstrate that the computed Gibbs free energy change, ΔG0, was positive across all temperatures examined and found to increase as the temperature increased (333 to 353 K) but decrease as the temperature approached 363 K, indicating an interaction between the adsorbent and adsorbate, with unbalanced competition attributed to the heterogeneity of the adsorbent surface and the system's ability to obtain energy from external sources at an increased temperature. Furthermore, the adsorption process was non-spontaneous, as shown by the positive free Gibbs energy values. Indicating that more energy was needed for the alkaline activated rice husk adsorbent to bleach using palm olein oil.
The negative value of enthalpy (ΔH°) demonstrates that the bleaching process of used palm olein oil was an exothermic process. Likewise, the negative value of entropy (ΔS°) during the bleaching process with alkaline activated rice husk indicated decrease in the degree of randomness at the adsorbent– adsorbate interface (Figure 15).

Figure 15: Thermodynamic plot for the bleaching process of used palm olein oil with AARH.
Conclusion
Rice husk was used as economical, inexpensive and low price adsorbent in the bleaching of used palm olein oil. The SEM and BET analyses of the alkaline activated rice husk show morphological differences between the raw rice husk and the alkaline activated rice husk, and the BET study revealed an increase in the total surface area (65.220 m2/g) of the AARH. The existence of characteristic functional groups in the bleached oil was confirmed by FT-IR analysis. The bleaching process's efficiency increased when the temperature was raised. Maintaining optimum conditions of 80°C temperature, 25 min time, 0.25 mm particle size, and 3.0 g adsorbent dosage, resulting in 40.48% bleaching efficiency. The coefficient of determination R2 is 0.9848, suggesting that the experimental data for the adsorption process fit into the pseudo-second-order kinetic model and chemisorption serving as the rate-controlling step. The Temkin isotherm model was found to be the best fit for the adsorption data, which revealed the highest values of R2 (0.5395, 0.9967, 0.9650, and 0.9990) at temperatures of 60°C, 70°C, 80°C, and 90°C, respectively. The thermodynamic analysis of the adsorption process produced positive values for the Gibbs free energy, ΔG0, demonstrating that the adsorption process was not spontaneous. The obtained negative value of enthalpy change, ΔH° (-6.3885), further demonstrated that the bleaching process is exothermic. Similar to this, the reduced level of randomness at the adsorbent-adsorbate interface is indicated by the obtained negative value of entropy change, ΔS° (-0.0228).
This investigation has shown that alkaline-activated rice husk can be produced and used as a substitute for imported adsorbents for bleaching used palm olein oil at moderately higher temperatures.
References
- Akhtar M, Bhanger MI, Iqbal S, Hasany SM. Sorption potential of rice husk for the removal of 2, 4-dichlorophenol from aqueous solutions: Kinetic and thermodynamic investigations. J Hazard Mater. 2006;128(1):44-52.
[Crossref] [Google Scholar] [PubMed]
- Al-Baidhani JH, Al-Salihy ST. Removal of heavy metals from aqueous solution by using low cost rice husk in batch and continuous fluidized experiments. IJCEA. 2016;7(1):6.
- Alexander D, Ellerby R, Hernandez A, Wu F, Amarasiriwardena D. Investigation of simultaneous adsorption properties of Cd, Cu, Pb and Zn by pristine rice husks using ICP-AES and LA-ICP-MS analysis. Microchem J. 2017;135:129-139.
- Almanassra IW, Khan MI, Atieh MA, Shanableh A. Adsorption of lead ions from an aqueous solution onto NaOH-modified rice husk. Desalin. Water Treat. 2022;254:104-115.
- Almeida ES, Carvalho AC, de Souza Soares IO, Valadares LF, Mendonca AR, Silva IJ, et al. Elucidating how two different types of bleaching earths widely used in vegetable oils industry remove carotenes from palm oil: Equilibrium, kinetics and thermodynamic parameters. Food Res Int. 2019;121:785-797.
[Crossref] [Google Scholar] [PubMed]
- Amar I, Sharif A, Ali M, Alshareef S, Altohami F, Abdulqadir M, et al. Removal of methylene blue from aqueous solutions using nano-magnetic adsorbent based on zinc-doped cobalt ferrite. Chem Methodol. 2020;4(1):1-8.
- Abin-Bazaine A, Trujillo AC, Olmos-Marquez M. Adsorption isotherms: enlightenment of the phenomenon of adsorption. Wastewater Treatment. 2022:1-5.
- Angelova D, Uzunov I, Uzunova S, Gigova A, Minchev L. Kinetics of oil and oil products adsorption by carbonized rice husks. J Chem Eng. 2011;172(1):306-311.
- Asadi F, Shariatmadari H, Mirghaffari N. Modification of rice hull and sawdust sorptive characteristics for remove heavy metals from synthetic solutions and wastewater. J Hazard Mater. 2008;154(1-3):451-458.
[Crossref] [Google Scholar] [PubMed]
- Bai W, Qian M, Li Q, Atkinson S, Tang B, Zhu Y, et al. Rice husk-based adsorbents for removing ammonia: Kinetics, thermodynamics and adsorption mechanism. J Environ Chem Eng. 2021;9(4):105793.
- Cardenas J, Orjuela A, Sanchez DL, Narvaez PC, Katryniok B, Clark J. Pre-treatment of used cooking oils for the production of green chemicals: A review. J Clean Prod. 2021; 289:125129.
- Chen Y, Zhai SR, Liu N, Song Y, An QD, Song XW. Dye removal of activated carbons prepared from NaOH-pretreated rice husks by low-temperature solution-processed carbonization and H3PO4 activation. Bioresour Technol. 2013;144:401-409.
[Crossref] [Google Scholar] [PubMed]
- Chen J, Zhang L, Li Y, Zhang N, Gao Y, Yu X. The formation, determination and health implications of polar compounds in edible oils: Current status, challenges and perspectives. Food Chem. 2021;364:130451.
[CrossRef] [Google Scholar] [PubMed]
- Silva HR, Quintella CM, Meira M. Separation and identification of functional groups of molecules responsible for fluorescence of biodiesel using FTIR spectroscopy and principal component analysis. J Braz Chem Soc. 2017;28(12):2348-2356.
- Dada AO, Olalekan AP, Olatunya AM, Dada OJ. Langmuir, Freundlich, Temkin and Dubinin–Radushkevich isotherms studies of equilibrium sorption of Zn2+ unto phosphoric acid modified rice husk. IOSR-JAC. 2012;3(1):38-45.
- Daffalla SB, Mukhtar H, Shaharun MS. Preparation and characterization of rice husk adsorbents for phenol removal from aqueous systems. PloS One. 2020;15(12):e0243540.
- Omokpariola DO, Otuosorochi JN. Batch adsorption studies on rice husk with methyl violet dye. WNOFNS. 2020;33.
- Dewage NB, Fowler RE, Pittman CU, Mohan D, Mlsna T. Lead (Pb2+) sorptive removal using chitosan-modified biochar: batch and fixed-bed studies. RSC Adv. 2018; 8(45):25368-25377.
[Crossref] [Google Scholar] [PubMed]
- Maharani DR, Ruhiyat R, Iswanto B, Juliani A. The Use Of Spent Bleaching Earth (SBE) as an Adsorbent to Reduce Free Fatty Acids in Waste Cooking Oil. Indones J Urban Environ Technol. 2022:193-208.
- Dibia KT, Igbokwe PK, Egwunyenga MC, Ochuko G. Extraction of tocopherol from palm fatty acid distillate: batch equilibrium adsorption study. UJEAS. 2023;22(1):967-981.
- Phuong DT, Thao NT, Loc NX. Preparing Shrimp Shell-Derived Chitosan with Rice Husk-Derived Biochar for Efficient Safranin O Removal from Aqueous Solution. J Ecol Eng. 2023;24(1).
Citation: Mohammed JG, Uthman H, Aboje AA, Afolabi A, Azeez OS (2025) Kinetic and Thermodynamic Studies of Used Palm Olein Oil Using Alkaline-Activated Rice Husk as An Adsorbent. Adv Chem Eng. 15:354.
Copyright: © 2025 Mohammed JG, et al. This is an open-access article distributed under the terms of the Creative Commons Attribution License, which permits unrestricted use, distribution, and reproduction in any medium, provided the original author and source are credited.