Indexed In
- Open J Gate
- Genamics JournalSeek
- China National Knowledge Infrastructure (CNKI)
- Ulrich's Periodicals Directory
- RefSeek
- Hamdard University
- EBSCO A-Z
- OCLC- WorldCat
- Publons
- Google Scholar
Useful Links
Share This Page
Journal Flyer

Open Access Journals
- Agri and Aquaculture
- Biochemistry
- Bioinformatics & Systems Biology
- Business & Management
- Chemistry
- Clinical Sciences
- Engineering
- Food & Nutrition
- General Science
- Genetics & Molecular Biology
- Immunology & Microbiology
- Medical Sciences
- Neuroscience & Psychology
- Nursing & Health Care
- Pharmaceutical Sciences
Research Article - (2023) Volume 13, Issue 6
Identification of Key Proteins as Potential Biomarkers Associated with Post- Infarction Complications in Diabetics
Wei Wu1, Li Yan2, Xiao-Fei Yuan2, Lu Wang2, Yu Zhang3, Lu Yin2, Jiang-Qi Pan2, Long-Xiang Tu2 and Zhi-Ru Ge2*2Department of Cardiology, The Second Military Medical University, Shanghai, 200135, China
3Department of Critical Care Medicine, Shanghai University of Medicine and Health Sciences, Shanghai, 201318, China
Received: 01-Jun-2023, Manuscript No. CPECR-23-21606; Editor assigned: 05-Jun-2023, Pre QC No. CPECR-23-21606 (PQ); Reviewed: 19-Jun-2023, QC No. CPECR-23-21606; Revised: 01-Aug-2023, Manuscript No. CPECR-23-21606 (R); Published: 08-Aug-2023
Abstract
Background: The ability of transcriptome analysis to identify dysregulated pathways and outcome related genes following myocardial infarction in diabetic patients remains unknown. The present study was designed to detect possible biomarkers associated with the incidence of post-infarction complications in diabetes to assist the development of novel treatments for this condition.
Methods: Two gene expression datasets, GSE12639 and GSE6880, were downloaded from the Gene Expression Omnibus (GEO) database, and then Differentially Expressed Genes (DEGs) were identified between post-infarction diabetics and healthy samples. These DEGs were then arranged into a Protein-Protein Interaction (PPI) network, and Kyoto Encyclopedia of Genes and Genomes (KEGG) pathway and Gene Ontology (GO) enrichment analyses were performed to explore the functional roles of these genes.
Results: In total, 30 DEGs (14 upregulated and 16 downregulated) were shared between these two datasets, as identified through Venn diagram analyses. GO analyses revealed these DEGs to be significantly enriched in ovarian steroidogenesis, fatty acid elongation, biosynthesis of unsaturated fatty acids, synthesis and degradation of ketone bodies, and butanoate metabolism. The PPI network of the DEGs had 14 genes and 70 edges. We identified two key proteins, HMGCS2 and ECI1, and the upregulated gene Hmgcs2 with the highest score in the MCC method. We generated a co-expression network for the hub genes and obtained the top ten medications suggested for infarction with diabetes.
Conclusion: Taken together, the findings of these bioinformatics analyses identified key hub genes associated with the development of myocardial infarction in diabetics. These hub genes and potential drugs may become novel biomarkers for prognosis and precision treatment in the future.
Keywords
Myocardial infarction; Heart failure; Diabetics; Cardiomyopathy; Biomarkers
Introduction
Coronary Artery Disease (CAD) and Diabetes Mellitus (DM) are two intimately interacting clinical diseases, and the complications that often follow are among the leading causes of death and disability worldwide [1-3]. Myocardial Infarction (MI) patients with diabetes have a higher risk of Heart Failure (HF) and Left Ventricular (LV) dysfunction and a worse prognosis than those without DM [4,5]. In patients with diabetes, HF is usually subclinical and mainly manifests as energy substrate metabolic disorder, including inhibited carbohydrate metabolism, increased oxidation of myocardial derived fatty acids and accumulation of lipids, and diastolic dysfunction [6,7]. Nevertheless, when myocardial ischemia occurs in patients with diabetes, cardiac function may be more vulnerable to failure. Current medical progress has improved the survival rate of cardiovascular disease in patients without diabetes but has not benefited the diabetes subgroup, as at present there are no specific treatment methods for heart failure in diabetes patients [8].
With the development of second generation sequencing and other technologies, great improvement has been made in exploring the diagnosis and treatment of cardiovascular diseases and diabetes mellitus. Developments in bioinformatics analyses allow core data to provide new clues for evaluating functional and credible Differentially Expressed Genes (DEGs) and noncoding transcripts [9]. Moreover, the machine learning algorithms and network analyses used to reanalyze these data may reveal new insights. These methods save resources from various medical sources and provide evidence for precision medicine strategies and molecular pathogenesis networks of diseases.
In this study, we downloaded gene expression profile data of MI combined with diabetes (GSE12639 ) and DM (GSE6880) from the Gene Expression Omnibus (GEO) database, using bioinformatics to search for the DEGs related to MI in combination with diabetes and to visualize the correlation between genes. The Kyoto Encyclopedia of Genes and Genomes (KEGG) and Gene Ontology (GO) databases were used to analyze the pathway and biological function enrichment of the DEGs. A Protein-Protein Interaction (PPI) network of the DEGs was also established to screen for hub genes, functional modules, and extracellular molecules interacting with the hub genes. With the aid of bioinformatics and revalidation, our research provides new insights into the pathogenesis of HF after MI in patients with diabetes and the differentiation of new altered transcripts, which may be potential early biomarkers for adverse clinical outcomes. We also hope to determine potential therapeutic drugs to provide clues for further research and follow-up treatment of diabetes complicated with myocardial infarction, to prevent serious heart failure.
Materials and Methods
Expression profile dataset selection
To identify the transcriptome involved in the development and progression of diabetes complicated with acute MI, we mined several relevant data sets and downloaded microarray gene expression data of interest from the GEO. DataSets portal, which is publicly available at NCBI. In this database, we searched for the progress of myocardial genetic regulation and expression after diabetes complicated by myocardial infarction and comparative studies of DM and normal tissue samples, and then downloaded the result files for analysis.
Data processing and identification of differentially expressed genes
Genes that were differentially expressed in the myocardial infarction with diabetes samples were identified using the default settings of the GEO2R tool, and P<0.05 and |logFC| >1.0 was set as the cutoff criteria for DEGs. Expression heatmaps were displayed by the pheatmap R package. Volcano plots were drawn using fold changes and modified p-values. The draw Venn diagram tool was used to display the overlap of DEGs between the two discovery datasets, and the DEGs that overlapped were included in subsequent analyses.
Functional and pathway enrichment analysis
We used the enrichGO and enrichKEGG functions of the ClusterProfiler package and visualized the results using the “ggplot2” package to assess the GO and KEGG enrichments of the identified DEGs. For GO analyses, the enriched Cellular Components (CCs), Molecular Functions (MFs), and Biological Processes (BPs) were assessed.
Protein-Protein Interaction (PPI) network construction and hub gene analysis
To understand the interactions between the DEGs, PPI networks were constructed by importing the up and downregulated DEGs into STRING, the Search Tool for the Retrieval of Interacting genes [10]. Cytoscape visualization was used with an interaction score>0.4, hiding the unconnected genes. We chose text mining evidence to screen for interactions supported by published literature. With a degree cutoff=2, node score cutoff=0.2, kcore=2, and max depth=100, Molecular Complex Detection (MCODE) was applied in Cytoscape to find functional clusters of genes in the PPI network [11]. Modules with established scores >5 were screened out. We used the cytohubba plug-in in Cytoscape to find the top 15 node genes in ten ways, and took the intersections to screen the hub genes. The MCC method is the most accurate in cytohubba [12].
Screening for potential pharmacological targets
The screening results of potential pharmacological targets were downloaded from cMAP and ranked and filtered based on connectivity scores for drugs. The top ten medications suggested for infarction in diabetics were alectinib, ITE, QL-X-138, lypressin, GSK-461364, P-22077, PF-477736, BRDK20168484, diclofenac, and altretamine. These drugs have the potential to be therapeutic agents for infarction with diabetes.
Results
Identification of differentially expressed genes
The GSE12639 and GSE6880 gene expression datasets were downloaded from the GEO database. The GSE12639 dataset includes six remote zone tissues of LV free wall ischemia without reperfusion after diabetes mellitus induction with Streptozotocin (STZ) and six remote zone tissues of LV free wall ischemia without reperfusion from non-diabetic rats, while the GSE6880 dataset includes heart tissues from three diabetic rats and three control individuals. In total, 141 DEGs were identified in the GSE12639 dataset (65 upregulated, 76 downregulated), while 446 were identified in the GSE6880 dataset (250 upregulated, 196 downregulated). The top 40 DEGs with the highest p-values are presented in Figure 1. In total, 14 upregulated DEGs and 16 downregulated DEGs were shared between these two datasets, as identified through Venn diagram analyses (Figure 2).
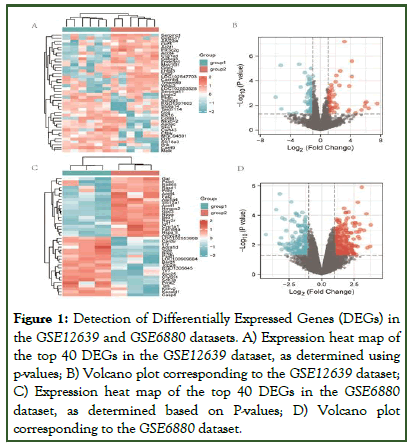
Figure 1: Detection of Differentially Expressed Genes (DEGs) in the GSE12639 and GSE6880 datasets. A) Expression heat map of the top 40 DEGs in the GSE12639 dataset, as determined using p-values; B) Volcano plot corresponding to the GSE12639 dataset; C) Expression heat map of the top 40 DEGs in the GSE6880 dataset, as determined based on P-values; D) Volcano plot corresponding to the GSE6880 dataset.
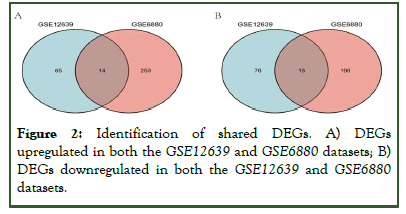
Figure 2: Identification of shared DEGs. A) DEGs upregulated in both the GSE12639 and GSE6880 datasets; B) DEGs downregulated in both the GSE12639 and GSE6880 datasets.
GO and KEGG pathway enrichment analysis of DEGs
After construction of the PPI network, functional annotations conducted by GO and KEGG analyses revealed that the DEGs were enriched in biological processes including the acyl-CoA metabolic process, thioester metabolic process, nucleoside bisphosphate metabolic process, ribonucleoside bisphosphate metabolic process, and purine nucleoside bisphosphate metabolic process. The DEGs were enriched in the molecular functions of CoA hydrolase activity, thioester hydrolase activity, acyl-CoA hydrolase activity, palmitoyl-CoA hydrolase activity, and sodium channel regulator activity, and the cell components of mitochondrial matrix, mitochondrial inner membrane, and organelle inner membrane. The top GO terms are visually displayed in a bubble plot in Figure 3. KEGG pathway analysis revealed that the pathways enriched by the DEGs included ovarian steroidogenesis, fatty acid elongation, biosynthesis of unsaturated fatty acids, synthesis and degradation of ketone bodies, and butanoate metabolism (Table 1).
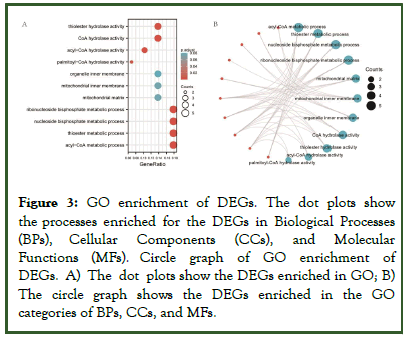
Figure 3: GO enrichment of DEGs. The dot plots show the processes enriched for the DEGs in Biological Processes (BPs), Cellular Components (CCs), and Molecular Functions (MFs). Circle graph of GO enrichment of DEGs. A) The dot plots show the DEGs enriched in GO; B) The circle graph shows the DEGs enriched in the GO categories of BPs, CCs, and MFs.
| Ontology | ID | Description | Gene ratio | Bg ratio | P value | p.adjust | Q value |
|---|---|---|---|---|---|---|---|
| BP | GO:0006637 | Acyl-CoA metabolic process | 5/28 | 85/17962 | 1.90e-07 | 7.27e-05 | 5.53e-05 |
| BP | GO:0035383 | Thioester metabolic process | 5/28 | 85/17962 | 1.90e-07 | 7.27e-05 | 5.53e-05 |
| BP | GO:0033865 | Nucleoside bisphosphate metabolic process | 5/28 | 107/17962 | 6.02e-07 | 9.21e-05 | 7.00e-05 |
| BP | GO:0033875 | Ribonucleoside bisphosphate metabolic process | 5/28 | 107/17962 | 6.02e-07 | 9.21e-05 | 7.00e-05 |
| BP | GO:0034032 | Purine nucleoside bisphosphate metabolic process | 5/28 | 107/17962 | 6.02e-07 | 9.21e-05 | 7.00e-05 |
| CC | GO:0005759 | Mitochondrial matrix | 4/29 | 309/18446 | 0.001 | 0.075 | 0.063 |
| CC | GO:0005743 | Mitochondrial inner membrane | 4/29 | 362/18446 | 0.002 | 0.075 | 0.063 |
| CC | GO:0019866 | Organelle inner membrane | 4/29 | 413/18446 | 0.004 | 0.081 | 0.068 |
| MF | GO:0016289 | CoA hydrolase activity | 4/29 | 24/16882 | 7.28e-08 | 8.23e-06 | 4.68e-06 |
| MF | GO:0016790 | Thiolester hydrolase activity | 4/29 | 44/16882 | 9.09e-07 | 5.14e-05 | 2.92e-05 |
| MF | GO:0047617 | Acyl-CoA hydrolase activity | 3/29 | 22/16882 | 6.87e-06 | 2.59e-04 | 1.47e-04 |
| MF | GO:0016290 | Palmitoyl-CoA hydrolase activity | 2/29 | 13/16882 | 2.20e-04 | 0.006 | 0.004 |
| MF | GO:0017080 | Sodium channel regulator activity | 2/29 | 30/16882 | 0.001 | 0.027 | 0.015 |
| KEGG | rno04913 | Ovarian steroidogenesis | 4/20 | 62/9437 | 7.56e-06 | 3.86e-04 | 3.11e-04 |
| KEGG | rno00062 | Fatty acid elongation | 3/20 | 32/9437 | 3.88e-05 | 9.45e-04 | 7.61e-04 |
| KEGG | rno01040 | Biosynthesis of unsaturated fatty acids | 3/20 | 36/9437 | 5.56e-05 | 9.45e-04 | 7.61e-04 |
| KEGG | rno00072 | Synthesis and degradation of ketone bodies | 2/20 | 12/37 | 2.78e-04 | 0.004 | 0.003 |
| KEGG | rno00650 | Butanoate metabolism | 2/20 | 29/9437 | 0.002 | 0.017 | 0.014 |
Table 1: Functional and pathway enrichment analyses for module genes. The top 3 terms were selected based upon p value rankings when >3 terms were enriched for a given category.
Establishment of PPI network and identification of hub genes
To study the interactions between the proteins corresponding to the 30 DEGs, the STRING database was used to construct a PPI network. Cytoscape software was used to visualize the total PPI network (Figure 4A). The MCODE Cytoscape plug-in was used to construct functional modules. The results showed that there was only one module with an established score >5, consisting of 14 genes and 70 edges (Figure 4B). The ten topological methods of the CytoHubba plug-in in Cytoscape were used to screen the top 15 hub genes. There were two genes identified by all ten methods, Hmgcs 2 and Eci 1 (Figure 4C and Table 2). Hmgcs 2 was both the gene that existed in the functional module and the upregulated gene with the highest score in the MCC method, the most accurate method [12].
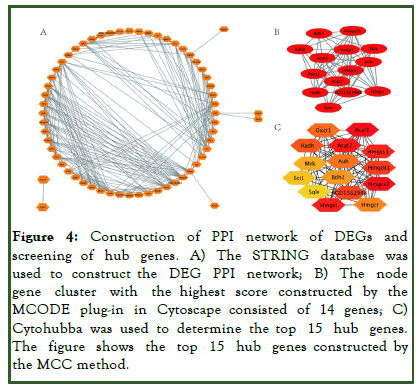
Figure 4: Construction of PPI network of DEGs and screening of hub genes. A) The STRING database was used to construct the DEG PPI network; B) The node gene cluster with the highest score constructed by the MCODE plug-in in Cytoscape consisted of 14 genes; C) Cytohubba was used to determine the top 15 hub genes. The figure shows the top 15 hub genes constructed by the MCC method.
| MCC | MNC | Degree | EPC | Bottleneck | EcCentricity | Closeneess | Radialitytytytty | Between eness | Stressssss |
|---|---|---|---|---|---|---|---|---|---|
| Acat1 | Hmgcl | Hmgcl | Hmgcl | Slc2a4 | Apoa1 | Hmgcl | Lpl | Hmgcr | Slc2a4 |
| Hmgcs2 | Hmgcs2 | Hmgcs2 | Hmgcs2 | Lpl | Lpl | Eci1 | Hmgcr | Eci1 | Hmgcr |
| Acat2 | Acat1 | Acat1 | Acat1 | Irs1 | Acat1 | Hmgcs2 | Eci1 | Slc2a4 | Eci1 |
| Hmgcl | Eci1 | Eci1 | Hadh | Hmgcr | Sqle | Hmgcr | Slc2a4 | Lpl | Lpl |
| Hmgcs1 | Irs1 | Irs1 | Oxct1 | Eci1 | Auh | Acat1 | Apoa1 | Irs1 | Irs1 |
| Hmgcll1 | Hadh | Hadh | Hmgcr | Apoa1 | Eci1 | Irs1 | Hmgcs2 | Aldh2 | Aldh2 |
| RGD1562948 | Oxct1 | Oxct1 | Acat2 | Sqle | RGD1562948 | Slc2a4 | Hmgcl | Ikbkb | Apoa1 |
| Hadh | Acat2 | Hmgcr | Eci1 | Aldh2 | Acat2 | Hadh | Acat1 | Apoa1 | Hadh |
| Oxct1 | Hmgcs1 | Acat2 | RGD1562948 | Shc1 | Hmgcll1 | Acat2 | Irs1 | Igf1 | Ikbkb |
| Auh | Hmgcr | Hmgcs1 | Hmgcs1 | Hmgcs2 | Hmgcl | Hmgcs1 | Igf1 | Hadh | Igf1 |
| Hmgcr | RGD1562948 | RGD1562948 | Hmgcll1 | Aldh1a1 | Hmgcs1 | Oxct1 | Acat2 | Ckb | Hmgcl |
| Bdh2 | Igf1 | Igf1 | Auh | Ikbkb | Hmgcs2 | Igf1 | Hmgcs1 | Hmgcl | Hmgcs2 |
| Mvk | Hmgcll1 | Hmgcll1 | Mvk | Ikbkg | Acot4 | Lpl | RGD1562948 | Sqle | Ckb |
| Eci1 | Igf1r | Igf1r | Bdh2 | Hmgcl | Aldh2 | RGD1562948 | Hmgcll1 | Hmgcs2 | Shc1 |
| Sqle | Auh | Auh | Decr1 | Cyp1a1 | Cyp1a1 | Hmgcll1 | Sqle | Shc1 | Igf1r |
Table 2: Top 15 DEGs by 10 topological analysis methods of CytoHubba.
Screening for potential pharmacological targets
Screening results of potential pharmacological targets were downloaded from cMAP and ranked and filtered based on the connectivity scores for the drugs. The top ten medications suggested for infarction in diabetics were alectinib, ITE, QLX- 138, lypressin, GSK-461364, P-22077, PF-477736, BRDK20168484,diclofenac, and altretamine (Table 3). These drugs have the potential to be therapeutic agents for infarction with diabetes.
| Name | Description |
|---|---|
| Alectinib | ALK inhibitor |
| ITE | Aryl hydrocarbon receptor agonist |
| QL-X-138 | MTOR inhibitor |
| Lypressin | Vasopressin receptor agonist |
| GSK-461364 | PLK inhibitor |
| P-22077 | Ubiquitin specific protease inhibitor |
| PF-477736 | CHK inhibitor |
| BRD-K20168484 | Lipoxygenase inhibitor |
| Diclofenac | Cyclooxygenase inhibitor |
| Altretamine | DNA inhibitor |
Table 3: Top 10 prediction results from cMap for infarction with diabetics cardiac.
Discussion
Microarray gene expression profiling is an integrated tool to identify disease related genes and understand the underlying mechanisms of disease and dysfunctional pathways, including cardiovascular diseases [13]. However, at present, a large amount of data collected from various laboratories or large international alliances often gives contradictory results. This is mainly due to different sample sizes, races, and disease states of recruited patients. Therefore, integrating different transcriptome datasets may be a promising method to eliminate bias and accurately locate reliable disease biomarkers.
To evaluate the feasibility and sensitivity of different gene expression profiles in myocardium after myocardial infarction in diabetes, we first performed a genome-wide microarray analysis on rats with myocardial infarction with diabetes and a control group of rats with myocardial infarction without diabetes, and then conducted a genome-wide microarray analysis of the myocardium cohorts of healthy controls and diabetes. We identified 65 upregulated and 76 downregulated DEGs related to myocardial infarction with diabetes in the GSE12639 dataset, as well as 250 upregulated and 196 downregulated myocardial diabetes related DEGs in the GSE6880 dataset. There were 30 differentially expressed genes (14 upregulated and 16 downregulated) shared between the two datasets that were used in subsequent analyses to investigate the changes in myocardial expression profiles after myocardial infarction caused by diabetes.
GO enrichment showed that the DEGs were enriched in the acyl-CoA metabolic process, CoA hydrolase activity, and the mitochondrial matrix. This indicated that metabolism-related pathways and mitochondria play a major role in the pathological process of acute MI resulting from diabetes. KEGG enrichment analysis showed that the DEGs were mainly enriched in ovarian steroidogenesis, fatty acid elongation, biosynthesis of unsaturated fatty acids, synthesis and degradation of ketone bodies, and butanoate metabolism. This result indicates that acute myocardial infarction in diabetic patients may mainly affect cardiac adipocytes, which activates related lipid metabolism pathways.
After analyzing the PPI network of the DEGs, we found that Hmgcs2 and Eci1 were simultaneously present in the top 15 hub genes screened by ten CytoHubba topology methods and the functional gene modules constructed by MCODE. HMGCS2 is a key enzyme that controls ketone synthesis [14]. The expression and activity of HMGCS2 are regulated by several transcription factors and by post-translational modifications including acetylation [15]. Sikder et al., showed that circulating HMGCS2 was elevated in high fat diet-induced diabetic rats [16]. It has been reported that Hmgcs2 silencing attenuates high glucose induced in vitro diabetic cardiomyopathy by increasing cell viability, and inhibiting apoptosis, inflammation, and oxidative stress [17]. Moreover, Asif et al., found that Hmgcs2-mediated ketogenesis modulates hepatic lipid regulation under a fat enriched nutritional environment. However, the expression changes of Hmgcs2 after myocardial infarction in diabetes, the metabolism related pathways and myocardial mitochondria related pathways of Hmgcs2, and the regulation of heart lipids have not yet been reported.
This study has some limitations. The genes differentially expressed in myocardial infarction with diabetes, especially the hub genes and signaling pathways, need to be further verified by cell experiments and clinical samples. In addition, we screened for potential therapeutic compounds targeting hub genes and pathways by bioinformatics methods, providing a theoretical basis for exploring new therapeutic strategies. However, further verification by animal experiments is required.
Conclusion
In conclusion, the results of this study reveal novel mechanisms and important hub genes that may contribute to the development of myocardial infarction with diabetes. Our data provide a theoretical basis for exploring new therapeutic strategies. Further research is essential in the future to better explore the causal relationship of these genes to firmly establish their value as clinical biomarkers, which may provide novel potential therapeutic targets and prognostic markers.
Acknowledgments
We thank Catherine Perfect, MA (Cantab), from Liwen Bianji (Edanz) (www.liwenbianji.cn), for editing the English text of a draft of this manuscript.
Author's Contributions
WW, YL, and YXF contributed to the research performance, data analysis, and writing of the study. GZR designed the experiments. WL, ZY, YL, PJQ and TRX collected the data, which was supervised by GZR. All authors contributed to the article and approved the submitted version.
Funding
This study was funded by the science and technology development foundation of Pudong new area (PKJ2020-Y26).
Availability of Data and Materials
The datasets during and/or analyzed during the current study available from the corresponding author on reasonable request.
Ethics Approval and Consent to Participate
Not applicable.
Consent for Publication
Not applicable.
Conflict of Interest
The authors declare that they have no conflicts of interest.
References
- Einarson TR, Acs A, Ludwig C, Panton UH. Prevalence of cardiovascular disease in type 2 diabetes: A systematic literature review of scientific evidence from across the world in 2007-2017. Cardiovasc Diabetol. 2018;17(1):83.
[Crossref] [Google Scholar] [PubMed]
- Talmor-Barkan Y, Bar N, Shaul AA, Shahaf N, Godneva A, Bussi Y, et al. Metabolomic and microbiome profiling reveals personalized risk factors for coronary artery disease. Nat Med. 2022;28(2):295-302.
[Crossref] [Google Scholar] [PubMed]
- Naito R, Miyauchi K. Coronary artery disease and type 2 diabetes mellitus. Int Heart J. 2017;58(4):475-480.
[Crossref] [Google Scholar] [PubMed]
- Potere N, del Buono MG, Vecchie A, Porreca E, Abbate A, Dentali F, et al. Diabetes mellitus and heart failure: An update on pathophysiology and therapy. Minerva Cardiol Angiol. 2022;70(3):344-356.
[Crossref] [Google Scholar] [PubMed]
- Aguilar D, Solomon SD, Kober L, Rouleau JL, Skali H, McMurray JJ, et al. Newly diagnosed and previously known diabetes mellitus and 1-year outcomes of acute myocardial infarction: The VALsartan In Acute myocardial iNfarcTion (VALIANT) trial. Circulation. 2004;110(12):1572-1578.
[Crossref] [Google Scholar] [PubMed]
- Taegtmeyer H, McNulty P, Young ME. Adaptation and maladaptation of the heart in diabetes: Part I: General concepts. Circulation. 2002;105(14):1727-1733.
[Crossref] [Google Scholar] [PubMed]
- Diamant M, Lamb HJ, Groeneveld Y, Endert EL, Smit JW, Bax JJ, et al. Diastolic dysfunction is associated with altered myocardial metabolism in asymptomatic normotensive patients with well-controlled type 2 diabetes mellitus. J Am Coll Cardiol. 2003;42(2):328-335.
[Crossref] [Google Scholar] [PubMed]
- Vernon ST, Hansen T, Kott KA, Yang JY, O'Sullivan JF, Figtree GA. Utilizing state of the art" omics" technology and bioinformatics to identify new biological mechanisms and biomarkers for coronary artery disease. Microcirculation. 2019;26(2):e12488.
[Crossref] [Google Scholar] [PubMed]
- Szklarczyk D, Gable AL, Lyon D, Junge A, Wyder S, Huerta-Cepas J, et al. STRING v11: Protein-protein association networks with increased coverage, supporting functional discovery in genome wide experimental datasets. Nucleic Acids Res. 2019;47(D1):D607-D613.
[Crossref] [Google Scholar] [PubMed]
- Yang K, Lu K, Wu Y, Yu J, Liu B, Zhao Y, et al. A network based machine learning framework to identify both functional modules and disease genes. Hum Genet. 2021;140(6):897-913.
[Crossref] [Google Scholar] [PubMed]
- Chin CH, Chen SH, Wu HH, Ho CW, Ko MT, Lin CY. cytoHubba: Identifying hub objects and sub-networks from complex interactome. BMC Syst Biol. 2014;8(Suppl 4):S11.
[Crossref] [Google Scholar] [PubMed]
- de Franciscis S, Metzinger L, Serra R. The discovery of novel genomic, transcriptomic, and proteomic biomarkers in cardiovascular and peripheral vascular disease: The state of the art. Biomed Res Int. 2016;2016:7829174.
[Crossref] [Google Scholar] [PubMed]
- Li S, Qian X, Gong J, Chen J, Tu W, Chen X, et al. Exercise training reverses lipotoxicity induced cardiomyopathy by inhibiting HMGCS2. Med Sci Sports Exerc. 2021;53(1):47-57.
[Crossref] [Google Scholar] [PubMed]
- Kim JT, Li C, Weiss HL, Zhou Y, Liu C, Wang Q, et al. Regulation of ketogenic enzyme HMGCS2 by Wnt/β-catenin/PPARγ pathway in intestinal cells. Cells. 2019;8(9):1106.
[Crossref] [Google Scholar] [PubMed]
- Sikder K, Shukla SK, Patel N, Singh H, Rafiq K. High fat diet upregulates fatty acid oxidation and ketogenesis via intervention of PPAR-γ. Cell Physiol Biochem. 2018;48(3):1317-1331.
[Crossref] [Google Scholar] [PubMed]
- Chen D, Ruan X, Liu Y, He Y. HMGCS2 silencing attenuates high glucose induced in vitro diabetic cardiomyopathy by increasing cell viability, and inhibiting apoptosis, inflammation, and oxidative stress. Bioengineered. 2022;13(5):11417-11429.
[Crossref] [Google Scholar] [PubMed]
- Asif S, Kim RY, Fatica T, Sim J, Zhao X, Oh Y, et al. Hmgcs2 mediated ketogenesis modulates high fat diet induced hepatosteatosis. Mol Metab. 2022;61:101494.
[Crossref] [Google Scholar] [PubMed]
Citation: Wu W, Yan L, Yuan XF, Wang L, Zhang Y, Yin L, et al. (2023) Identification of Key Proteins as Potential Biomarkers Associated with Post-Infarction Complications in Diabetics. J Clin Exp Pharmacol. 13:392.
Copyright: © 2023 Wu W, et al. This is an open access article distributed under the terms of the Creative Commons Attribution License, which permits unrestricted use, distribution, and reproduction in any medium, provided the original author and source are credited.
