

Indexed In
- Academic Journals Database
- Open J Gate
- Genamics JournalSeek
- JournalTOCs
- ResearchBible
- Ulrich's Periodicals Directory
- Electronic Journals Library
- RefSeek
- Hamdard University
- EBSCO A-Z
- OCLC- WorldCat
- Scholarsteer
- SWB online catalog
- Virtual Library of Biology (vifabio)
- Publons
- MIAR
- Geneva Foundation for Medical Education and Research
- Euro Pub
- Google Scholar
Useful Links
Share This Page
Journal Flyer

Open Access Journals
- Agri and Aquaculture
- Biochemistry
- Bioinformatics & Systems Biology
- Business & Management
- Chemistry
- Clinical Sciences
- Engineering
- Food & Nutrition
- General Science
- Genetics & Molecular Biology
- Immunology & Microbiology
- Medical Sciences
- Neuroscience & Psychology
- Nursing & Health Care
- Pharmaceutical Sciences
Research Article - (2020) Volume 11, Issue 2
An Extended Analysis of SARS-CoV-2 Using a Nonlinear Dynamics Chaotic Model
Lin Fang1, Xinlei Wang1, Zhongyuan Lai1,2, Dongdong Zhang1, Mengqu Wu1, Zhirui Pan1, Li Wang1, Kun Tang1, Dahong Qian1,3, Zhende Huang1,3, Xudong Wang1* and Haibo Chen1*2Department of Physics, Fudan University, Shanghai 200433, China
3School of Biomedical Engineering, Shanghai Jiao Tong University, Shanghai 200240, China
Received: 17-Aug-2020 Published: 07-Sep-2020
Abstract
The two dimensional cellular automata (CA) picture is an alternative method to depict the nucleotide and amino acid sequences. Here we showed that the two dimensional CA pictures can vividly delineate the nucleotide sequences (base sequence) of the gene and the genomes of SARS-CoV-2, the pathogenic agent of the COVID-19 pandemic. If the genetic codon rules are strictly followed, the CA pictures can also depict the genetic codons and indirectly express the amino acid sequences of the proteins of SARS-CoV-2. CA pictures can reveal the overall and detailed differences between nucleotide or amino acid sequences and they are very sensitive to the sequence details, such as the cleavage recognition site of the host protease like TMPRSS2, and the receptor binding domain (RBD) of the spike protein of SARS-CoV-2, which are sensitive to even changes in only one amino acid or a nucleotide between the sequences from different strains of SARS-CoV2. We think that CA pictures can provide a mathematical basis for viral genetic and amino acid sequence messages or be applied to artificial intelligence when expressing the genetic messages of SARS-CoV2 and other viruses.
Keywords
SARS-CoV-2; Coronavirus; N-dimensional; Fusion Peptide.
Introduction
The ongoing COVID-19 pandemic has been traced to the emergence of a new species of coronavirus of the subgenus Sarbecovirus and genus Betacoronavirus, which originated from wildlife [1,2], around the end of 2019 [3]. Human-to-human transmission was confirmed around January 2020 [4] and has subsequently led to large scale global transmission. This virus has been officially denoted as SARS-CoV-2, and has been identified as an intimate relative of the original SARS virus which caused the first coronavirus epidemic in 2003 [5].
There are various visual representations (‘pictures’) constructed from cellular automata (CA) [6]. Here we proposed a new, unique way and insight based on CA to depict the overall genetic sequences, and discern minute differences in the viral gene, protein or genomic structures. Specifically, by encoding raw genomic information in a specific way, we iteratively apply simple CA update rules to genetic data and produce pictures unique to each gene, protein or genome. Those pictures are unique in the sense that any changes to the amino acid or the nucleotide sequence will result in a completely different picture. Subsequently, local variations of standard sequences due to obvious or tiny changes from mutations and/or recombination events can then be quickly identified and studied. This is in contrast to traditional methods such as BLAST [7] in terms of simplicity and elegance.
Aims and Methods
Cellular automata
A cellular automaton is a simple computer program which takes as input an N-dimensional discrete array of cells, each of which contains a numerical value. The computer program is uniquely defined by an update rule, which acts upon the input to produce an output that is then subject to the same update rule, in which the output is then again updated. This process is then carried out in a sequence of discrete “time” steps until some predetermined end time. The resulting graphical representation of this process could show some striking features, which we will elaborate on in another section. For details on the update rule, please refer to the supporting information. A notable aspect of cellular automata generally constructed in such a manner (but perhaps obeying different update rules) is their property of emergence. Emergence in a complex system refers to the ability of the system to generate complex structures and correlations between its constituent parts even when starting from simple initial conditions. By using very simple update rules, it is possible to end up with very complex large-scale behavior.
Even starting from one of the simplest possible states, a ‘00000000100000000’ sequence, the resulting generation is that of a complex picture. The emergence of these complex structures enables cellular automata to be used for extracting complex correlations in seemingly simple data. Furthermore, for a cellular automata generating process in genomics, even a change in one or several basis points in the initial input could create a butterfly effect that alters the characteristics of the entire sequence, including combinatorial features in different local regions and specific points on the sequence, and reveal different correlational patterns and aspects in the generated figure (Figure 1).

Figure 1. The Comparison of the Rule226 CA Pictures of the Receptor Binding Proteins from 11 different viruses: H1N1 high pathogenic influenza virus for human, H5N1 high Pathogenic influenza virus for avian animals, HIV, Chinese Swine Acute Diarrhea Syndrome Coronavirus (SADS-CoV), Bat Coronavirus RaTG13, Pangolin CoV (GX), Avian Infectious Bronchitis Virus (Avian IBV, human Coronavirus OC43, MERS-CoV, SARSCoV (Accession ID: NC_004718.3;Strain name: Tor2) and SARS-CoV-2(Accession ID: NC_045512; Strain name: Wuhan-Hu-1). Please pay attention to the location of the Receptor Binding Domain (RBD) labeled green. The Codon rule for expression of the amino acid was strictly abided by. Please check the amino acid Sequences etc. of the proteins in this figure within Figure S2. Please check the details of the viral strains in Table S1.
Algorithm for transforming a base sequence into a picture
To speed up the algorithm for transforming a base sequence into a picture, a Deep Learning Framework, TensorFlow, was used to build a calculation graph in a recursive way. Suppose x is a base sequence (Equation 1),
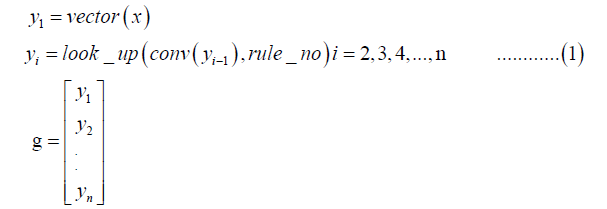
Where the function vector () transforms the base sequence x into a vector where A→ 00, T→11, C → 01, and G → 10.
The function conv () is a one-dimensional convolution operation in TensorFlow. Its kernel and stride were [1, 2, 4] and 1, respectively. The left and the right paddings were both 0. Every 3 digits was transformed into an octal number. The function look_up () took the octal numbers as the indices with which the output values were looked up over a rule denoted by rule_no. Suppose rule_no was 229, or expressed as 11100101 in binary form; then the index (based on zero) of each digits in the binary number was used. The vectors in g produced the final picture where yi was its i’th row composed of 0’s and 1’s.
For example, suppose x was GCT and rule_no was 229; y1 was therefore 100111. The result of the one-dimensional convolution applied to 01001110 was 214673. The binary form of the rule 229 was 11100101. For convenience, it was reversed as 10100111. The result of the function look_up() was 100110, which was assigned to y2. In the same way, y3 was 100100. Finally, we formed a picture by concatenating all yi, i=1, 2, ……, n.
Results
We explored all of the 256 types of CA pictures and found that the rule_226 CA pictures, shown below, are the suitable choices when describing the nucleotide sequence of the viral gene or the amino acid sequence of the viral proteins. The other types of CA pictures, including the rule_184 CA pictures, which are also shown below, can be used to depict the viral genome with similar effects.
In Figure 1 and Supplementary Figure S4, we showed the rule_226 pictures of the receptor binding proteins (RBP) from 11 different viruses and the rule_184 pictures of the genomes from HIV, SARSCoV, and SARS-CoV-2. We also marked the receptor binding domains (RBD) of the respective viruses. It is clear that all these CA pictures are generally distinct and represent a visual method of distinguishing the genetic and protein messages of the different viruses.
In Figure 2, we compared the CA rule_226 pictures obtained from SARS-CoV and SARS-CoV-2 for their Spike (S) proteins [8]. Important functional regions, such as the signal peptide (SP), Receptor Binding Motif (RBM), Fusion Peptide (FP), Inserted amino acid/host protease recognition site, and cleavage site (amino acid PRRAR) [9] by the host protease like TMPRSS2 [10] have been marked on both CA pictures of the aforementioned S proteins. Please check Supplementary Figure S2 for the sequence and the phylogenetic tree background of the S proteins & S genes from SARS-CoV-2 and other 10 viruses, including influenza viruses, HIV and 8 other coronaviruses.

Figure 2. The Comparison of the Rule_226 CA Pictures between S Proteins of SARS-CoV-2(NC_045512)and SARS-CoV(NC_004718.3). Please pay attention to the labeled or enlarged sections of the signal peptide (SP), Receptor Binding Motif (RBM), Fusion Peptide (FP) and Inserted amino acid/host protease recognition site/cleavage site (amino acid PRRAR). PRRAR was labeled in top right CA picture (the original SARS-CoV-2 CA picture). The codon rules for expression of the amino acid was strictly abided by. Please check the amino acid Sequences of the proteins in this figure within Figure S2. Please check the details of the viral strains in Table S1.
Figures 3 and Figures 4 showed the CA pictures obtained from single nucleotide polymorphisms (SNPs) in different strains of SARS-COV-2. Figure 3 showed the tiny graphic pattern differences in the CA pictures obtained from two strains of the SARS-COV-2 virus differing by a synonymous SNP at base positions 28 or 247 in the S protein, when compared respectively to that of the reference strain of SARS-CoV-2. Our alignment results on the two different strains of SARS-CoV virus in Fig. S3 confirm our CA picture results. When a nonsynonymous mutation is induced in the receptor binding motif (RBM) section of the SARS-COV-2 S-protein (specifically changed the base “AAT” at location 193 of the RBM section to “AAC”), we showed in Figure 4 that the minute differences generated by the rule_226 CA pictures. It is possible to Top: We specifically changed the base “AAT” at location 193 of the RBM’s coding sequence (CDS) into “AAC”. The amino acid positions of the RBM in the S protein of SARS-CoV-2 (NC_045512) is from amino acid 437 to amino acid 508 [12,13]. Please pay attention to the single string before the mutation (the left CA picture) and the double string after the mutation (the right CA picture).

Figure 3. Delineating the Single Nucleotide Polymorphisms (SNPs) on the S proteins from different Strains of SARS-CoV-2 with Rule- 226_CA Pictures. Top: The original rule-226_CA pictures. From top to bottom, the 3 CA pictures are from the S proteins of NC_0045512 (from Wuhan, China, the reference sequence of SARS-CoV-2), MT049951 (from Yunnan, China)and MT093571(from Sweden)respectively. Bottom: The enlarged CA pictures showing the SNP of the S proteins of MT049951(from Yunnan, China, the Y on the 28th amino acid replaced by N), EPI_ISL_406844(from Australia, the S on the 247th amino acid replaced by R). The codon rule for expression of the amino acid was strictly abided by. Please check the amino acid Sequences of the proteins in this figure within Figure S3. Please check the details of the viral strains in Table S1.

Figure 4. The Rule_226 CA Pictures Showing the Nonsynonymous Mutation in the Receptor Binding Motif (RBM) Section of the SARSCOV- 2 S-protein Top: We specifically changed the base “AAT” at location 193 of the RBM’s coding sequence (CDS) into “AAC”. The amino acid positions of the RBM in the S protein of SARS-CoV-2 (NC_045512) is from amino acid 437 to amino acid 508 [12,13]. Please pay attention to the single string before the mutation (the left CA picture) and the double string after the mutation (the right CA picture). Bottom: The nucleotide sequence and the position showing the RBM’s coding sequence (CDS) and the positions within the S gene of SARSCoV- 2 (NC_045512). The codon rules for expression of the amino acid were strictly abided by. Please check the details of the viral strain in Table S1.
Encode the initial protein at the level of amino acids and obtain similar information by taking codon biases into account [11]. It is also reasonable to consider that the CA pictures can reflect the implications of the codon bias.
The codon rule for expression of the amino acid was strictly abided by. Please check the amino acid Sequences of the proteins in this figure within Figure S3. Please check the details of the viral strains in Table S1.
The codon rules for expression of the amino acid was strictly abided by. Please check the details of the viral strain in Table S1.
Discussion
In general, a CA representation is able to provide information about amino acid and base sequences due to the one-to-one transformations used to map between genomic and binary information. Specifically, the mapping ensures that every gene or genome is represented by only one unique two-dimensional CA, thus enabling genetic identification.
In the case when the usual open frame rules (the genetic codon rules) have been obeyed, the CA is also able to uniquely identify amino acid sequences. The important protein landmarks responsible for the transmissibility of the SARS-CoV-2 virus such as the RBD, and RBM within the RBD of the S protein that directly contacts the host receptor (ACE2) [9]. The aforementioned functional sections of SARS-Cov-2 can be depicted vividly through CA pictures.
Apart from visualizing stable genic, protein, or genomic configurations, CAs are also very sensitive to mutations [14] of the nucleotide and amino acidic sequences. Such variations on the basic configuration of a genic sequence can be easily identified by comparing the different CA representations generated when a locus on the nucleotide sequence or a complete amino acid sequence is modified. In the case of the SARS-CoV-2 virus, this method of CA comparison can be employed for the identification of the function sites, such as the recognition site of the host protease TMPRSST2 [10].
In addition, since the CAs are already sensitive to changes at the nucleotide sequence level, they are particularly useful for delineating the effects of codon biases between genic or genomic sequences from different species. So the CA method can be used to predict species’ preference for specific genetic configurations. This feature could also be used to account for synonymous and nonsynonymous mutations. We believe that maybe this is a unique method among conventional bioinformatics tools in that it relies on the principle of sequence entropy maximization.
Cellular automata were originally introduced as a discrete model of dynamical systems [14] that show complex emergent phenomena starting from simple update rules. Due to its simplicity it has been used in many fields, mostly as simple toy models in the study of nonlinear complex systems [15]. In biology it represents a novel method of encoding genic or genomic information [16,17]. Since the update rules of CAs can be easily applied to binary-encoded genic sequences, the resulting CA pictures often contain valuable information on important regions of a gene (a protein) due to its sensitivity to the changes of the genetic message, such as genic mutations or genic recombination [18]. CAs have been applied to biological processes in various contexts, such as the identification of promoter sites and improving cancer therapy [19], modeling microfluidic dynamics [20], modeling of biochemical and multicellular systems [21,22], and applications in neuroscience. One of the authors of this paper also previously published a paper which applied CA methods in the description of the genes and genome of SARS-CoV [23-27].
Conclusion
In addition to the specificity of CAs in delineating and identifying important genic or protein’s regions, they also represent an interesting path towards the integration of biological information with methodologies in machine learning and artificial intelligence. The update rules of CAs represent a unique way to quantify genic, protein’s or genomic information on length scales from a section of a gene or protein to the entire genome since it is able to correlate local information from different gene regions and is thus able to offer a unified view of the full sequence instead of only local characteristics currently achievable by using traditional methods such as BLAST. Also worth mentioning is that other existing bioinformatic methods which uses visual representations include the Deepvariant and Haploview methods, which are different with CA.
Acknowledgements
We acknowledge Professor Lei Cai from the School of Life Sciences and Biotechnology, Shanghai Jiao Tong University for suggestions.
Author Contributions
W.X.D. is responsible for overall design and verification of thesis research, virology and molecular biology significance design, discussion, interpretation and writing, and chart legend writing. C.H.B. is responsible for this research direction and quality check. W.X.L. is responsible for the overall discussion and suggestions of the paper. H.Z.D. is responsible for providing the overall design of the CA method, overall review, and quality control of the paper. Z.D.D. is responsible for research on quality control and biological significance. T.K., L.Z.Y., and W.M.Q. are responsible for writing and proofreading the CA part of the thesis. Q.D.H. is responsible for checking the overall quality of the thesis. P.Z.R. is responsible for chart creation. F.B. is responsible for CA method research, design and chart creation. W.L. is responsible for virus strain data quality and background check, chart description, and proofreading.
Competing Interests
The authors declare no competing interests.
REFERENCES
- Zhou P, Yang X, Wang X, Hu B, Zhang L, Zhang W, et al. A pneumonia outbreak associated with a new coronavirus of probable bat origin. Nature 2020; 579: 270–3.
- Xiao KP, Zhai J, Feng Y, Zhou N, Zhang X, Zou JJ, et al. Isolation and Characterization of 2019-nCoV-like Coronavirus from Malayan Pangolins. 2020.
- WHO. 2020. Naming the coronavirus disease (COVID-19) and the virus that causes it.
- Li C, Ji F, Wang L, Wang L, Hao J, Dai M, et al. Asymptomatic and human-to-human transmission of SARS-CoV-2 in a 2-family cluster, Xuzhou, China. Emerg Infect Dis. 2020; 26: 1626-1628.
- Drosten C, Gunther S, Preiser W, van der Werf S, Brodt HR, et al. Identification of a novel coronavirus in patients with severe acute respiratory syndrome. N Engl J Med 2003; 348: 1967-76.
- Wolfram S. A New Kind of Science. Wolfram Media. 2002.
- Altschul SF, Gish W, Miller W, Myers EW, Lipman DJ. Basic local alignment search tool. J Mol Biol. 1990; 215: 403-10.
- Wrapp D, Wang NS, Corbett KS, Goldsmith JA, Hsieh CL, Abiona O, et al. Cryo-EM structure of the 2019-nCoV spike in the prefusion conformation. Sci. 2020; 367: 1260-3.
- Letko M, Marzi A, Munster V. Functional assessment of cell entry and receptor usage for SARS-CoV-2 and other lineage B betacoronaviruses. Nat Microbiol. 2020; 5: 562-9.
- Meng T, Cao H, Zhang H, Kang ZJ, Xu D, Gong H, et al. The insert sequence in SARS-CoV-2 enhances 1 spike protein cleavage by 2 TMPRSS. 2020.
- Gu HG, Chu DKW, Peiris JSM, Poon LLM. Multivariate analyses of codon usage of sars-cov-2 and other betacoronaviruses. 2020.
- Song ZQ, Xu YF, Bao LL, Zhang L, Yu P, Qu Y, et al. From SARS to MERS, Thrusting Coronaviruses into the Spotlight. Viruses. 2019;11: 59.
- Lam TY, Shum HH, Zhu HC, Shum MHH, Jiang JF, Zhu HC, et al. Identifying SARS-CoV-2 related coronaviruses in Malayan pangolins. Nature 2020; 583:282-285.
- Xie HM. 1994. Complexity and Dynamical Systems. Shanghai Scientific and Technological Education Publishing House.
- Adamatzky A. Cellular Automata: A Volume in the Encyclopedia of Complexity and Systems Science, 2nd Ed., Springer US, 2018.
- Sirakoulis G, Karafyllidis I, Mizas C, Mardiris V, Thanailakis A, Tsalides Ph. A cellular automaton model for the study of dna sequence evolution. Comp Biol Med. 2003; 33: 439–53.
- Mizas C, Sirakoulis GC, Mardiris V, Karafyllidisa I, Glykosb N, Sandaltzopoulos R, et al. Reconstruction of dna sequences using genetic algorithms and cellular automata: Towards mutation prediction? Biosystems. 2008; 92: 61–8.
- de Bakker PI, Yelensky R, Pe'er I, Gabriel SB, Daly MJ, Altshuler D. Efficiency and power in genetic association studies. Nature Genetics. 2005; 37: 1217–23.
- Gizdem A. The use of biological cellular automaton models in medical, health and biological studies. Procedia - Social and Behavioral Sciences. 2011; 28: 825-831.
- Kier LB, Seybold PG. Cellular Automata Modeling of Complex Biochemical Systems. In: Meyers R. Encyclopedia of Complexity and Systems Science. Springer, New York, NY. 2009.
- Hwang M, Garbey M, Berceli SA, Tran-Son-Tay R. Rule-Based Simulation of Multi-Cellular Biological Systems-A Review of Modeling Techniques. Cell Mol Bioeng. 2009; 2:285-94.
- Hernando JB, Gómez RM, Lantada AD. Modeling Living Cells within Microfluidic Systems Using Cellular Automata Models. Sci Rep. 2019: 9:14886.
- Xu ZJ, Yang J, Liu GP, Wang M, Huang ZD. A New Method for Visual SARS DNA Sequences Analysis. J Biomed Eng 2006; 23: 734-8.
- Liu GP, Yang J, Xu ZJ, Wang M, Huang ZD. Further Analysis and Study Based on a Visualized Method for SARS RNA Sequences. J Biomed Eng. 2007; 24: 26-31.
- Poplin R, Chang PC, Alexander D, Schwartz S, Colthurst T, K Alexander, et al. Creating a universal SNP and small-indel variant caller using deep neural networks. Nat Biotechnol. 2018; 36: 983–7.
- Barrett JC, Fry B, Maller J, Daly MJ. Haploview: Analysis and visualization of LD and haplotype maps. Bioinform Appl Note. 2005; 21: 263-5.
- Gros C. Complex and Adaptive Dynamical Systems: A Primer, Springer International Publishing Ltd. 2015.
Citation: Fang L, Wang X, Lai Z, Zhang D, Wu M, Pan Z, et al. (2020) An Extended Analysis of SARS-CoV-2 Using a Nonlinear Dynamics Chaotic Model. J Data Mining Genomics Proteomics 11: 228. doi: 10.35248/2153-0602.20.11.228
Copyright: © 2020 Fang L, et al. This is an open-access article distributed under the terms of the Creative Commons Attribution License, which permits unrestricted use, distribution, and reproduction in any medium, provided the original author and source are credited.