


Indexed In
- CiteFactor
- RefSeek
- Directory of Research Journal Indexing (DRJI)
- Hamdard University
- EBSCO A-Z
- Scholarsteer
- Publons
- Euro Pub
- Google Scholar
Useful Links
Share This Page
Journal Flyer

Open Access Journals
- Agri and Aquaculture
- Biochemistry
- Bioinformatics & Systems Biology
- Business & Management
- Chemistry
- Clinical Sciences
- Engineering
- Food & Nutrition
- General Science
- Genetics & Molecular Biology
- Immunology & Microbiology
- Medical Sciences
- Neuroscience & Psychology
- Nursing & Health Care
- Pharmaceutical Sciences
Research Article - (2021) Volume 9, Issue 7
An Estimation of the Effect of Tax Revenue Collection on the Public Debt in South Africa
Nkosinathi Emmanuel Monamodi* and Ireen ChogaReceived: 27-Jan-2021 Published: 06-Jul-2021, DOI: 10.35248/2315-7844.21.9.296
Abstract
Public debt is the most important economic indicator in such a way that if it is unsustainable, higher interest costs could detriment significant public investments that ensure economic growth. Most of developing economies including South Africa are known to be having unsustainable public debt levels coupled with poor economic growth. Irrespective of governments’ measures to service the public debt, like selling enough bonds, taxpayers end up carrying the debt. Hence, the main objective of this paper is to estimate an empirical effect of tax revenue collection on public debt in South Africa. Public debt is treated as the dependent variable and tax revenue collection as the main independent variable in addition to secondary independent variables such as foreign direct investment, political instability and corruption. This paper uses econometric techniques such as Auto Regressive Distributed Lags (ARDL) and Nonlinear Auto Regressive Distributed Lags (NARDL). This paper finds long and short run negative relationship between the South African tax revenue collection, foreign direct investment and public debt (symmetric relationships). This relationship is statistically significant. This paper also finds positive and negative long run relationship between political instability, corruption and public debt in South Africa (asymmetric). In the short run, a positive relationship between political instability, corruption and public debt is established in this paper (symmetric relationships). Furthermore, this paper established significant short run relationship between corruption and public debt. This paper recommends that government ought to re-channel its expenditure programs by identifying sectors that are more productive (productive expenditures), and invest in them as government would be able to recoup the resources, and consequently generate more income which would possibly be in taxes and/or net received receipts. This would reduce government’s over-reliance on the tax revenue collection to finance both current and capital government expenditures, and also to service its public debt.
Keywords
Tax revenue collection; Public debt; Symmetric; Asymmetric; ARDL; NARDL
Introduction
The two gap model with fiscal gap (three gap models) posits that fiscal limitations are viewed as major setback to growth prospects in developing economies, because of fiscal deficits which consequently lead to government borrowing [1]. Hence, in a situation where the fiscal gap is realized from the government budget limitations where taxes and other financing resources are not enough to finance government current and capital expenditures, borrowing domestically or abroad plays a significant role.
In the South African context, the government tax policy after gaining independence in 1994 has focused on controlling tax avoidance, advancing more prominent consistence and guaranteeing equitable tax system [2]. This is on the grounds that the government mostly depends on tax revenue collection to run its spending and fund its expenditures. All things considered, the collected tax revenue is at times lower than what is expected, and such a distinction could be ascribed to the missing tax revenues and poor tax revenue collection which consequently leads to government having to borrow the difference [3].
Furthermore, South African economy has not been doing well for more than ten years. Hence, Kantor [4] emphasizes that slow economic growth has forced the government to cut down expenditure by reducing public servants’ salaries, over the said period. Among other things, government has been borrowing money at the rate of more than R250 billion a year, due to low government revenue because of slow economic growth (National Treasury, 2019). This has led South Africa to incur more than R3 trillion net debt, as in August, 2019 [4]. The main sources of this debt is the effect of the global financial crisis in 2007 to 2009 and redemption of state owned enterprises (SOE’s) that are now classified as nation’s greatest liability, as far as the public finances are concerned [5].
The South African government responded by expanding and increasing expenditure to support economy. Kantor [4] further points out that this strategy only contributed significantly in the short term, but due to lack of application of a temporary stimulus, growth on the public spending was determined by an increasing better-paid public service. This approach was implemented on the basis that it was hoped that it would be affordable if growth had returned to pre-crisis levels, which never happened. Furthermore, the government did not respond in time to declining economic growth which led to large and persistent gap between expenditure and revenue. That is, the gap was/is filled by extensive borrowing. Furthermore, South Africa has recently been a country with corrupt administration which obviously compromised public policies and finances, and consequently led to the unstable political atmosphere (political instability) in South Africa.
In light of the aforementioned facts regarding South African government debt, this study aims to test whether tax revenue collection is competitive enough to help reducing the government inclination on borrowing, since borrowing comes as the consequence of not having enough government revenue to finance public expenditure and infrastructural investments. Furthermore, there are studies that have investigated the effect of tax revenue collection and the associating macroeconomic variables on public debt in South Africa, but there is limited evidence on the empirical evaluation of the effect of tax revenue collection on the public debt.
It is also of great interest to note that these studies have been subjected to linearity (symmetric) assumption which raises concerns about the credibility of the obtained findings, given the recent developments in South African economic policies, and institutional transitions. This assists the case for possible asymmetric (nonlinear) relationship between public debt and the associating macroeconomic variables, which has not yet been explored by the previous studies. Hence, the objectives of this study are to estimate an empirical effect of tax revenue collection on the public debt, investigate the effect of FDI, corruption and political instability on public debt in South Africa, test for the possible asymmetric (nonlinear) effect of tax revenue collection and the associating variables on the public debt and articulate cognitive policy recommendations, based on the policy implications to be emanated from the findings of this study.
Literature Review
Theoretical framework on public debt and tax revenue collection
Classical economists' theory for public debt: Classical economists saw public debt as a capital injection to be utilized for the investment’s production as opposed to the consumption by consumers [6]. This suggested that government expenditure ought not to be financed by any method of borrowing irrespective of the circumstances at that time. That is, public debt ought to be successfully managed promptly. The concern was the chance of the limitations that monetary policy may experience because of the structure and the size of the public debt. Governments view borrowing as an option for taxes, consequently permitting expenditure to increase without corresponding complementary increase in the tax rates and/or revenues [7-10].
According to Kneebone and Mckenzie, the classical theory is disadvantaged mostly on two grounds. Firstly, every government spending is not generally unproductive, thus public borrowing may not be consistently viewed as a burden on the economy and also, the traditional view with respect to the shifting of the debt, is not right. The real debt must be borne in the period where public expenditure has been realized through government borrowing program since resources are not pulled back from private use and put into public projects just in this period. There is no burden of the fundamental burden to the future generations. Future generation not just inherits liabilities of the payment of interest and principal from the current generation but also inherits assets as the privilege of accepting the interest and the principal on the payment side alongside interest and principal on the receipts side belong to the same generation; there is no between generations transfer but a transfer within the same generation.
The classical economists' viewpoint gives off an impression of being unfavourable to public borrowing. Dedicated to the rule of "laissez-faire" and the regulatory activities of market forces, the classic economists credited to the state just the role of guaranteeing the smooth continuous economic interactions, public authorities not being permitted to intervene in the economy. Contending that public expenditure are ineffective, corresponding to the primary assignments embraced by the state (public order, national defence and discretionary relations), and that assets are overseen all the more inefficiently in the public sector contrasted with the private one, the classical economists blamed state indebtedness about the fact that it mutilates private capital from its productive capacity to non-productive expenditures, hence, influencing the accumulation (and thus stock) of capital and the growth and development of the economy in general.
Keynesian theory for public debt: Contrary to the viewpoint of classical economists on public debt, Keynes stipulates that high debt levels cause an increase in taxes, which nullifies beneficial effects of public expenditure by discouraging investment, decreasing private consumption, and decreasing both employment and growth rate of the economy. Nevertheless, at moderate levels, public debt may foster economic growth [11]. Government can utilize the formation debt for profitable investment that could increase national output and invigorate economic growth. On the off chance that public debt is coordinated else how, it may result into certain difficulties. For example, an increase in government expenditure fills the domestic economic activity and crowds in private investment [12]. As hypothesized by closed economy theory of Keynesian, an increment in government expenditure is related to higher national output, which prompts employment [13]. In any case, the funds accessible for investment might be crowded out by an increase in government expenditure. The necessity to fill the saving-investment gap as proposed by the Keynesian paradigm is foreign investment or foreign aid [14]. Disadvantages for the Keynesian theory for public debt among others include the following:
• Borrowing causes higher interest rates and financial crowding out: Keynesian economics supported increasing budget deficit in recession. However, it is contended that this causes crowding out. For government to obtain more borrowing, the interest rate on bonds rises. With higher interest rates, this disheartens investment by the private sector.
• Resource crowding out: In the event that the government borrows to fund higher investment, the government is borrowing from the private sector and consequently, the private sector has less resource to back up private sector investment.
• Inflation: An issue of expansionary fiscal policy is that it frequently comes past the point when the economy is recovering anyway and hence, it causes inflation.
• If the government pursue expansionary fiscal policy, for example, cutting taxes financed by borrowing, then people will not spend the tax cut on the grounds that they believe that taxes will rise later on (future) to take care of the debt, hence, expansionary fiscal policy has no effect.
• Encourages large governments: In recession, governments tend to increase spending, however, after recession government spending remains prompting high tax and spend systems. Friedman [15] joked “nothing was permanent as a temporary government program". Government spending projects might be intended for the short term, yet once started it makes amazing political pressure groups that campaign the government to clutch them.
As to economic impacts of public debt, the Keynesian view outlines on a very basic level from that of the classical economists, as public borrowing ceases to be blamed for its harmful outcomes, and is proved, despite what might be expected, in the closer view, its commitment to the smooth functioning (without significant disequilibrium) of the economy. Two significant contentions support this difference in view.
First, by tolerating the augmentation of the size of the government, public expenditure (at the subsidizing of which public debt contributes) ceases to represent, completely, conclusive and unrecoverable consumption of resources, adversely influencing the national wealth and the prosperity of the general economy. The contribution of public authorities in value adding activities (public works, which are suggested by Keynes) grants, in contrary, to evade negative impacts (disadvantages) and promotes economic growth and development. Secondly, the re-evaluation of the role appointed to public authorities, in the feeling of assuming the undertaking of countering upsetting economic and social phenomena, gives new implications to public borrowing, as methods of intervention to address disequilibrium and guarantee an upward development of the economy.
From this view, it appears to be applicable to feature the effect doled out to public indebtedness by certain adepts of the Keynesianism in structuring demand side fiscal policies for re-launching the economy in recession or animating balanced economic growth. Roused by the real effects of the global economic crisis of 1929 to 1933 and dependent on the broad theoretical development of Keynes, such policies propose the ongoing engagements with the state, through its financial methods, in supporting economic recuperation and battling unemployment, in the midst of recession, or in quickening the rate of economic growth, when it is excessively slow or the economy is stale. More explicitly, measures that are embraced pointed basically at increasing public consumption or investment spending, without barring, however, tax measures (tax cuts, tax exceptions, and so forth) [16] such measures help in increasing the total demand and, hence, animate the increasing of the supply goods and services, the GDP growth and employment.
Frequently, such measures include tolerating irregular characteristics between lower level ordinary budget resources (mostly taxes) and a higher level of budget expenditure, for example tolerating budget deficits which are financed, alongside other exceptional resources, through public borrowing prompting higher public debt. In spite of the fact that, in the view on some Keynesians, inflationary currency issue is not to be evaded, public indebtedness would permit, furthermore, getting along this way into the economic circulation the unused revenue of certain social classifications, in particular those savings not emerged in investments, so as to back public spending. On these grounds, public debt seems to be a vital apparatus to guarantee the decent economic growth, according to Keynesian view.
Although, generally, the Keynesian view allocates positive implications to public borrowing, its utilization is dependent upon strict limits. Such limits result from the "controlled" promotion of budget deficits, just in times of economic recession or stagnation, without tolerating them in times of expansion (to be permanent). In this regard, it gives off an impression of being relevant to the precise deficit theory established by Beveridge, in light of Keynes' view that despite the fact that it ought to be conceded that "escaping the crisis depends strictly on public loans to back an increment in public spending, and thusly a budget deficit", after the deteriorating or declining economy is re-launched the public budget should bounce back to equilibrium. At his turn, Duverger said that "the budget deficit must cease when the full employment is realized" [17].
Decreasing budget deficits and bouncing back to budget positive balances are, actually, conceivable correctly due to state's activities, bringing about increased production, incomes and thus fiscal resources. In an idealistic manner, Keynes said in such manner that it is sufficient "to manage unemployment, on the grounds that the budget will deal with itself, debt will decrease itself” [18].
The two gap model with fiscal gap (Three gap model)
From the spirit of Chinery and Strout on the two gap model, Bacha augmented the two gap model by including the fiscal gap, due to the fact that fiscal limitations are viewed as a major disadvantage to the growth prospects of developing economies, because of fiscal deficits which consequently lead to the significant borrowing by the government. Bacha derived the fiscal gap from government budget limitations where the taxes and other financing sources are not enough to finance expenditures. Borrowing from abroad in such instances plays a very important role in financing government expenditures. Furthermore, Barro on the theory of public spending, taxation and debt adds that government should finance temporary shocks by debt whereas the permanent shocks in the economy should be financed by taxation.
The existence of a fiscal gap limits government efforts to stimulate private investment as a result of debt service and excessive domestic borrowing which crowds out private sector investment. Conversely, if a more noteworthy level of foreign aid is as loans and not grants, it might have adverse impacts on domestic savings funds, foreign exchange and fiscal gaps over the long run and for the macroeconomic performance in general. Hence, high debt service brings about unreasonable pressure on foreign currency and government revenue in general. Hence, asserts that a loan aid inflow may fill the trade gap today, yet requires a faster rate of export development later on for the country to get autonomous of foreign inflows [19].
Furthermore, high debt service payments have negative implications on the import capacity of the government and prompts declining government investment, particularly in the areas of infrastructure, education and health care facilities. Constrained public investment in infrastructure and social services lessen the capacity of the economy to produce, and subsequently brings about low economic growth over the long run.
The vision of Adam Smith is pertinent to this view, one of the arguments he advances to substantiate the rejection of the state's entitlement to acquire debt being that indebtedness defers the normal progress of a country towards wealth and prosperity since, in this manner, resources that would get productive goals in the private sector are occupied by the state to cover its ineffective expenditure, in this way being squandered with no expectation of future reproduction.
The impacts of contracting public loans as far as capital accumulation (and consequently, long run economic growth) are viewed as much more detrimental than those of taxes, since public borrowing prompts the decrease of existing production capacities through the depravity of some segment of the yearly production which had before been bound for the support of productive labor towards that of unproductive labor [20]. The negative consequences on the accumulation of productive capital in the economy are likewise affirmed by Ricardo who expresses that when, for the costs of a year's war, twenty millions are raised through a loan, it is the twenty millions which are pulled back from the productive capital of the country.
Notably, fiscal constraint possibly applies when the inflation rate begins from some increasing threshold and reaches another threshold, producing a hyperinflation circumstance. For this situation, additional increments in the inflation rate are related with unemployment and with decreased rates of savings and investment.
Empirical literature
De Wet AH, et al. explored the South African tax mix and economic growth [21]. Time series data between 1969 and 2003 was used on variables such as government expenditure, direct and indirect taxes, and real GDP growth rate. Dummy variables for isolation (before and after 1994) and recession were also incorporated in the model, and VECM was used as an estimation method. The results indicated that direct taxes revenues and government expenditures affected economic growth negatively. The study further emphasized that this was because of a significant increase in the size of the government after 1994. The results are not in line with Keynesian theory which advocates for government intervention through taxation and expenditure, but support the critics of the models for political economy in terms of the increased size of the government impacting public finances negatively which affect economic growth negatively at the later stage.
Oche MO, et al. investigated the key variables that drive government debt [22] in South Africa between 1994 and 2017. The study revealed that there is a long run relationship between government expenditure, real GDP, inflation, real interest rate and government debt. Auto Regressive Distributive Lags (ARDL) method was used. It was also found that government expenditure, real GDP and real interest rates were the key drivers of government debt in South Africa. The study also discovered that economic growth and inflation were the only variables that affected the government debt negatively. Same results on inflation driving public debt negatively were realized by the study of Oche et al. [23]. That used Vector Error Correction Model (VECM) to investigate the impact of public debt on foreign direct investment (FDI) in South Africa between 1983 and 2013. The study also indicated that there was a positive and significant relationship between interest rate, FDI and public debt respectively.
Ncanywa T, et al. estimated the impact public debt on public investment and economic growth using Autoregressive distributive lags (ARDL), Granger causality, impulse response functions and variance decomposition. The study established long run negative relationship between public debt and investment which consequently prompted an inverse relationship between public debt and economic growth, on an account that investment has a direct relationship with economic growth [24].
The study recommended that a capital scarce economy should be motivated to borrow to actualize more capital. However, the later stage of borrowing marked with high level of public debt will yield inefficient growth. Although the study applied the other method that is being proposed by this study, it still lays the foundation as far as the relationship between public debt and foreign direct investment is concerned. Also, although the study used public investment when this study uses FDI, it is still relevant to be used as the relationship establishment foundation. This is due to the fact most of foreign investors and companies invest in economies that invest in themselves, as emphasized by Oche. Furthermore, this study aims to see whether the nonlinear version of this method can explain this relationship better.
Relying on the above selected empirical studies, there seems to be limited literature on the effect of FDI on public debt. Furthermore, there seems to be no evidence of the exploration of the effect of tax revenue collection, political instability and corruption on public debt. Also, researchers applied linear modeling techniques to obtain the results. This means that the researchers relied upon the linearity assumption. This is a reason for real concern given the increasing literature on the emphasis of nonlinear dynamic structure of macroeconomic data. These nonlinear studies mostly infer that the conventional linear models are not correctly specified. Also, the time period secured by the selected studies envelops various significant political factors and tax policy reforms, which assists the case for possible nonlinear relationships between the time series of economic, financing, structural and institutional variables. In this regard, this study aims to contribute in literature by exploring the empirical effect of tax revenue collection, FDI, political instability and corruption on public debt in South Africa. This study also intends to contribute new information in literature on testing for the best approach between linear Auto Regression Distributed Lags (ARDL) and Nonlinear Auto Regression Distributed Lags (NARDL) that can explain the relationship between public debt and the selected independent variables better.
Methodology
This paper adopts the empirical model by Simbachawene [25]. Whose paper investigated the potential tax revenue determinants in Tanzania. The following is the model of the study;
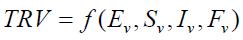 (1)
(1)
Where TRV is the tax revenue measured by tax revenue-GDP ratio, E, S, I and F denotes economic, structural, institutional and financing variables respectively. v is the abbreviation letter for variables.
This paper modifies the Simbachawene [25] empirical model by incorporating public debt (PDT) as one the government sector financing variable, in addition to tax revenue collection (TRV). Furthermore, to suit the objectives of this paper, foreign direct investment (FDI) is chosen as a proxy variable for structural variable whereas political instability (POI) and corruption (COR) are chosen as proxy variables for institutional variables. Incorporating these the log of the chosen variables and treating public debt as the dependent variable, and including the error term (εt) to account for the implicit factors affecting public debt, the model presented by equation 1 can be rearranged as;
 (2)
(2)
The model presented by equation 2 simply implies that this paper models South African public debt as the function of the South African tax revenue, net foreign direct investment inflows, political instability and corruption in general by public servants and/or politicians.
Yearly data for the variables shown in the empirical model presented by equation 2 is sourced from the South African Reserve Bank (SARB), the Organization for Economic Cooperation and Development (OECD), the International Monetary Funds (IFM) and the World Bank, for the period of 1985 to 2019.
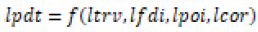
This paper utilizes the Auto Regression Distributed Lags (ARDL) method, for modeling linear relationship between the dependent and independent variables of this study. Compared to the empirical studies that applied linear modeling methods in South Africa, utilization of ARDL that is originally developed by has few advantages [26]. The following are the advantages; ARDL model produces consistent and robust results for both short and long run relationship, even in cases when the sample size is small, and to test for short and long run relationship, variables can be integrated to the order of 0,1 or the combination of both. That is, variables that are integrated to the order of 2 are not allowed. Hence, the following equation presents the ARDL model to be estimated to determine the long and short run effect of tax revenue collection and the selected variables on public debt in South Africa.
 (3)
(3)
Where LPDT is the log of public debt, LTRV the log of tax revenue, LFDI the log of foreign direct investment, LPOI the log of political instability and LCOR the log of corruption. Furthermore, operator denotes difference, ü short run coefficients, long run coefficients and lags order.
Results
Following the objective of testing for the possibility of nonlinear relationship between dependent and independent variables of this paper, nonlinear ARDL (NARDL) method is utilized. NARDL basically decomposes fluctuations of the variables under study into the partial sums [27]. Indicate that if time series’ positive and negative components are cointegrated, then there exist a secret cointegration and linear cointegration is a particular example of the secret cointegration which form a part of nonlinear cointegration. That is, Shin et al. developed a nonlinear ARDL method by incorporating a decomposed partial sum components.
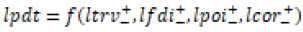
NARDL presents significant advantages over the current modelling methods, for example, the Error Correction Model (ECM), the threshold ECM, the Markov-switching ECM and the Smooth Transition ECM) in modelling jointly the cointegration dynamics and asymmetries. Other than its estimation simplicity, the NARDL model gives more prominent flexibility in relaxing the assumption that the time series ought to be integrated the same order, in spite of the ECM which is authoritative in this sense. Furthermore, NARDL allows one to accurately distinguish between the absence of cointegration, linear cointegration and nonlinear cointegration [28]. Hence, the following equation the NARDL model to be estimated to determine the long and short run effect of tax revenue collection and the selected variables on public debt in South Africa;
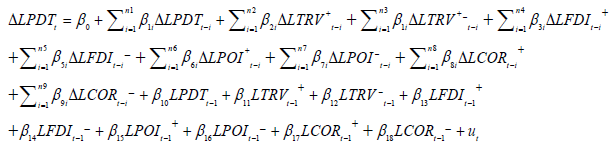 (4)
(4)
Where LPDT is the log of public debt, LTRV the log of tax revenue, LFDI the log of foreign direct investment, LPOI the log of political instability index, and LCOR the log of corruption index. Furthermore, operator denotes difference, ü short run coefficients, long run coefficients, lags order and measures the short and long run impacts of increase/decrease in the tax revenue collection and the selected macroeconomic variables on public debt.
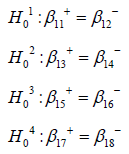
Testing for the possibility of the long and short run nonlinear relationship between public debt and tax revenue collection as well as the selected independent variables, requires the utilization of asymmetric effects test (Wald test) on both long and short run coefficients. Hence, the following are the null hypotheses to be tested (long run coefficients);
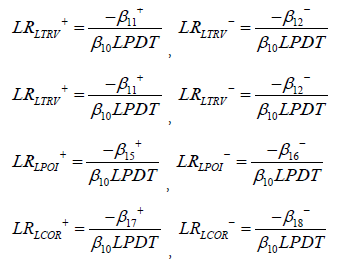
Where the positive and negative long run coefficients are calculated as;
Similarly, the following are the null hypotheses to be tested for short run coefficients;
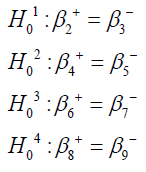
Failure to reject the null hypothesis on either long or short run symmetry implies that ARDL (linear) model should be used to examine the long and/or short run relationship between public debt and the selected independent variable. Otherwise, the rejecting the null hypothesis of either the long or short run symmetry implies that NARDL (nonlinear) should be used to analyze the relationship between public debt and the selected independent variables.
Lastly, to diagnose the ARDL and NARDL models to be estimated in this paper, this paper utilizes [29]. Regression error specification test (coefficients stability test) to examine the specification of the parameters. Furthermore, this paper makes use of residuals diagnostic tests such as normality, serial correlation and heteroscedasticity test, to diagnose the residuals to be estimated.
Empirical analysis
The first step to carry out the BDS and White linearity tests to determine the nature of the time series of all key variables of this study. Hence, presents the BDS and White linearity test results (Table 1).
| Test | Variables | ||||
|---|---|---|---|---|---|
| LPDT | LTRV | LFDI | LPOI | LCOR | |
| BDS | N | N | N | N | N |
| White | L | L | L | N | N |
Source: Author’s own illustration using the BDS and White linearity test results.
Table 1: BDS and white linearity test results.
The results presented in Table 1 indicate that the BDS linearity test results declare all key variables of this paper to be having nonlinearity characteristics, when the White linearity test results declare LPDT, LTRV and LFDI to be having linearity characteristics, and LPOI as well as LCOR to be having nonlinearity characteristics. In this regard, this paper concludes that LPDT, LTRV and LFDI have both linearity and nonlinearity characteristics, whereas LPOI and LCOR have strictly nonlinearity characteristics. Furthermore, results presented in Table 1 are important in such a way that they give hints on the type of methodology that should be used to analyze the relationship between dependent variables and the respective independent variables. Shortly, the results hint that the relationship between public debt, tax revenue collection and foreign direct investment can be captured by either linear or nonlinear method (ARDL or NARDL). This is on the basis that LPDT, LTRV and LFDI have both linear and nonlinear characteristics. On the other hand, the relationship between LPDT, LPOI and LCOR can only be captured by nonlinear method (NARDL). This is on the basis that LPOI and LCOR have only nonlinear characteristics, though LPDT has both linear and nonlinear characteristics. However, to make the final decision on which method should be used to analyze the relationship between dependent variables and the respective independent variables, the NARDL procedure called ‘testing for asymmetric effects’ on both long and short run relationships will be carried out. As discussed in the previous section, if the long or short run relationship shows the presence of asymmetry (nonlinearity), then NARDL method should be used to analyze the relationship. Otherwise, if there is absence of asymmetry (symmetry), then ARDL (linear) method should be used to analyze the relationship, no matter the results of linearity tests.
After testing for linearity on the key variables of this paper, it is important to determine the order of integration on all key variables. To account for the ARDL methodology, this paper makes use of the Dickey Fuller GLS and Ng-Perron unit root tests to determine the order of integration on all the key variables. Similarly for the NARDL methodology, this paper makes use of testing the unit root with drift hypothesis against nonlinear trend stationary and nonparametric tests for unit roots and co-integration [30,31]. Nonlinear unit root tests to determine the order of integration on all the key variables. Hence, Tables 2 and 3 present the results for Dickey Fuller-GLS and Ng-Perron unit root tests at level and 1st difference respectively.
| Level | 1st Difference | |||
|---|---|---|---|---|
| With Intercept and Trend | With Intercept and Trend | |||
| Variable | Statistic | P-Value | Statistic | P-Value |
| LPDT | -3.190996 | 0.0031* | N/A | N/A |
| LTRV | -1.43754 | 0.1600 | -5.085395 | 0.0000* |
| LFDI | -1.380191 | 0.1768 | -4.957796 | 0.0000* |
| LPOI | -1.9462047 | 0.0602*** | N/A | N/A |
| LCOR | -1.917235 | 0.0645*** | N/A | N/A |
Source: Author’s own calculations using E-views 10 Software
Table 2: Dickey Fuller-GLS unit root test results on the key variables at level and 1st difference.
| Intercept and Trend | ||||||||
|---|---|---|---|---|---|---|---|---|
| Level | 1st Difference | |||||||
| Variable | Mza | Mzt | MSB | MPT | Mza | Mzt | MSB | MPT |
| LPDT | -12.261 | -2.4621 | 0.20080 | 7.50659 | -15.5363 *** |
-2.78376 *** |
0.17918 *** |
5.88518 *** |
| LTRV | -5.0965 | -1.4740 | 0.28922 | 17.3208 | -16.3997 *** |
-2.74917 *** |
0.16764 *** |
6.22327 *** |
| LFDI | -3.7055 | -1.2348 | 0.33322 | 22.7312 | -15.3545 *** |
-2.77047 *** |
0.18043 *** |
5.93658 *** |
| LPOI | -6.1481 | -1.7075 | 0.2777 | 14.7836 | -15.863 *** |
-2.8146 *** |
0.1774 *** |
5.7545 *** |
| LCOR | -8.7069 | -2.0195 | 0.2319 | 10.6946 | -15.377 *** |
-2.7722 *** |
0.1803 *** |
5.9293 *** |
Source: Author’s own calculations using E-views 10 Software
Table 3: Ng-Perron unit root test results on the key variables at level and 1st difference.
The results on the Dickey Fuller GLS unit root test in Table 2 show that the null hypothesis that variables LPDT LPOI and LCOR are non-stationary is rejected under ‘intercept and trend’ model specification. Rejection of the null hypothesis is realized on the basis that the probability value of the test statistic is less that the desired level of significance. Hence, the order of integration for variables LPDT, LPOI and LCOR is 0. Furthermore, Table 2 shows that the null hypothesis that variables LTRV and LFDI are non-stationary is rejected at first difference. Hence, the order of integration for variables LTRV and LFDI is 1.
Similarly, Table 3 presents the results for the Ng-Perron unit root test on the key variables of this paper at level and first difference respectively (Table 3).
The results on the Ng-Perron unit root test at level in Table 3 show that the null hypothesis that the key variables of this paper are nonstationary is not rejected at level. This is on the basis that the Ng- Perron test statistics are not significant at any level of significance. Furthermore, Table 3 shows that the null hypothesis that the key variables of this paper are non-stationary is rejected at 10 percent level of significance under at 1st difference. This is on the basis that the Ng-Perron test statistics are significant at 10 percent level of significance. Thus, it can be concluded that LPDT, LTRV, LFDI, LPOI and LCOR are integrated to the order of 1. Similarly, to account for the NARDL methodology, Tables 4 and 5 present the results for Birens and Breitung nonlinear unit root tests (Table 4).
| Level | 1st Difference | |
|---|---|---|
| Variables | T Statistics | T Statistics |
| LPDT | -3.677*** | N/A |
| LTRV | -1.977 | -5.014** |
| LFDI | -0.548 | -3.989** |
| LPOI | -2.204 | -5.863** |
| LCOR | -0.933 | -4.266** |
Source: Author’s own calculations using EasyReg Software
Table 4: Bierens Nonlinear unit root test results at level with nonlinear trend.
| Level | 1st Difference | |
|---|---|---|
| Variables | Test Statistic | Test Statistic |
| LPDT | 0.01627 | 0.001030** |
| LTRV | 0.09889 | 0.001270** |
| LFDI | 0.02226 | 0.005530** |
| LPOI | 0.05487 | 0.002550** |
| LCOR | 0.08434 | 0.005347** |
Source: Author’s own calculations using EasyReg Software
Table 5: Breitung nonlinear unit root test results at level and 1st difference with nonlinear trend.
The results in Table 4 show that only LPDT is nonlinearly stationary at level, using 10 percent level of significance. This is on the basis that the test statistic of -3.677 is less than critical statistic of -3.64. Furthermore, Table 4 shows that variables LTRV, LFDI, LPOI and LCOR are nonlinearly stationary in their first difference form, at 5 percent level of significance. This is on the basis that the variables’ test statistics are less than critical statistics at 5 level of significance. Therefore, Bierens (1997) nonlinear unit root test declare the order of integration for LPDT as 0, and for LTRV, LFDI, LPOI and LCOR as 1 respectively.
Similarly, Table 5 presents the results for the Breitung nonlinear unit root test results for all the key variables of this study at level and first difference respectively.
Notes: Critical values for the test statistic at 5 and 10 percent level of significance are 0.01004 and 0.01435 respectively (Table 5).
The results in Table 5 show that LPDT, LTRV, LFDI, LPOI and LCOR are not nonlinearly stationary at level. This is on the basis that the null hypothesis that these variables are nonlinear nonstationary process is not rejected at any level of significance, since the variables’ test statistics are greater than the critical statistics at both 5 and 10 percent level of significance. Furthermore, Table 5 shows that LPDT, LTRV, LFDI, LPOI and LCOR are nonlinearly stationary at first difference, when using 5 percent level of significance. This is on the basis that test statistics are less than the critical statistic of 5 percent. Hence, Breitung nonlinear unit root test declare the order of integration for all key variables of this study to be 1 respectively.
Having determined the order of integration on all key variables, the next step involves selecting the optimal lag length for both ARDL and NARDL models. Hence, this paper applies the Akaike Information Criterion (AIC), Schwarz Information Criterion (SIC), and Hannah Quinn Criterion (HQIC) information criteria. Table 6 presents the values for the afore-mentioned information criteria (Table 6).
| Lag | LogL | LR | FPE | AIC | SIC | HQIC |
|---|---|---|---|---|---|---|
| 0 | 8.605993 | NA | 5.53e-07 | -0.218545 | -0.0008199 | -0.142253 |
| 1 | 168.1115 | 261.0090* | 1.63e-10* | -8.370392* | -7.009930* | -7.912638* |
| 2 | 186.9492 | 25.11698 | 2.64e-10 | -7.996921 | -5.502742 | -7.157706 |
Source: Author’s own calculations using E-views 10 Software
Table 6: Lag length selection criteria.
Table 6 indicates that all information criteria selects lag 1, therefore, lag 1 is chosen as an optimal maximum lag. Hence, the ARDL and NARDL model to be estimated is ARDL (1, 1, 1, 1, 1) and NARDL (1,1,1,1,1,1,1,1,1) if the lags would be permitted to be fixed across all the variables, and positive as well as negative partial decompositions of the independent variables respectively. Having done this, Table 7 presents the bound test results for both ARDL (1,1,1,1,1) and NARDL (1,1,1,1,1,1,1,1,1) model (Table 7).
| Model | Calculated F-Statistic | Conclusion |
|---|---|---|
 |
4.7557* | Symmetric Cointegration |
 |
4.687310* | Asymmetric Cointegration |
Source: Author’s own calculations using E-views 10 Software
Table 7: ARDL/NARDL bound test results.
The results presented in Table 7 show that there is symmetric (ARDL) and asymmetric (NARDL) cointegration at 1 percent level of significance. This is due to the fact that calculated F statistic for ARDL and NARDL model is greater than the critical F statistic at the upper limit/bound (I (1)), at all levels of significance. Evidence of both symmetric and asymmetric cointegration as per bound test results implies testing the long and short run relationships established by NARDL methodology for asymmetric effects. Hence, Table 8 presents long and short run asymmetric effects results (Table 8).
| Asymmetric Null Hypothesis |
Long Run | Short Run | ||
|---|---|---|---|---|
| t Statistic | P (t Statistic) | t Statistic | P (t Statistic) | |
| -0.289705 | 0.7760 | -0.519157 | 0.6082 | |
| -0.295922 | 0.7713 | 0.420047 | 0.6780 | |
| 5.453846 | 0.0001* | -1.082513 | 0.2894 | |
| -12.93787 | 0.0001* | -0.136518 | 0.8925 | |
Source: Author’s own calculations using E-views 10 Software
Table 8: Long and short run asymmetric affects results.
The results presented in Table 8 show that only the long run relationship between political instability, corruption and public debt show the evidence of asymmetric effect. That is, in the long run, the relationship between tax revenue collection, foreign direct investment and public debt is best captured within the ARDL framework, whereas the relationship between political instability, corruption and public debt is best captured within the NARDL framework. In the short run, the results presented in Table 8 show that there is no evidence of asymmetric effects on the relationship between tax revenue collection, foreign direct investment, political instability, corruption and public debt. That is, all the short run relationships established in this paper are best captured within the ARDL framework. Thus, Table 9 and Table 10 present the long and short run coefficients established by the estimated ARDL and NARDL model respectively (Table 9).
| Regressor | Coefficient | St. Error | t-Statistic | Probability V. |
|---|---|---|---|---|
| Constant (ARDL) | 15.56924 | 3.262196 | 4.772627 | 0.0001* |
| LTRV (-1) | -3.781660 | 0.978003 | -3.866716 | 0.0007* |
| LFDI (-1) | -0.005845 | 0.001605 | -3.642267 | 0.0013* |
| Constant (NARDL) | 3.666148 | 0.226547 | 16.18274 | 0.0000* |
| LPDT (-1) | -0.682035 | 0.127255 | -5.359592 | 0.0000* |
| LPOI POS (-1) | 0.365622 | 0.175070 | 2.088438 | 0.0542*** |
| LPOI NEG (-1) | 1.087278 | 0.483424 | 2.249121 | 0.0400** |
| LCOR POS (-1) | 0.029700 | 0.006390 | 4.648200 | 0.0001* |
| LCOR NEG (-1) | -0.522833 | 0.218823 | -2.389302 | 0.0305** |
| Model | R Squared | P (F-Stat.) |
|---|---|---|
| ARDL (1,1,1,1,1) | 0.658234 | 0.000631* |
| NARDL (1,1,1,1,1,1,1,1,1) | 0.8296 | 0.0034* |
POS/NEG denotes independent variables’ positive and negative decompositions respectively
Source: Author’s own calculations using E-views 10 Software
Table 9: ARDL and NARDL long run coefficients’ estimates.
In the long run, 1 percent increase in tax revenue collection significantly leads to 3.7817 percent decrease in public debt, holding all other factors constant. This findings support the hypotheses hypothesized by the three-gap (fiscal gap) model and the debt service in the tax competition model of fiscal policy. Shortly, these models hypothesize that economies with less tax revenue collection (especially developing economies) may incur higher levels debt. Gupta got the same results on the case study of developing economies using POLS. Hence, the economic implication raised here is that South Africa would decrease its inclination on borrowing only if it would improve its tax revenue.
Furthermore, the results in Table 9 show that 1 percent increase in foreign direct investment significantly leads to 0.0058 decreases in public debt, holding all other factors constant. This revelation is simply in line with the notion emphasized by the public economic theory perspective which infers that an increase in tax revenue collection leads to less inclination on borrowing, hence, making a favorable atmosphere for domestic savings and foreign direct investment in the economy [32]. Got the same results in the case study of 46 developing economies using POLS method? The economic implication raised here is that if South Africa is to record an increase in foreign direct investment inflows, then it must decrease its inclination on borrowing. However, that would only be materialized only if there would be an improvement in the collection of tax revenue.
In terms of political instability and corruption, the results in Table 9 show that increase coefficients for political instability and corruption are 0.365622 and 0.029702 respectively, and both coefficients are statistically significant. Furthermore, the decrease coefficients for political instability and corruption are 1.087278 and -0.522833, and these coefficients are statistically significant. Therefore, in the long run, 1 percent increases in political instability and corruption result to 0.5361 and 0.0435 percent increase in public debt respectively. However, 1 percent decrease in political instability and corruption will result to 1.5942 and 0.7666 decrease in public debt respectively in South Africa. These results support the hypotheses hypothesized by the fiscal illusion theory and political economy models. Shortly, these hypotheses infer that an increase in political instability delay emergency policy reforms necessary to respond to contrasting economy and structural or institutional harmful imperfection, and an increase in corrupt activities lead to increasing unproductive public expenditures, inefficient tax revenue collection and debt accumulation.
Similar results were obtained by Crivelli, Palil, Mustapha, Rimmer and Ellis, Schansberg studies [33-36] respectively. However, using POLS Ellis and found out that political instability and corruption was not largely significant in explaining the public debt in 52 developing economies. The economic implication here is that an increase and a decrease in political instability and corruption in South Africa lead to an increase and a decrease in the South African public debt.
The coefficient of determination (R Squared) is 65.82 and 82.96 percent for the estimated ARDL and NARDL models. This implies that 65.82 and 82.96 percent of deviation in the public debt is explained the deviations on tax revenue collection and foreign direct investment as well as positive and negative partial decompositions of political instability and corruption respectively. These models are reasonably fitted since the 65.87 and 82.96 percent is greater than 50 percent, and the predictor variables are jointly significant since the calculated F statistics for both estimated ARDL and NARDL models are statistically significant at 1, 5 and 10 percent level of significance.
The results for short run asymmetric effects test showed no evidence of asymmetric effects on all the short run relationships established in this paper. This means that all the short run relationships established in this paper are best captured in the ARDL model. Hence, Table 10 presents the short run coefficients’ estimates derived by the model ARDL (1,1,1,1,1) (Table 10).
In the short run, there is negative and significant relationship between tax revenue collection, foreign direct investment and public debt. Hence, one percent increase in tax revenue collection and foreign direct investment leads to 4.3422 and 0.5843 percent decrease in public debt respectively. The findings on the short run relationship between tax revenue collection and public debt support the hypotheses hypothesized by the three-gap (fiscal gap) model and the debt service in the tax competition model of fiscal policy, like in the long run [37]. Got the same results on the case study of Jordan using multiple linear regressions? Hence, the economic implication raised here is that South Africa would decrease its inclination on borrowing by 4.37 percent only if it would improve its tax revenue by 1 percent in the short term. Furthermore, the results in Table 10 show that 1 percent increase in foreign direct investment significantly leads to 0.5843 decreases in public debt, holding all other factors constant. This revelation is simply in line with the notion emphasized by the public economic theory perspective which infers that an increase in tax revenue collection leads to less inclination on borrowing, hence, making a favorable atmosphere for domestic savings and foreign direct investment in the economy. Swammy got the same results in the case study of 46 developing economies using POLS method. The economic implication raised here is that if South Africa is to record an increase in foreign direct investment inflows, then it must decrease its inclination on borrowing. However, that would only be materialized only if there would be an improvement in the collection of tax revenue.
| Regressor | Coefficient | Standard Error | t-Statistic | Probability V. |
|---|---|---|---|---|
| D (LTRV) | -4.342225 | 2.116601 | -2.051509 | 0.0513*** |
| D (LFDI) | -0.584301 | 0.215410 | -2.712506 | 0.0439** |
| D (LPOI) | 0.007430 | 0.060023 | 0.123784 | 0.9025 |
| D (LCOR) | 0.407886 | 0.103309 | 3.948210 | 0.0006* |
| ECT | -0.871547 | 0.148428 | -5.871837 | 0.0000* |
Source: Author’s own calculations using E-views 10 Software
Table 10: ARDL short run coefficients’ estimates.
Moreover, political instability and corruption have positive relationship to public debt. Hence, 1 percent increase in political instability and corruption leads to 0.0074 and 0.4079 percent increase in public debt respectively. However, only the relationship of corruption and public debt is statistically significant whereas that of political instability and public debt is statistically insignificant.
These results support the hypotheses hypothesized by the fiscal illusion theory and political economy models which infer that severe political instability (in the short or long run) delay emergency policy reforms necessary to respond to contrasting economy and structural or institutional harmful imperfection. Furthermore, the fiscal illusion theory also infers that corrupt activities lead to increasing unproductive public expenditures, inefficient tax revenue collection and debt accumulation. Monte and Cooray A, Dzhumashav R, Scheider [38,39] got the same results, though they found both political instability and corruption to be significantly related to public debt. The economic implication raised here is that the political instability and corruption in South Africa increase the public debt by 0.0074 and 0.4079 percent respectively in the short term; though political instability short term effect on public debt is insignificant.
The error correction term is -0. 8715 and it is statistically significant. This implies that 87.15 percent of disequilibrium in the model is corrected in the period (year), hence, the ARDL error correction model adjusts very fast toward equilibrium steady state. This is satisfactory as 87.15 percent is greater than 50 percent. To check the direction of the established symmetric and asymmetric cointegration, Granger Causality test is undertaken at lag 1, since the optimal lag for the estimated ARDL and NARDL models is 1. Hence, Table 11 presents the results for Granger Causality pairwise test (Table 11).
| Null Hypothesis | Obs | F-Statistic | Probability Value | Conclusion |
|---|---|---|---|---|
| LTRV does not Granger Cause LPDT | 34 | 3.85092 | 0.0333** | Causality |
| LPDT does not Granger Cause LFDI | 34 | 4.30523 | 0.0234** | Causality |
| LPOI POS does not Granger Cause LPDT | 33 | 5.52504 | 0.0097* | Causality |
| LPOI NEG does not Granger Cause LPDT | 33 | 3.60369 | 0.0410** | Causality |
| LCOR POS does not Granger Cause LPDT | 33 | 4.21503 | 0.0042* | Causality |
| LCOR NEG does not Granger Cause LPDT | 33 | 3.00652 | 0.0400** | Causality |
POS/NEG denotes independent variables’ positive and negative decompositions respectively
Source: Author’s own calculations using E-views 10 Software
Table 11: Granger causality pairwise test results.
Using 5 percent level of significance, Table 11 indicates that changes in tax revenue collection affect the changes in the South African public debt. Furthermore, changes in the South African public debt affect foreign direct investment, and positive and negative shocks of political instability as well as positive and negative shocks of corruption affect public debt. Hence, the direction of long run relationship is from tax revenue collection, positive and negative shocks of political instability and corruption to public debt respectively, and from public debt to foreign direct investment.
The results on long run causality between tax revenue and public debt support the hypothesis established by the three gap model which shortly postulates that when the tax revenue collection and other financing resources are not enough to foster both current and capital expenditure, borrowing domestically or internationally becomes an alternative financing route. That is, positive shocks in tax revenue collection lead to minimized inclination on borrowing, and negative shocks in tax revenue collection lead to an increased inclination on borrowing [40]. also got the same sentiments on the granger causality between tax revenue collection and public debt. The economic implications raised here is changes in the South African tax revenue collection affect changes in the South African public debt.
Furthermore, the results for long run causality between public debt and foreign direct investment support the classical economists’ critique on the Keynesian theory for public debt. This is on the basis that the results in Table 9 established negative long run relationship between foreign direct investment and public debt. That is, the established negative shocks on foreign direct investment are due the positive shocks in public debt, since the direction of causality is from public debt to foreign direct investment. Aregbeshola further indicates the same sentiments on the granger causality between public debt and foreign direct investment. The economic implication here is that changes in the South African public debt affect changes in foreign direct investment.
Moreover, Table 11 indicates that an increase and the decrease in political instability and corruption affect the South African public debt respectively. Hence, these causality revelations confirm the hypothesis established by political economy models, which insinuate that severe political instability delay emergency policy reforms necessary to respond to contrasting economy and structural or institutional harmful imperfection. Furthermore, political economy models infer that corrupt activities lead to increasing unproductive public expenditures, inefficient tax revenue collection and debt accumulation. In order to provide possible better policy recommendations in the next section, Table 12 presents the results for Granger causality test between asymmetric components of corruption and political instability, and the symmetric tax revenue collection and foreign direct investment (Table 12).
| Null Hypothesis | Obs | F-Statistic | Probability Value | Conclusion |
|---|---|---|---|---|
| LPOI POS does not Granger Cause LFDI | 33 | 4.36462 | 0.0215** | Causality |
| LPOI NEG does not Granger Cause LTRV | 33 | 3.96631 | 0.0556*** | Causality |
| LTRV does not Granger Cause LPOI NEG | 33 | 4.78172 | 0.0367** | Causality |
| LCOR POS does not Granger Cause LTRV | 33 | 4.43996 | 0.0437** | Causality |
| LCOR POS does not Granger Cause LFDI | 33 | 4.70429 | 0.0381** | Causality |
POS/NEG denotes independent variables’ positive and negative decompositions respectively
Source: Author’s own calculations using E-views 10 Software
Table 12: Granger causality pairwise test results on the symmetric and asymmetric independent variables.
The results presented in Table 12 show that changes in tax revenue collection are affected by the decrease in political instability, and an increase in political instability (bi-directional). Furthermore, changes in foreign direct investment and tax revenue collection are affected by an increase in political instability and corruption respectively.
Shortly, the results on the long run causality between tax revenue collection and an increase in political instability as well as an increase in corruption support the hypothesis established by the opportunistic models of political economy, which emphasizes that positive shocks in political instability may encourage some politicians to serve their own interests (corruption) due to future political or economic power uncertainty caused by political and/or structural instability.
Discussion
Furthermore, the results for long run causality between an increase in corruption and tax revenue collection support the above mentioned models (fully discussed in chapter three) in a sense that governments do not normally collect efficient tax revenue in government administrations that are known to be too corrupt. Consequently, governments find themselves having no option but to borrow to patch up the gap between the generated tax and/ or general government revenue and the budgeted expenditure. Hence, this explain the significant long run causality relationship between an increase in political instability and public debt, and the significant long run causality relationship between an increase in corruption and public debt (Table 11) got the same results. The results in Table 12 further show that an increase in political instability granger cause foreign direct investment. This revelation supports classical economists’ theory which emphasizes that political uncertainty reduce foreign and domestic investors’ confidence, and decrease the potential of both domestic and foreign investment in the economy [41].
Lastly, the statistical and economic inferences made on the estimated ARDL and NARDL model can only be relied upon if residuals diagnostic and coefficients stability tests are passed. Hence, Table 13 presents residuals and coefficients stability tests results (Table 13).
| Model | ARDL (1,1,1,1,1) model | NARDL (1,1,1,1,1,1,1,1,1) model |
|---|---|---|
| Test | Prob. Value (test statistic) | Prob. Value (test statistic) |
| Normality | 0.7107 | 0.7280 |
| Serial Correlation | 0.7902 | 0.5808 |
| Heteroscedasticity | 0.1853 | 0.2879 |
| Ramsey RESET (stability) | 0.7174 | 0.7394 |
Table 13: Residuals and coefficients stability tests results.
Under all the diagnostic tests, the probability value for the test statistics is greater than 1 %, 5% and 10% significance level. This implies that the estimated residuals for ARDL and NARDL model do not suffer from serial correlation and heteroscedasticity, and the residuals are normally distributed. Moreover, the estimated ARDL and NARDL model passed the Ramsey RESET specification test, which means that the estimated coefficients are efficient and robust. Thus, the statistical and economic inferences made in the results of the estimated ARDL and NARDL model can be confidently relied on.
Conclusion
The policy implications raised by this paper are; tax revenue collection and foreign direct investment are negatively and significantly related to public debt, whereas political instability and corruption are both positively and negatively related to public debt in both short and long run. Also, the positive and negative effect of political instability and corruption on public debt is significant in both short and long run. However, on the policy implication raised on the established relationship between tax revenue collection and public debt, South Africa still has a challenge of raising enough government/tax revenue, as established in this paper. Thus, the researcher recommends that government ought to re-channel its expenditure programs by identifying sectors that are more productive (productive expenditures), and invest in them as government would be able to recoup the resources, and consequently generate more income which would possibly be in taxes and/or net received receipts.
Moreover, this paper indicates that the bailouts of state owned enterprises (SOE’s) accounts for larger portion of the South African public debt. Thus, government tends to rely more on tax revenue collection (over-reliance), since these SOE’s are no longer generating income for the government. This is due to maladministration and corruption that have been going on and on in the administration of these enterprises, as also established by this paper. This is supported by the granger causality test results which indicate that long run changes in tax revenue collection and public debt are affected by long run positive and negative shocks in corruption.
In other words, an increase and the decrease in corruption affects tax revenue collection in the long run, which consequently implicates the long run level of public debt (thus putting more pressure on tax revenue), as the granger causality test results also indicate that long run changes in public debt are affected by long run changes in tax revenue collection.
Furthermore, corruption in South Africa has abruptly stirred government policies and SOE’s in such a way that political atmosphere in South African is drastically unstable. This is supported by the granger causality test results which indicate that long run positive and negative shocks of corruption affect positive and negative shocks of political instability. Hence, policy makers have short horizon (uncertainty) when making policy decisions. Lastly, like in any developing economy, political uncertainty and instability have the tendency of affecting the foreign investor’s confidence negatively, thus decreasing the potential of net foreign direct investment inflows. This is further supported by the granger causality test results between long run positive/negative shocks of political instability and long run changes in foreign direct investment, which indicate that an increase and the decrease in political instability granger cause foreign direct investment.
In light of the policy implications indicated above, the researcher recommends that proper leadership and corporate governance styles as well ethical standards should be re-practiced in the South African SOE’s and general government administrations. That is, political patronage should be eliminated as soon as possible. In short, political patronage refers to a situation where comrades/ politically connected people are deployed in government offices and/or public owned enterprises (especially in executive positions) to carry out strategic and operational plans of government in different levels of the state, thus creating conflicts between the ruling party and opposition parties [41].
This practice has manifested itself in such a way that is the cause of leadership deficiency, hence, promoting unethical behaviours such as corruption and abuse of official authority to benefit underserving political loyalists of the ruling party. Elimination of this practice will reduce political instability and/or uncertainty as the right qualifying people would certainly bring about the desired results and/or performance, thus increasing productivity and restore public confidence on the government administrations and SOE’s. That is, the conflicts between the ruling party and opposition parties will not be severe, thus stabilizing political atmosphere at little bit if not much.
Furthermore, elimination of political patronage should be coupled with clear and strict ethical standards that show clear and harsh consequences for the perpetrators found to be involved in any opposite conducts, thus promoting accountability. In this sense, good and ethical leadership will be born once again in government administrations and SOE’s. Obviously, this will improve productivity in government administrations and SOE’s, thus increasing profits, as that is the primary purpose for the existence of the SOE’s. An improvement in the profits generated on the SOE’s will reduce government’s over-reliance on tax revenue to cover both public current and capital expenditure.
The assistance of the SOE’s profits would really put public finances at ease since the bailouts of these SOE’s have been accounting for the larger portion of the South African public debt. That is, the assistance of SOE’s profits will decrease the level of public debt which would improve South African credit worthiness in the global financial markets, and foreign investors’ confidence. An improvement/increase in foreign investors’ confidence will obviously leads to an increased foreign direct investments as the long run results of this study indicate negative relationship between public debt and foreign direct investment in both long and short run.
REFERENCES
- Bacha EL. A three gap model foreign transfers and the GDP growth rate in developing countries. Journal of Deve Economics. 1990;32(2):279-296.
- African Development Bank. Domestic Resource Mobilization for Poverty Reduction in East Africa: South African case study. Regional Department East Africa (AREA), African Development Group, Tunisia. 2010.
- Siddigi MW, Llyas M. Impact of revenue gap on budget deficit, debt deficit, debt burden and economic growth: Evidence from Pakistan. International Journal of Human and Social Sciences. 2011;6(2):89-98.
- Kantor BK. Ten years after the crash: What has South Africa learnt?. Investec, Monthly View Bulletin. 2019.
- National Treasury. National Budget Review. 2020.
- Say JB. A treatise on political economy on the production, distribution and consumption of wealth. (C. R. Prnsep, Ed), Philadelphia: Claxton, Remsen and Haffelfinger. 1880.
- Churchman N. David Ricardo on public debt (1st edn). UK: Palgrave Macmillan, Studies in history of Economics. 2001.
- Medeiros OL, Cabral RSV, Baghdassarian W, Almeida MA. Public debt strategic planning and benchmark composition. Brazil: National Treasury Secretariat, Ministry of Finance. 2005.
- Mohanty AR, Mishra BR. Impact of Public Debt on Economic Growth: Evidence from Indian States. XIMB Journal of Management. 2016;13(2):1-14.
- Pascal EC. Public debt management. UNESCOEOLSS Encyclopedia, ref. 6.28.39, EOLSS. 2012.
- Kamudia S. The effects of public debt on private investment and economic growth in Kenya (1980– 2013). 2015.
- Biza RA, Kapingura FM, Tsegaye A. Do budget deficit crowd out private investment? An analysis of the South African economy. Paper presented at the Financial Globalization and Sustainable Finance: Implications for Policy and Practice, Cape Town. 2013.
- Makin AJ. Has excessive public debt slowed world growth?. Journal of Public Economics. 2015;16(4):1–17.
- Mongale IP, Petersen JM, Meniago C, Petersen MA. Household savings in South Africa: An econometric analysis. Mediterranean Journal of Social Sciences. 2013;4(2):519–530.
- Friedman M. Inflation and Unemployment. Journal of Political Economy. 1978;85(3):451-472.
- Filip GH. Public Finance. Iasi: Junimea Publishing House. 2010.
- Duverger M. Public Finance. Paris: Presses Universitaires De France. 1975.
- Keynes JM. Activities 1931-1939: World Crises and Policies in Britain and America. The Collected Writings of John Maynard Keynes, London: Macmillan, UK. 1982;21.
- Kabete M. Foreign Aid and Economic Growth: A co-integration analysis of the six poorest African countries. Journal of Economic Analysis and Policy. 2008;38(2):248-261.
- Smith A. An Inquiry into the Nature and Causes of the Wealth of Nations (5th Edition). London: Methuen and C.O. Ltd. 1904.
- De Wet AH, Schoeman HJ, Koch SF. The South African Tax Mix and Economic Growth. South African Journal of Economic and Manag Sciences. 2005;8(2):201-210.
- Mothibi L, Mncayi P. Investigating the key drivers of government debt in South Africa: A post-apartheid analysis. International Journal of eBusiness and eGovernment. 2019;11(1):16-33.
- Oche MO, Mah G, Mongale I. The Effects of Public Debt on Foreign Direct Investment in South African (1983-2013): An Empirical Analysis. Journal of Risk Governance and Control: Financial Markets and Institutions. 2016;6(4):448-456.
- Ncanywa T, Masoga MM. Can Public Debt Stimulate Public Investment and Economic Growth in South Africa?. Journal of Cogent Economics and Finance. 2018;6:1516483, 1-13.
- Simbachawene SM. Does potential tax determinants matters?. Journal of finance and Economics. 2018;1(6):96-102.
- Pesaran MH, Shin Y, Smith RJ. Bound testing approaches to the analysis of level relationships. Journal of Applied Econometrics. 2001;16(3):289-326.
- Granger CWJ, Yoon G. Hidden Co-integration. Working Paper Series, No. 539384, Department of Economics, University of California: San Diego. 2002.
- Shin Y, Yu B, Greenwood-Nimmo M. Modelling Asymmetric Co-integration and Dynamic Multipliers in a Nonlinear ARDL Framework. Journal of Econometric Methods and Application. 2014;2(4):281-314.
- Ramsey JB. Tests for Specification Errors in Classical Least Squares Regression Analysis. Journal of the Royal Statistical Society, Series B. 1969;31:370-371.
- Bierens H. Testing the unit root with drift hypothesis against nonlinear trend stationary with an application to the US price level and interest rate. Journal of Econometrics. 1997;81(1):29-64.
- Breitung J. Nonparametric tests for unit roots and co-integration. Journal of Econometrics. 2002;108(2):343-363.
- Swamy V. Government Debt and its macroeconomic determinants: An empirical investigation. Munich Personal Repec Archive (MPRA) Paper 64106. 2015.
- Crivelli E, De Mooij R, Keen M. Base erosion, profit shifting and developing countries. Journal of Public Finance Analysis. 2016;72(3):263-301.
- Palil MR, Mustapha AF. The evolution and concept of tax compliance in Asia and Europe. Australian Journal of Basic and Applied Sci. 2011;5(11):557-563.
- Rimmer D. Closing the tax gap. Accessed. 2010.
- Ellis MA, Schansberg ED. The Determinants of State Government Debt Financing. Journal of Public Fin Rev. 2004;27:571-587.
- Alawneh A. The Impact of Public Expenditure and Public Debt on Taxes: A case study of Jordan. Jour of Accounting and Fin Research. 2017;6(3):10-23.
- Monte AD, Pennacchio L. Corruption, Government and Public Debt in OECD Countries. 2020.
- Cooray A, Dzhumashav R, Scheider F. How does corruption Affect Public Debt? An Empirical Analysis. World Development. 2017;90:115-117.
- Aregbeshola AR. Foreign Direct Investment and Institutional Adequacy: New Granger Causality Evidence from African Countries. South African Journal of Economic and Manag Sciences. 2014;17(5):557-568.
- Tshishonga N. The Increased politicization of human resources recruitment. In P.S. Reddy and M. De Vries (eds.), Quo Vadis?: Local governance and development in South Africa post 1994, Bruylant Publishers, Belgium. 2014;126-146.
Citation: Monamodi NE, Choga I (2021) An Estimation of the Effect of Tax Revenue Collection on the Public Debt in South Africa. Review Pub Administration Manag. 9: 292.
Copyright: © 2021 Monamodi NE, et al. This is an open-access article distributed under the terms of the Creative Commons Attribution License, which permits unrestricted use, distribution, and reproduction in any medium, provided the original author and source are credited.