Indexed In
- Euro Pub
- Google Scholar
Useful Links
Share This Page
Journal Flyer
Open Access Journals
- Agri and Aquaculture
- Biochemistry
- Bioinformatics & Systems Biology
- Business & Management
- Chemistry
- Clinical Sciences
- Engineering
- Food & Nutrition
- General Science
- Genetics & Molecular Biology
- Immunology & Microbiology
- Medical Sciences
- Neuroscience & Psychology
- Nursing & Health Care
- Pharmaceutical Sciences
Research Article - (2023) Volume 12, Issue 4
Absorption Kinetics of Monosaccharides, Disaccharides and its Combination with its Impact on Glucose Availability
Ramesh Prajapati1*, Jogeswar Mahapatra2, Manoranjan Sharma2, Abhishek Jha2, Randeep Patro2, Shilpa Dhar1, Pravin Chondhekar1, Pratibha Purohit1, Abhijit Chatterjee2 and Govindarajan Raghavan12Department of Pharmacology, Zydus Research Centre, Gujarat, India
Received: 16-Dec-2022, Manuscript No. GJBAHS-22-19349; Editor assigned: 19-Dec-2022, Pre QC No. GJBAHS-22-19349 (PQ); Reviewed: 02-Jan-2023, QC No. GJBAHS-22-19349; Revised: 09-Mar-2023, Manuscript No. GJBAHS-22-19349 (R); Published: 16-Mar-2023, DOI: 10.35248/2319-5584.23.12.190
Abstract
Carbohydrates are the primary macronutrients that humans consume to support the body’s need for a source of energy. Monosaccharides like glucose are the simplest form of carbohydrate that is readily absorbed in the bloodstream, followed by disaccharides like sucrose, which are converted into glucose prior to absorption and energy release. To evaluate the absorption, distribution, and absorption kinetics of glucose, sucrose, and a combination of the two in the bloodstream, a preclinical study was conducted in Sprague Dawley (SD) rats showing instant and sustained energy release through the change in blood glucose level after intake of the test product. The data of blood glucose tested using a glucometer were analyzed and evaluated using a regression method. The comparison study determines whether monosaccharides, disaccharides, or a blend of both have an impact on absorption kinetics and sustenance of blood glucose levels. The result showed glucose was absorbed in the bloodstream at a faster rate as early as 60 seconds (onset time) than sucrose and peaked within 30 minutes thus providing instant energy. Additionally, sucrose and its combination with glucose maintained blood glucose levels for a longer duration compared to glucose alone with a lower regression slope of 0.744 (sucrose) vs. 1.247 (glucose). Sucrose and its combination with glucose provide slow and steady energy release up to 4 hours. In conclusion, glucose provides instant energy, while sucrose and its combination with glucose provided sustained energy release after intake.
Keywords
Monosaccharides; Disaccharides; Blood glucose; Sucrose; Absorption kinetics; Sustained energy
Introduction
Carbohydrates are macronutrients in the human diet that act as a major source of energy. Based on their structures, carbohydrates are classified as monosaccharides, disaccharides, oligosaccharides, and polysaccharides. Monosaccharides and disaccharides are simple carbohydrates containing one or two sugar moieties combined in a simple chemical structure. Monosaccharides like glucose are the most basic form of carbohydrates, while disaccharides like sucrose are compound sugars containing two units of monosaccharides. Oligosaccharides and polysaccharides are complex carbohydrates containing three or more monosaccharides bonded in a complex chemical structure [1]. Carbohydrates are utilized for energy by the body, causing a rise in blood sugar levels. After intake of carbohydrates, these are broken down into glucose throughout the digestive system. Glucose molecules are circulated to the cells and tissues that require energy. In the cells, glucose is further broken down through a series of biochemical processes that release energy in the form of ATP [2]. ATP is used to fuel every energy-requiring process in the body [3].
Energy and sports drinks are highly popular beverages that contain carbohydrates like glucose as one of their major energy sources. Clinical evidence has identified positive effects of energy drinks on physical performance and energy levels [4]. However, limited data is available on the duration of increase and sustenance of energy levels after consuming energy drinks containing simple carbohydrates. The present study evaluates the absorption, distribution, and kinetics of absorption of glucose, sucrose, and a combination of the two to identify the rate of absorption and duration of energy sustenance as a measure of blood glucose levels in Sprague Dawley (SD) rats [5].
Materials and Methods
Animals
Male SD rats of 7-9 weeks old were housed in conventional cages and given pelleted food (standard rodent diet, harlan teklad laboratory, USA) and water ad libitum in a temperature (25℃ ± 3℃) and humidity (50%-70%) controlled environment with a 12 h/12 h dark light cycle. All animal care and experimental procedures complied with the guidelines of the committee for the purpose of control and supervision of experiments on animals as stated by the national institutes of health and were approved by the institutional animal ethics committee, an Association for Assessment and Accreditation of Laboratory Animal Care (AAALAC) international accredited facility.
Study procedure
Animals were randomized into various groups (n=5, each) so that the average body weight of each group remains approximately the same. The test animals were kept on overnight fasting before administration of the test products. The test products were as follows.
• Vehicle: Demineralized water.
• Glucose: DMH (Dextrose Monohydrate) (100%).
• Sucrose: (100%).
• G40 S56: Contains glucose/DMH (40%), sucrose (56%), and permitted excipients, flavors, and colors.
• G20 S75: Contains glucose/ DMH (20%), sucrose (75%), and permitted excipients, flavors, and colors.
Test products were dissolved in demineralized water so that the concentration of each preparation was 2.57 g/kg body weight with the volume of administration of 5 ml/kg body weight, further referred to as test solution in the text. The dose is calculated as rat equivalent of human dose 25 g/adult [6]. Blood was collected for glucose estimation from the tail vein before and 15 min, 30 min, 1 h, 2 h, 4 h, and 8 h after administration of test preparations. Blood glucose was measured using an automatic glucose analyzer (accu-chek active). The glycemic response was determined as the incremental Area Under the Curve (iAUC) measured from the blood glucose concentration-time graph. DMH/Glucose used in the test product contained inherit moisture content of 8.5%.
Statistical analysis
The data obtained were represented as the mean ± SEM. Linear regression was used to calculate the time taken by the test solutions to increase the blood glucose levels after oral ingestion. The incremental area was calculated to determine the available energy after the intake of test solutions. Linear fit and logarithmic fit equations were used to calculate the sustenance of energy after the intake of the test solutions. Linear fit equation was used to calculate the reduction in blood glucose from 30 min to 120 min, while logarithmic fit equation was used to calculate the reduction in blood glucose from 30 min to 240 min.
Results
Absorption kinetics
The change in blood glucose levels after administration of the test solutions is shown in Table 1. The blood glucose levels increased in all groups from 0 min to 30 min, with a decline in levels after 30 min of receiving the test solutions. For all the test solutions the peak plasma concentration was reached in 30 minutes after ingestion. Glucose had the highest peak concentration (224.6 ± 23.2 mg/dl) at 30 min when compared to other test solutions (Figure 1).
| Time (min) | Blood glucose level (mg/dl) | ||||
|---|---|---|---|---|---|
| Vehicle | Glucose | Sucrose | G40 S56 | G20 S75 | |
| 0 | 87.6 ± 4.3 | 85.2 ± 4.2 | 85.4 ± 5.7 | 82.4 ± 3.9 | 88.6 ± 3.0 |
| 15 | 103.6 ± 4.3 | 176.0 ± 18.4 | 158.2 ± 5.5 | 157.2 ± 10.0 | 148.8 ± 10.1 |
| 30 | 108.0 ± 5.0 | 224.6 ± 23.2 | 176.6 ± 11.2 | 186.2 ± 11.3 | 186.0 ± 7.8 |
| 60 | 107.8 ± 4.6 | 172.2 ± 9.5 | 169.0 ± 8.6 | 167.8 ± 10.7 | 173.2 ± 5.1 |
| 120 | 88.8 ± 3.3 | 109.4 ± 7.3 | 112.6 ± 5.6 | 107.2 ± 5.2 | 123.8 ± 4.1 |
| 240 | 81.0 ± 5.8 | 97.0 ± 6.6 | 101.8 ± 3.9 | 101.4 ± 3.4 | 93.6 ± 3.9 |
| 480 | 71.2 ± 5.8 | 91.2 ± 3.5 | 93.6 ± 3.2 | 78.2 ± 6.2 | 87.0 ± 6.5 |
All values are expressed as mean ± SEM
Table 1: Change in blood glucose levels after administration of the test solutions.
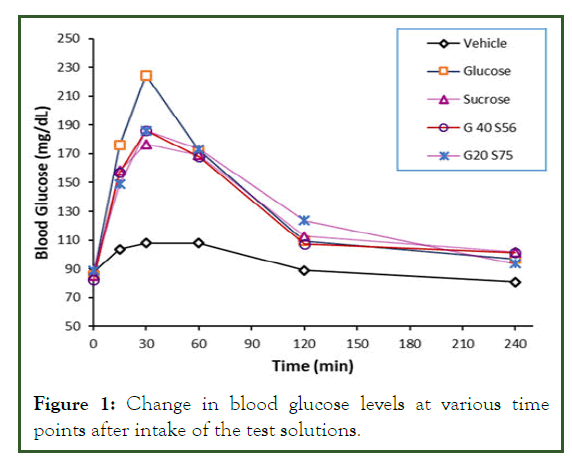
Figure 1: Change in blood glucose levels at various time points after intake of the test solutions.
The blood glucose levels increased within the first 30 min of intake of the test solutions, reaching a peak at 30 min (Figure 2). This denotes the extent of absorption after ingestion of the test solutions. Within 30 min, glucose was absorbed at a faster rate which was indicated by a peak blood glucose level (absolute Gmax) of 139.4 mg/dl, compared with G40 S56 (103.8 mg/dl), G20 S75 (97.4 mg/dl), and sucrose (91.2 mg/dl) solutions (Table 2). Absolute Gmax values were obtained by subtracting the baseline blood glucose from the maximum blood glucose level achieved at 30 min time interval for all test solutions.
| Test solutions | Blood glucose level (mg/dl) | R2 (0 min-30 min) | ||
|---|---|---|---|---|
| 0 min | 15 min | 30 min | ||
| Vehicle | 0 | 16.0 | 20.4 | 0.883 |
| Glucose | 0 | 90.8 | 139.4 | 0.964 |
| Sucrose | 0 | 72.8 | 91.2 | 0.873 |
| G40 S56 | 0 | 74.8 | 103.8 | 0.927 |
| G20 S75 | 0 | 60.2 | 97.4 | 0.978 |
Table 2: Absolute Gmax (mg/dl) and regression coefficients (R2) of the test solutions.
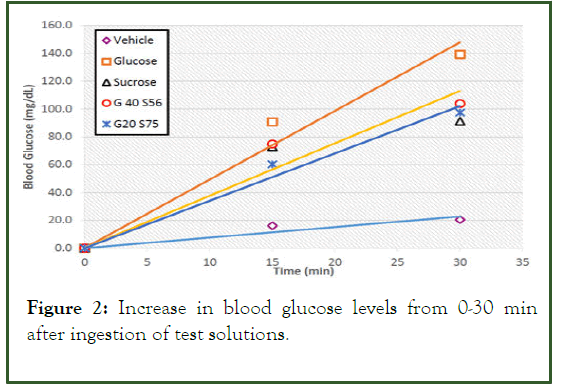
Figure 2: Increase in blood glucose levels from 0-30 min after ingestion of test solutions.
The linearity of increase in blood glucose after ingestion of test solutions was determined by regression coefficient (R2). Glucose and glucose containing solutions had R2 values closest to 1, indicating a linear increase in blood glucose after ingestion. On the other hand, sucrose alone comparatively showed poor linearity in increasing blood glucose after ingestion. This further indicates that glucose and glucose containing solutions are absorbed faster than sucrose alone.
Onset time
The rate of absorption after ingestion of test solutions was estimated using onset time which was defined as the increase in blood glucose from baseline value to baseline plus 5 mg/dL and baseline plus 50 mg/dL, respectively. The value of 5 mg/dL was selected to account for ± 5 as a limit of tolerance. After comparing the test solutions, glucose showed the least time to achieve the desired blood glucose level from the baseline value as compared to sucrose and the combination of glucose and sucrose (Table 3). Glucose achieved an increase in blood glucose level of baseline plus 5 mg/dL within 60 seconds, as compared to the other solutions. The normal range of fasting and postprandial blood glucose levels in rats is similar to humans. The blood glucose level of 140 mg/dl (baseline plus 50 mg/ dl) was achieved in 609 seconds in case of glucose compared to 881.4 seconds for sucrose, 796.8 seconds for G40 S56, and 882.6 seconds for G20 S75. Sucrose took longer time to reach the postprandial blood glucose levels, followed by the combination with a higher sucrose ratio, and the other combination with a lesser sucrose ratio [7]. This indicated that glucose was readily absorbed and provided instant energy compared to other test solutions.
| Sample | Time (sec) to achieve blood glucose level of 5 mg/dl higher than baseline value | Time (sec) to achieve blood glucose level of 50 mg/dl higher than baseline value |
|---|---|---|
| Glucose | 60.0 | 609.0 |
| Sucrose | 88.2 | 881.4 |
| G40 S56 | 79.8 | 796.8 |
| G20 S75 | 88.2 | 882.6 |
Table 3: Time calculated using linear regression to achieve the desired blood glucose levels higher from the baseline value.
Sustained energy
Sustained energy was evaluated as the extent of maintenance of blood glucose level after ingestion of test solutions. As observed in Figure 1, the blood glucose started decreasing after attaining a maximum level at 30 min after ingestion of all test solutions. Therefore, the time between 30 min and 120 min was used to evaluate the sustenance of energy in view of glucose utilization. It was observed that this decrease in blood glucose level was linear between 30 min to 120 min in all test solutions (Figure 3 and Table 4). The linearity is denoted by the slope of the graph. Higher slope values indicated a rapid decline in blood glucose level, whereas a lower slope value indicated a comparatively slower decline. The blood glucose level decreased rapidly with glucose (slope=1.247), followed by G40 S56 (slope=0.897) and sucrose (slope=0.744) whereas the decrease was slowest with G20 S75 (slope=0.71). Glucose is a monosaccharide and is quickly absorbed and utilized into the blood stream; whereas sucrose is a disaccharide that is cleaved into glucose and fructose, thereby taking a longer time than glucose for absorption and utilization. The study results indicated that the sucrose-containing test solutions provided sustained energy by maintaining blood glucose level for a longer period than glucose alone.
| Sample | Slope | Fold faster reduction (based on slope) |
R2 |
|---|---|---|---|
| Vehicle | 0.228 | - | 0.898 |
| Glucose | 1.247 | 5.5 | 0.981 |
| Sucrose | 0.744 | 3.3 | 0.95 |
| G40 S56 | 0.897 | 3.9 | 0.988 |
| G20 S75 | 0.710 | 3.1 | 0.981 |
Table 4: Reduction in blood glucose from 30 min to 120 min (R2 calculated from linear fit equation).
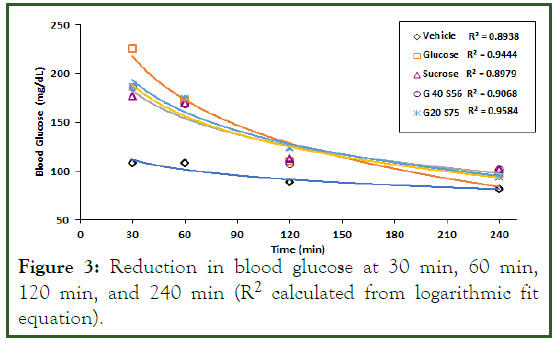
Figure 3: Reduction in blood glucose at 30 min, 60 min, 120 min, and 240 min (R2 calculated from logarithmic fit equation).
The Area Under the Curve (AUC) is the geometric mean value used to estimate the total increase in blood glucose during an Oral Glucose Tolerance Test (OGTT). The incremental AUC (iAUC) has been developed to minimize the variations in baseline blood glucose or fasting plasma glucose [8]. It is an established method for the assessment of blood glucose response after the intake of carbohydrates. In this study, iAUC was plotted to evaluate energy sustenance (from 0-240 min) by subtracting the baseline value of fasting blood glucose from all subsequent readings after ingestion of the test solutions. As depicted in Figure 4, iAUC for the test solutions was sucrose 8683 (mg.min/dl), followed by G20 S75 8715 (mg.min/dl), G40 S56 9018 (mg.min/dl), and glucose 9645 (mg.min/dl), respectively. The available energy for utilization is almost similar for all the test solutions as observed from the above data; however, the energy available is either instant or sustained based on the type of the test solution. In other words, glucose alone provides instant energy, while in combination with sucrose it provides sustained energy.
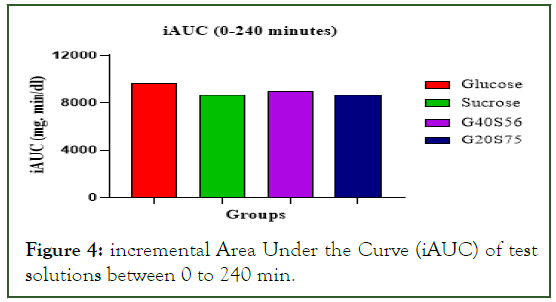
Figure 4: incremental Area Under the Curve (iAUC) of test solutions between 0 to 240 min.
Additionally, sustained energy was evaluated using the time taken for peak blood glucose level to fall by 50 mg/dl within 30 min to 240 min after ingestion of all test solutions. It was observed that peak blood glucose level dropped fastest with glucose (58.2 min) and slowest with sucrose (135.7 min), followed by G20 S75 (100.9 min) (Table 5). This shows that sucrose and its combination with glucose remain in the blood for a longer duration as compared to other test solutions, thereby providing better-sustained energy.
| Sample | Gmax (mg/dl) | Time (min) to reach value of Gmax-50 mg/dl |
|---|---|---|
| Glucose | 224.6 | 58.2 |
| Sucrose | 176.6 | 135.7 |
| G40 S56 | 186.2 | 93.6 |
| G20 S75 | 186.0 | 100.9 |
Table 5: Time taken for blood glucose to fall by 50 mg/dl within 30 min to 240 min after ingestion of the test solutions (calculated from logarithmic fit equation).
Discussion
Carbohydrate based energy drinks and sports drinks are popular beverages, particularly among children, adolescents, and young adults [9]. Energy drinks have shown to increase physical performance by supplying increased energy, alertness, and improved athletic performance [10]. Sports drinks are used to prevent dehydration, supply carbohydrates, replenish electrolytes lost during exercise, and sustain endurance capacity [11].
Glucose is one of the major components of both sports and energy drinks [12]. Evidence reports effects of glucose on reaction time, memory, and concentration, with glucose exhibiting greater benefits on performance of more demanding tasks. Benton and Stevens evaluated the influence of a glucose containing drink on the behavior of school going children (n=16) aged between 9-10 years old in a double blind placebocontrolled cross-over trial. The children were randomly assigned to either a drink containing 25 g of glucose or a drink containing placebo. The researchers reported that children assigned to glucose based drink had better memories and spent more time on tasks when working in class as compared to placebo.
The present study was conducted to evaluate the absorption kinetics in blood after oral administration of either glucose, sucrose, or a blend of the two in different proportions. The absorption kinetics and sustenance parameters were evaluated through the change in blood glucose level after intake of the test solutions. The results showed that the blood glucose started increasing as early as 60 seconds, in case of glucose, and the peak blood glucose level reached within 30 min. of intake of the test solutions. The early rise of blood glucose within 60 seconds after intake of glucose solution indicates a faster absorption compared to the other test solutions containing sucrose alone and its combinations. Therefore, intake of glucose provides instant energy within 60 seconds of intake, while it was delayed in other test solutions. The postprandial blood glucose level (140 mg/dl) was achieved first with glucose. On the other hand, sucrose and its combination with glucose had taken more time to reach the postprandial blood glucose level. This indicates that glucose is readily absorbed and provides instant energy compared to other test solutions. A similar study reported that intake of carbohydrates, especially simple sugars, has shown to have an energizing effect. This effect is linked to increasing plasma glucose levels within 5 min after consumption, peaking at 20 min, and maintaining this increase beyond 75 min [12].
The drop in blood glucose due to glucose utilization was evaluated as the sustenance of energy once the Gmax was attained, i.e., from 30 min onward. The decrease in blood glucose was linear between 30 min to 120 min for all test solutions. The blood glucose level decreased rapidly from its respective Gmax values having 5.5-fold reduction with glucose, whereas the decrease was slowest with G20 S75 solution having 3.1 fold reduction, followed by sucrose and G40 S56 having 3.3 and 3.9 fold reduction respectively based on the calculated slope value (Table 4). Additionally, when the analysis data was extended upto 240 min, the linearity was lost, and the data were logarithmically fitted for analysis. The time required for a reduction of 50 mg/dL from the Gmax value i.e., Gmax-50 was considered for measuring sustenance. Glucose showed a faster reduction with a time interval of 58.2 min compared to sucrose which took more time (135.7 min). The combinations of sucrose and glucose based formulations were comparatively faster than sucrose alone with 93.6 min for G40 S56 and 100.9 min for G20 S75. This demonstrates that sucrose and sucrose dominant formulations have a gradual drop in blood glucose levels and can offer utilisable energy for up to 4 hours. A steady decrease in blood glucose levels by sucrose and its combination with glucose indicates a sustained energy release. Thus, by blending glucose with sucrose in different ratios we can achieve both instant and sustained energy as per the energy requirement.
Conclusion
The rate of absorption and glucose release kinetics depends on the type of carbohydrate and has a major impact on the availability of glucose in the blood. The present study has demonstrated that monosaccharides like glucose had a faster onset time and thus was readily absorbed into the bloodstream, thereby providing instant energy onset in 60 seconds. Furthermore, the drop in slope linearity from the peak blood glucose level showed that sucrose and its combination with glucose test product maintained blood glucose for a longer period of time, indicating a slow and steady release of blood glucose that maintains a sustained energy release for 4 hours. The present study highlights the possibility of developing formulations containing a combination of monosaccharides and disaccharides with rapid absorption and steady energy release that can provide instant and sustained energy.
Acknowledgments
We acknowledge the medical writing support provided by Medicca press limited.
Conflict of Interest
The authors declare that there is no conflict of interest regarding the publication of this article.
Funding
The study was funded by Zydus Wellness.
Financial and Non-financial Interest
The authors have no relevant financial or non-financial interests to disclose.
References
- Holesh JE, Aslam S, Martin A. Physiology, Carbohydrates. In: StatPearls. Treasure Island (FL): StatPearls Publishing; 2022.
[Google Scholar] [PubMed]
- Hantzidiamantis PJ, Lappin SL. Physiology, Glucose. In: StatPearls. Treasure Island (FL): StatPearls Publishing; 2022.
[Google Scholar] [PubMed]
- Alberts B, Johnson A, Lewis J, Raff M, Roberts K, Walter P. How Cells Obtain Energy from Food. Molecular Biology of the Cell, 4th edn. New York: Garland Science; 2002.
- Nowak D, Goslinski M, Nowatkowska K. The effect of acute consumption of energy drinks on blood pressure, heart rate and blood glucose in the group of young adults. Int J Environ Res Public Health. 2018;15(3):544.
[Crossref] [Google Scholar] [PubMed]
- Alsunni AA. Energy drink consumption: Beneficial and adverse health effects. Int J Health Sci (Qassim). 2015;9(4):468-474.
[Google Scholar] [PubMed]
- Benton D, Stevens MK. The influence of a glucose containing drink on the behavior of children in school. Biol Psychol. 2008;78(3):242-245.
[Crossref] [Google Scholar] [PubMed]
- Wang Z, Yang Y, Xiang X, Zhu Y, Men J, He M. Estimation of the normal range of blood glucose in rats. Wei Sheng Yan Jiu. 2010;39(2):133-137.
[Google Scholar] [PubMed]
- Liu KF, Niu CS, Tsai JC, Yang CL, Peng WH, Niu HS. Comparison of area under the curve in various models of diabetic rats receiving chronic medication. Arch Med Sci 2022;18(4):1078-1087.
[Crossref] [Google Scholar] [PubMed]
- Pound CM, Blair B. Energy and sports drinks in children and adolescents. Paediatr Child Health 2017;22(7):406-410.
[Crossref] [Google Scholar] [PubMed]
- Howard MA, Marczinski CA. Acute effects of a glucose energy drink on behavioral control. Exp Clin Psychopharmacol. 2010;18(6):553-561.
[Crossref] [Google Scholar] [PubMed]
- Alsunni AA. Are energy drinks physiological? Pak J Physiol. 2011;7(1):44-49.
- Smit HJ, Grady ML, Finnegan YE, Hughes SA, Cotton JR, Rogers PJ. Role of familiarity on effects of caffeine and glucose containing soft drinks. Physiol Behav. 2006;87(2):287-297.
[Crossref] [Google Scholar] [PubMed]
Citation: Prajapati R, Mahapatra J, Sharma M, Jha A, Patro R, Dhar S, et al. (2023) Absorption Kinetics of Monosaccharides, Disaccharides and its Combination with its Impact on Glucose Availability. Glob J Biol Agric Health Sci. 12:172.
Copyright: © 2023 Prajapati R, et al. This is an open access article distributed under the terms of the Creative Commons Attribution License, which permits unrestricted use, distribution, and reproduction in any medium, provided the original author and source are credited.
