

Indexed In
- Open J Gate
- RefSeek
- Hamdard University
- EBSCO A-Z
- Scholarsteer
- Publons
- Euro Pub
- Google Scholar
Useful Links
Share This Page
Journal Flyer
Open Access Journals
- Agri and Aquaculture
- Biochemistry
- Bioinformatics & Systems Biology
- Business & Management
- Chemistry
- Clinical Sciences
- Engineering
- Food & Nutrition
- General Science
- Genetics & Molecular Biology
- Immunology & Microbiology
- Medical Sciences
- Neuroscience & Psychology
- Nursing & Health Care
- Pharmaceutical Sciences
Research Article - (2025) Volume 13, Issue 1
Using Benford's Law and RMSE to Predict Financial Fraud Using Firm-Reported Data
Rakshit Kaushik*Received: 23-Jun-2023, Manuscript No. IJAR-23-21928; Editor assigned: 26-Jun-2023, Pre QC No. IJAR-23-21928 (PQ); Reviewed: 10-Jul-2023, QC No. IJAR-23-21928; Revised: 22-Jan-2025, Manuscript No. IJAR-23-21928 (R); Published: 29-Jan-2025, DOI: 10.35248/2472-114X.25.13.404
Abstract
Data growth is exploding in the era of big data. To maximise the value of data, data quality management has become crucial. Establishing a strategy for identifying the quality of scientific data is crucial and essential. Benford’s law has evolved into an effective tool for assessing data quality and spotting anomalous data across multiple sectors. Benford’s law is a digital analytic method that determines the probabilistic distribution of digits for numerous common phenomena. The fraud detection method uses deviations from the expected Benford’s law distributions as strong signs of fraudulent behaviour. The wire card fraud, which resulted in losses of several billion euros, is regarded as one of the most notable financial scandals of the decade. This paper examines the digit structure of Wire card’s financial figures from 2005 to 2019, financial figures of the bank of England, financial figures of the SEC’s Accounting and Auditing Enforcement Releases (AAERs), financial figures of publicly traded U.S. firms, sample financial data, and test data by analysing their conformity with the expected frequency distributions based on Benford’s law. The results indicate that small accounting fraud in large datasets cannot be identified using the Benford analysis of the first digits alone. This work still demonstrates how Benford’s law can be applied to small datasets with a high fraud count in accounting and auditing, hence introducing data analytic approaches for fraud detection. The future evolution of Benford’s law necessitates that academics from many disciplines conduct additional research on its foundation, strengthen its integration with other data processing technologies, and then broaden its application. Keywords: Benford’s law; Probabilistic distribution; Financial data; Anomalous data; Auditing
Keywords
Benford’s law; Probabilistic distribution; Financial data; Anomalous data; Auditing
Abbreviations
PwC: Price water house Coopers; BL: Benford’s Law; AAER: Accounting and Auditing Enforcement Releases; BoE: Bank of England; CSV: Comma-Separated Values
Introduction
In recent years, fraud has become widespread worldwide and in Slovenia. Businesses took advantage of the absence of norms and regulations to prevent and control accounting fraud. Soon after the major global crises, new fraud prevention and detection legislation, regulations, and guidelines emerged. Fraud typically results in a financial scandal caused by the intentional misrepresentation or misidentification of things or the inappropriate use of a company's assets. We live in an age where we are continuously bombarded with vast information. Daily, satellites orbiting the Earth send more data than the Library of Congress; researchers must quickly filter these data sets to identify the pertinent information. It is, therefore, not strange that researchers are fascinated by data patterns. Benford's law governing the distribution of the first or leading digits is intriguing and unexpected [1].
Benford's law is based on a recently established mathematical distribution of the frequencies of naturally occurring numbers, which can be employed effectively to detect financial fraud [2].
Contrary to intuition, the first digits of randomly picked data do not follow a uniform distribution but rather a pattern of logarithmic decline known as Benford's Law (BL). Benford's law applies to regression coefficients and standard errors in empirical economics. Despite the importance of Benford's Law for detecting fraud, most financial professionals are frequently uninformed of its existence and how to utilise it most effectively. Therefore, the goal of this study is to offer a way for systematically implementing Benford's law in order to discover and flag potentially fraudulent financial transactions that can be further probed. This paper explores the origins of Benford's law and demonstrates how it can be systematically implemented through Python software to detect probable fraud [3]. Benford's law has significant implications for identifying fraud, given the recently increasing high costs and a sharp rise in fraud. For instance, according to PwC's 2018 global economic crime and fraud survey, 49% of organisations globally acknowledged having been victims of fraud and economic crime, and 64% of respondents estimated that losses due to their most disruptive fraud might exceed $1 million. According to accountancy daily, the global fraud cost is nearly three trillion dollars. According to a recent analysis titled "the financial cost of fraud 2018" by Crowe Clark Whitehill, an international accounting firm, businesses lose up to ten percent of their yearly income to fraud. Given that organizations can lose up to ten percent of their revenues due to financial fraud, the methodology given in this paper for adopting Benford's law can be a valuable tool for auditors and other financial professionals attempting to detect fraud [4].
There are numerous benefits to examining the initial digits of a data set. This refers to the following: Two distinct datasets may have vastly different scales; one may represent the masses of subatomic particles, while the other may represent closing stock values. Despite the various units and magnitudes, each number has a unique beginning digit, allowing us to compare the distribution of the first digits of the two data sets [5].
Over the past fifty years, over 150 articles have been written about Benford's law. In the past decade, a subgroup of these papers has encouraged using this legislation as a straightforward and efficient method for auditors to find operational anomalies and uncover accounting fraud.
In recent years, Benford's law has seen a remarkable rise in popularity. Given that a collection of numbers is assumed to be Benford compliant under fairly generic conditions, it can be utilised in various applications that seek to uncover potentially manipulated numbers, such as anti-fraud investigations. Benford's law conformance statistical evaluation demands testing methodologies with desirable statistical features [6]. We seek a statistical test that reduces the number of false alarms and ensures a sufficient level of power, particularly for audits involving a large number of sample tests. When there are only a small amount of observations in the sample, the selection of the Benford compliance test becomes even more crucial [7].
The production of phoney accounting entries, such as the recording of fictitious sales transactions, is a typical method used by corporate management to conduct financial reporting fraud. Similarly, staff may try to misappropriate assets by submitting fraudulent cost claims. Both strategies depend on auditors' inability to distinguish between fictitious and actual transactions.
Benford's law, however, may "see through" these fictitious accounting entries and alert auditors to probable areas of fraud so that these can be explored further. Benford's law is based on the observation that naturally occurring number distributions are drastically distinct from artificially generated numbers, such as when sales transactions are artificially created to inflate revenue. Many accounting activities, such as individual sales or depreciation expenses, might exhibit naturally occurring distributions when minimum and maximum constraints are not imposed. Consequently, naturally occurring distributions in accounting and finance are best suited for applying Benford's law, which can reveal the presence of fictitious numbers indicating the possibility of fraud.
Given the preceding incentives for applying Benford's rule in accounting and auditing, this paper has a dual purpose: First, it describes the history and validity of utilizing Benford's law to find abnormalities in accounting statistics. Second, the practical implementation of Benford's law is presented using python scripts and a structured technique that accounting professionals can use to quickly discover number patterns that do not conform to Benford's law's expected distribution [8]. The given methodology will enable auditors and other accounting professionals to rapidly and efficiently flag numbers that require closer examination, establishing the basis for fraud investigation and analysis.
Auditors must examine several factors when using digital analysis to uncover fraud. First, on what kinds of accounts is Benford analysis likely to be effective? There are exceptions to the rule that most accounting-related data sets correspond to the Benford distribution. In addition, because the digital analysis is only successful when applied to conforming sets, auditors must examine whether a specific data set is likely to fit the Benford distribution before conducting a digital analysis. Second, under what conditions are digital analysis ineffective? In other words, are there fraud types that digital analysis cannot detect? Finally, how much assistance can auditors anticipate from Benford's law in identifying accounts for further inquiry that are suspect? This article examines Benford's law as an indicator of financial data fraud and provides solutions to the aforementioned questions [9].
Benford's law is a mathematical formula that determines the probability of data sets, including leading digit sequences. Benford's law is an example of a type of counterintuitive law. Some authors linked it to Newton's law of gravitation, stating that it is a simpler observation of reality than a mathematical result that can be demonstrated. Contrary to common sense, this law claims that lower first significant digits, often known as leading digits, occur more often than higher ones in natural occurrences. Under extremely generic settings, numbers are predicted to adhere naturally to the postulated pattern of digits. In addition, any variation from the Benford distribution could indicate an external alteration of the expected pattern resulting from data manipulation or fraud [10]. Benford's law can be utilized as a forensic accounting and auditing tool for financial data, as popularized by Nigrini's works among scholars and accounting professionals. Since then, it has been utilized as an advanced statistical tool for detecting fraud. In 1881, astronomer and mathematician Simon Newcomb published in the American Journal of Mathematics the first known article describing what is now known as Benford's law. He discovered that the opening pages of library copies of logarithms books, which dealt with low digits, were significantly more worn than the pages with higher digits [11]. This pattern led him to conclude that fellow scientists used those tables to look up numbers beginning with the numeral one more frequently than those beginning with the numerals two, three, till nine.
The obvious conclusion was that more numbers exist which begin with the numeral one than with larger numbers. Newcomb calculated that the probability that a number has any particular non-zero first digit is:
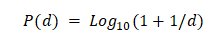
Where;
d=Number 1,2,3,4,5,6,7,8, or 9.
P=Probability of its distribution.
Using his formula, the probability that the first digit of a number is one is about 30 percent while the probability at the first digit is nine is only 4.6 percent. Table 1 below shows the expected frequencies for all digits 0 through 9.
| Digit | Expected frequency leading digit |
|---|---|
| 1 | 0.30103 |
| 2 | 0.17609 |
| 3 | 0.12494 |
| 4 | 0.09691 |
| 5 | 0.07918 |
| 6 | 0.06695 |
| 7 | 0.05799 |
| 8 | 0.05115 |
| 9 | 0.04576 |
Table 1: Expected frequency of digits.
Despite its extensive history, the mathematical and statistical issues posed by Benford's law have only been acknowledged. From a mathematical standpoint, appropriate law variants arise in integer sequences, such as the famed Fibonacci or factorial sequences. The law applies to floating point arithmetic as well [12]. Benford's law can now be utilised as a forensic accounting and auditing tool for financial data, largely thanks to the work of Nigrini. The law is a helpful starting point for forensic accountants and applies in various auditing scenarios, including external, internal, and government auditing. It has also successfully identified malfeasance in other areas, including electoral data, campaign funding, and economic data abnormalities. Benford hypothesised that he looked up the logarithms of lower-level numbers more often because there were more numbers with lower-level numerals in the world. In contrast to Newcomb, Benford investigated if his hypothesis was confirmed. He analysed data from numerous geographical, scientific, and demographic sources. His data included figures from 20 different lists, including around 20,229 observations. Benford's discovery was intriguing. He discovered that the leading digit number frequency distributions of various databases, such as city populations, death rates, and river drainage, were logarithmic rather than arithmetic [13]. The leading digit is the number's initial digit. For example, New Zealand's population is 4,746,880 million. Therefore, New Zealand's population's leading or initial digit is 4. Due to the logarithmic distribution of the leading digits of integers, lower numbers such as 1 and 2 occur more frequently than more significant numbers such as 8 and 9. This result contradicts the intuitive notion that each numeral should occur in around 11% of occurrences (one out of nine possible numbers). Consequently, larger digits such as the number 9 are less likely to occur than earlier digits and do not occur 11% as frequently as expected. Given the high cost associated with fraud, accounting professionals can use a reliable and efficient method to apply Benford's law to flag questionable accounts and transactions [14]. Therefore, this work aims to give a structured methodology for applying Benford's law using Python, which accounting professionals may use to quickly flag accounts and transactions requiring additional inquiry. Nigrini demonstrated in 1994 that Benford's law might be utilised to detect deception or fraud. His research is based on the observation that individuals generate fake figures due to the aforementioned psychological conditions. He is also presumed to be the first researcher to completely implement and test Benford's law in financial statements to detect potential fraud. Hill noted in 1996 that the accuracy of Benford's law in detecting accounting errors is questionable because it produces numerous false positives.
This means that specific misleading results could prompt additional costly inquiries. Nigrini supports his definition by arguing that the digital analysis of Benford's rule provides a solid foundation for distinguishing suspicious data with a high degree of manipulation from data with a meagre chance of manipulation, which is crucial for subsequent analyses. Benford's law has gained prominence in auditing and forensic accounting over time. Benford's law was not acknowledged as a forensic accounting tool for detecting suspected fraud until 1990. Today, Benford's law, as an analytical approach, is one of the most widely used digital procedures and provides a distinctive method for data analysis. Benford's law enables forensic accountants to uncover accounting data fraud, manipulation, and other problems. Testing compliance with Benford's law for authentic digits transfers the detection emphasis from individual transactions to the entire data set from each trader. To apply equation 1 as a test for the digit frequencies of a data collection, Benford's law requires that each dataset entry contain values of comparable phenomena. In S, the data cannot comprise entries from two distinct phenomena: Population census records and dental measures. There should be no minimum or maximum values predefined within the data set. In other words, the records for the phenomenon must be complete, with no contrived beginning or end values. The dataset should not contain allocated numbers such as telephone numbers. The data set should have more entries with tiny values than large ones. In real applications, many data sets cannot meet all four criteria mentioned above. Benford's law does not apply to data that does not form organically, including house number, lottery number, telephone number, date, and weight. As shown in the research compiled by Benford in his research paper in 1938.
Although the mathematical proof is unnecessary for this explanation, the law is intuitively straightforward to grasp [15]. Consider a company's market value. If the amount is $1,000,000, it must double in size before the first number becomes a "2," or expand by 100 percent. For the initial digit to become a "3," it need only increase by 50 percent. To be a "4", the company only increased by 33%. In many distributions of financial data, which indicate the amount of everything from a purchase order to stock market returns, the digit one is far further from two than the digit eight is from nine.
Consequently, the empirical evidence indicates that smaller values of the first significant digits are significantly more likely than bigger ones for these distributions. Since over ninety years ago, mathematicians and statisticians have provided numerous explanations for this occurrence [16]. Raimi's 1976 article includes a variety of less rigorous theories, ranging from Goudsmit and Furry's notion that the phenomenon is the product of "the way we write numbers" to Furlan's theory that Benford's law reflects a profound "harmonic" reality of nature. Hill, a mathematician, did not produce a proof for Benford's law and illustrate its application to stock market data, census information, and accounting data until 1995. Like the normal distribution, Benford's distribution is an experimentally observable occurrence, he emphasised. Hill's demonstration relies on the fact that the distributions of the numbers in sets that adhere to the Benford distribution are second generation distributions or composites of other distributions [17].
If distributions are chosen randomly, and samples are drawn randomly from each distribution, then the significant digit frequencies of the combined samplings will converge to Benford's distribution, even if the individual distributions do not strictly adhere to the law. The secret is in combining numbers from various sources.
Materials and Methods
Import the data
AAER_firm_year.csv
data_FraudDetection_JAR2020.csv
dummyFInancialData.csv
englandUnfiltered.xlsx
JA_2005-2012.csv
JA_2013-2018.csv
Q1_2005-2012.csv
Q1_2013-2019.csv
Q2_2005-2012.csv
Q2_2013-2019.csv
Q3_2005-2012.csv
Q3_2013-2019.csv
Clean the data and create some test data so that it can be used in the code
Make a single column.csv file so the program can read all the numbers.
AAER_firm_year_filtered.csv
arizonaFraud.csv
dummyAmount.csv
dummyOldAccount.csv
englandFiltered.csv
JA2005.csv
JA2013.csv
Q12005.csv
Q12013.csv
Q22005.csv
Q22013.csv
Q32005.csv
Q32013.csv
testdata.csv
testdata2.csv
Write a code which can show digit distribution and calculate root mean square error
The python script I wrote for the analysis.
import csv
import numpy as np
import matplotlib.pyplot as plt
benford_law={1:30.1, 2:17.6, 3:12.5, 4:9.7, 5:7.9, 6:6.7, 7:5.8, 8: 5.1, 9: 4.6}
def read_csv(path):
all_values=[]
data=open(path, encoding="utf-8")
csv_data=csv.reader(data)
for num in csv_data:
all_values.extend(num)
return all_values
def get_first_digit(values_list):
first_digits=[]
for num in values_list:
first_digits.append(int(str(num)[0]))
return first_digits
def assign_first_digits(digits_list):
amount_first_digits={}
for i in range(1, 10):
amount_first_digits(i)=digits_list.count(i)
return amount_first_digits
def digits_percentage(digits_dic, lengt):
first_digits_percentage={}
for i in range(1, 10):
first_digits_percentage[i]=(float(digits_dic[i])/lengt)*100
return first_digits_percentage
def show_graphs(assume, given):
n=19
data_means=(0, 0, 0, 0, 0, 0, 0, 0, 0, 0, assume [1] assume[2], assume[3], assume[4], assume[5], assume[6], assume[7], assume[8], assume[9])
benford_means=(given[1], given[2], given[3], given[4], given[5], given[6], given[7], given[8], given[9], 0, 0, 0, 0, 0, 0, 0, 0, 0, 0)
ind=np.arange(n)
width=0.50
error=0
for i in range(1, 10):
square=(given[i] -assume[i])*(given[i]-assume[i])
error += square
final_error=error/9
final_error_root=np.sqrt(final_error)
final_error_root_str=str(final_error_root)
p1 = plt.bar(ind, benford_means, width)
p2 = plt.bar(ind, data_means, width, bottom=benford_means)
plt.ylabel('Percentages')
plt.title("Benford law analysis with error "+final_error_root_str)
plt.xticks(ind, ('1', '2', '3', '4', '5', '6', '7', '8', '9', '|', '1', '2', '3', '4', '5', '6', '7', '8', '9'))
plt.yticks(np.arange(0, 40, 2.5))
plt.legend((p1[0], p2[0]), ('Benford\'s', 'Our Data'))
plt.show()
csv_list=read_csv('filename.csv')
first_digit_list=get_first_digit(csv_list)
first_occurrence_dict=assign_first_digits(first_digit_list)
digits_percentage_dict = digits_percentage(first_occurrence_dict, len(first_digit_list))
show_graphs(digits_percentage_dict, benford_law)
Chart the actual count to the expected count of leading digits
Figures 1 and 2 with test data show that the model works and give expected error values.

Figure 1: Test data.

Figure 2: Test data 2.
Figures 3 to 10 with the large data sets of Wirecard with small frauds moderately follow Benford’s law showing small error values although not fitting the distribution closely.

Figure 3: JA2005.

Figure 4: JA2013.

Figure 5: Q12005.

Figure 6: Q12013.

Figure 7: Q22005.

Figure 8: Q22013.

Figure 9: Q32005.

Figure 10: Q32013.
Figure 11 shows the distribution of Bank of England’s (BoE) data with 3.07 error, showing that the data might have some inaccuracies as it is hundreds of years old.

Figure 11: England filtered.
Figures 12 and 13 show the distribution of dummy data. Figure 12 shows high error as there is a high amount of 0 values in the dataset. Figure 13 follows close relation to the Benford’s distribution.

Figure 12: Dummy old account.

Figure 13: Dummy amount.
Figures 14 and 15 show the distribution of Fraud data sets. Both show high errors as they do not follow Benford’s law. Thus the program is able to determine the fraudulent data.

Figure 14: AAER firm year filtered fraud.

Figure 15: Arizona fraud.
Nelson was found guilty of trying to cheat the state of $2 million, as depicted in Figure 15. Nelson, a manager in the Arizona state treasurer's office, asserted that he diverted funds to a fictitious vendor to demonstrate the lack of safeguards in a new computer system. Below are the dollar values of the 23 bogus checks (Table 2).
| Date | Amount |
|---|---|
| October 9 | $1,927.48 |
| 27,902.31 | |
| October 14 | 86,241.90 |
| 72,117.46 | |
| 81,321.75 | |
| 97,473.96 | |
| October 19 | 93,249.11 |
| 89,658.17 | |
| 87,776.89 | |
| 92,105.83 | |
| 79,949.16 | |
| 87,602.93 | |
| 96,879.27 | |
| 91,806.47 | |
| 84,991.67 | |
| 90,831.83 | |
| 93,766.67 | |
| 88,338.72 | |
| 94,639.49 | |
| 83,709.28 | |
| 96,412.21 | |
| 88,432.86 | |
| 71,552.16 | |
| Total | $1,878,687.58 |
Table 2: Fraud Arizona data.
Since no services were ever rendered, Nelson must have made up all the numbers in his system, and because individuals are not random, it is improbable that manufactured numbers will adhere to Benford's law. There are various indications that the numbers in Table 2 are fictitious. First, Nelson began with modest amounts, and then he increased them. The increases were substantial, at least up to the $100,000 mark. The majority of the payments were barely below $100,000. It is feasible that checks written for sums exceeding $100,000 might require human signatures rather than being written automatically. Benford's law and the digit patterns of check amounts are almost inverses. Over ninety percent of the amounts begin with a 7, 8, or 9 if each vendor was compared to Benford's law, this group of figures would have had a low degree of conformance with the law.
The numbers appear to have been chosen in a random manner. There were no duplicate check amounts, no round numbers, and all check amounts included cents. However, the boss subconsciously repeated certain digits and digit combinations. When examining the first two digits of the fictitious figures, 87, 88, 93, and 96 were all utilized twice. For the final two digits, the numbers 16, 67, and 83 were replicated. There was a substantial bias toward the higher digits in general (i.e., regardless of where the digit appeared in the number), with digits 7 through 9 being the most common. 160 digits were utilized in the 23 numerals. The ten digits from 0 to 9 have corresponding counts of 7, 19, 16, 14, 12, 5, 17, 22, 22, and 26. These supposedly "random" numbers did not adhere to Benford's law and would have warranted a review as a result. Nelson was freed from an Arizona state institution after completing three years and four months of his five years prison sentence [18].
Results and Discussion
The lack of accurate fraud records poses a significant obstacle to fraud detection. "Benford's law can act as a highly effective indicator of data error or fraud in accounting information," and "Benford's law can serve as an effective indicator of data problems in accounting information."
Nonetheless, there are two concerns: One intuitive and one statistical. First, intuitively, a significant difference will not be triggered if there are only a few fraudulent transactions, even if the total dollar amount is significant. Statistically, if the account being tested has many transactions, a smaller proportion of varying numbers will be required to indicate a significant deviation from the norm than if the account had fewer observations [19]. This is why many prepackaged programs, such as Benford's law based analytical test, urge auditors to test the entire account instead of taking a sample. Consider two accounts to illustrate the second point: One contains 10,000 transactions while the other contains only 1,000. If all 10,000 transactions in an account are used, a minimum difference of 75 transactions is required for a high error value. This represents a 0.75 percent share of the entire account.
In contrast, there would need to be 23 fraudulent entries (or 2.3% deviant entries) in the 1000 entry account before the error value is displayed. If a sample of 200 entries were selected, there would need to be six deviant entries or 3 percent for it to be statistically different than expected. Even though fraud data exists, the error rate is low even for our massive dataset of Wirecard information. In the case of Arizona or AAER firm data, however, where the dataset size is small, fraud data can be easily predicted.
In addition, there are other types of fraud that cannot be detected by Benford analysis because the examined data sets are unsuitable for such an analysis. For instance, duplicate addresses or bank accounts cannot be detected, but two employees with similar addresses may indicate ghost employees, or an employee whose address is a vendor's address may indicate a shell company. In addition, duplicate purchase orders or invoice numbers may indicate fraudulent payments or shell companies. In addition, Benford analysis does not detect contract manipulation, defective deliveries, or defective shipments. The question of what additional tests could supplement Benford's analysis arises [20]. This arsenal consists of personal observations of assets, external verification, a keen awareness of corporate culture, knowledge of the examined firm's performance relative to others in the industry, and a healthy scepticism toward management explanations of deviations in their records.
Conclusion
Benford’s law was a good tool to predict errors in small datasets. However, as the size of the dataset increased, Benford’s law started losing utility as a fraud detector. Therefore, we do not view our methodology as the ultimate anti-fraud tool but rather as a robust procedure that should be supplemented with additional data. We endorse the integration of our method's signals with those derived from alternative statistical techniques and less technical model free analyses that can be applied to a limited number of traders. We view our method as a suitable automatic tool for selecting the most intriguing cases for additional qualitative and quantitative research while maintaining control over the statistical properties of the selected tests.
Is Benford's law effective for detecting fraud in statistical and scientific data reports? The probability of "false positives" and "false negatives" must be low for a test to be valid. Nevertheless, it is highly questionable whether the Benford distribution is suitable for distinguishing between manipulated and unmanipulated estimates. Additional research should concentrate more on the test's reliability, and test results should be interpreted more carefully. Given the low accuracy of tests in the application of Benford's law, the related research focuses primarily on enhancing three aspects: The scope of the test, the combination with other models, and the analysis of test results.
Ethics approval and consent to Participate
Not applicable.
Consent for Publication
Not applicable.
Availability of Data and Material
The datasets generated and/or analysed during the current study are available in the Github repository, https://github.com/ rakshit271205/LS190RakshitKaushik.git.
Competing Interests
The author declares that he has no competing interests.
Funding
No funding was required for the research.
Author´s Contributions
RK analysed the data, cleaned the data files, wrote the data science model’s scripts, and analysed the final outputs. All authors (RK) read and approved the final manuscript.
Acknowledgements
Gregory M. Kapfhammer provided the ethical approval on the study.
References
- Dechow PM, Dichev ID. The quality of accruals and earnings: The role of accrual estimation errors. Account Rev. 2002;77(1):35-59.
- Patricia M. Dechow, Dichev ID. The quality of accruals and earnings: The role of accrual estimation errors. JSTOR. 2002.
- Benford F. The law of anomalous numbers. Proc Amer Phil Soc. 1938;78:551-572.
- Dechow PM, You H. Analyst’s motives for rounding EPS forecasts. Account Rev. 2012;87(6):1939-1966.
- Gee J. The financial cost of fraud 2018: The latest data from around the world. Crowe Audit. 2018;1-20.
- Hill T. A Statistical derivation of the significant digit law. Stat Sci. 1995;10(4):54-363.
- Indrabudiman A, Hidayat T. Analysis Benford law for company evidence from Indonesia. IJESRT. 1995;5(11):1187-1207.
- Iranian Committee on Accounting Standards (ICAS). Accounting and auditing principles and standards: Standards on Auditing. 2011.
- Khanghah J, Mosavi F. A review of studies and concepts of accounting and auditing fraud. Studies of Accounting and Auditing. 2015;16(4):58-73.
- Kordestani Gh, Tatli R. The review of earnings management in different level of conservatism and institutional investors base Benford law. Iran Account Audit Rev. 2016;23 (1):73-96.
- Lalit W, Virender P. Forensic accounting and fraud examination in India. Int J Appl Eng. 2012;7(11):1-4.
- Lavion D. Pulling fraud out of the shadows: Global economic crime and fraud survey. PwC. 2018;s1-s30.
- Mille S. Benford's Law: Theory and applications. Princeton University Press. 2015.
- Mohammadi M, Salehirad M, Hajizade S. Identifying the cosmetic earning management by using Benford's Law. J Audit Sci. 2011;45(2):51-67.
- Shiri M, Pishva F, Khalatbari H. The prediction of earnings manipulation: Development of a model. Iran Account Audit Rev. 2016;23(2):213-234.
- Nia SH. Financial ratios between fraudulent and non-fraudulent firms: Evidence from Tehran stock exchange. J Account Tax. 2015;7(3):38-44.
- Nigrini M. Benford’s law: Application for forensic accounting. Auditing and Fraud Detection John Wiley and Son. 2012;6:109-129
- Owens E, Wu J, Zimmerman J. Business model shocks and abnormal accrual models. SSRN Electronic J. 2013.
- Papanikolaou NI, Grammatikos T. Using BenFord’s law to detect fraudulent practices in banking industry. J Appl Finan Bank Practi.
- Sweet P. Global cost of fraud tops £3 trillion. Accountancy Daily. 2018.
Citation: Kaushik R (2025) Using Benford’s law and RMSE to Predict Financial Fraud Using Firm-Reported Data. Int J Account Res. 13:404.
Copyright: © 2025 Kaushik R, et al. This is an open access article distributed under the terms of the Creative Commons Attribution License, which permits unrestricted use, distribution, and reproduction in any medium, provided the original author and source are credited.