


Indexed In
- Open J Gate
- Genamics JournalSeek
- ResearchBible
- RefSeek
- Directory of Research Journal Indexing (DRJI)
- Hamdard University
- EBSCO A-Z
- OCLC- WorldCat
- Scholarsteer
- Publons
- MIAR
- Euro Pub
- Google Scholar
Useful Links
Share This Page
Journal Flyer
Open Access Journals
- Agri and Aquaculture
- Biochemistry
- Bioinformatics & Systems Biology
- Business & Management
- Chemistry
- Clinical Sciences
- Engineering
- Food & Nutrition
- General Science
- Genetics & Molecular Biology
- Immunology & Microbiology
- Medical Sciences
- Neuroscience & Psychology
- Nursing & Health Care
- Pharmaceutical Sciences
Review Article - (2023) Volume 12, Issue 4
Rate and Equilibrium Constants of O2-Binding and O2 Release: “The Forward and Reverse Steps for the TState → RState Change for Human Hb4/BPG, Under Standard Conditions”
Francis Knowles*, Samantha Doyle and Douglas MagdeReceived: 20-Jul-2023, Manuscript No. BABCR-23-19475; Editor assigned: 24-Jul-2023, Pre QC No. BABCR-23-19475 (PQ); Reviewed: 08-Aug-2023, QC No. BABCR-23-19475; Revised: 14-Aug-2023, Manuscript No. BABCR-23-19475 (R); Published: 22-Aug-2023, DOI: 10.35248/2161-1009.23.12.502
Abstract
Three unknown quantities describe the O2-equilibrium binding curve for fractional saturation of human hemoglobin in red blood cells, under standard conditions: Kα, the O2-binding constant of equivalent Tstate α-chains; KΔ, the equilibrium constant for the Tstate → Rstate transition; Kβ, the O2-binding constant of equivalent Rstate β-chains. The model for formulation of the equation of state is a 3-stage ordered sequence of reactions.
Values of Kα, KΔ and Kβ were established by determination of rate constants for the oxygenation reaction and the dithionite-mediated de-oxygenation reaction. The rate law for the forward reaction in the presence of excess O2 yields kα, kΔ, k-Δ, and kβ. The rate law yields k-β, k-Δ, kΔ, and k-α for the dithionite-mediated deoxygenation reaction. Rate constants for binding O2 are pseudo 1st-order. Rate constants for release of O2 are 1st-order. Reactions involving O2: I→II, II→I, III→IV; are 2-step ordered sequences of equivalent subunits: αα, ββ. Progress curves for a 2-step ordered sequence of equivalent chains collapse to a first order reaction. Kα=kα/ k-α=8.53 × 10³ L/mol; Kβ=kβ/k-β=2.38 × 105 L/mol. Progress curves for both oxygenation and dithionitemediated de-oxygenation reactions return KΔ. KΔ is 0.0580 for the oxygenation reaction and 0.0358 for the dithionite-mediated de-oxygenation reaction. The corresponding values from the O2-equilibrium binding curve are: Kα=15.09 × 10³ l/mol; Kβ=3.94 × 10⁵ L/mol: KΔ=0.02602. Values of Kα, KΔ, and Kβ determined from rate constants of progress curves for oxygenation and dithionite-mediated de-oxygenation reactions are close to values determined by fitting of the O2-equilibrium binding curve for whole blood, under standard conditions, to the Perutz/Adair equation. Data for the dithionite mediated de-oxygenation reaction may be most reliable insofar as errors in knowledge of the concentration of di-oxygen do not enter into consideration.
Keypoints points
• The manuscript examines rate equations based on the model expressed by the Perutz/Adair equation
• Rate equations are presented for: (i) the reaction of DHb4/BPG with O2 and (ii) the reaction of (HbO2)4/ BPG with dithionite.
• Rate constants obtained from progress curves for these reactions can be used to predict equilibrium constants defining Kα, Kβ and KΔ. These results confirm the values for Kα, Kβ and KΔ obtained by fitting O2-equilibrium binding data for whole blood, under standard conditions, to the Perutz/Adair equation.
Keywords
Cooperative subunit assemblies; Ordered reaction sequence; Reaction rates; Bisphosphoglycerate; Structure changes; Biophysics; Kinetics; Red blood cells; Human hemoglobin
Introduction
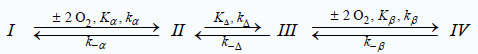
Previous communications established a model accounting for the O2-equilibrium binding curve of the binary complex of human Hb4 (UniProtKB-P69905 (HbA_Human) and BPG. The model presented in Scheme 1 accounts for the sequence of reactions taking place in RCBs at the constant pH of 7.4. pH-Values decrease in the systemic circulations and increase in the pulmonary circulation. Changes in RBC pH-values occurring in the systemic and pulmonary circulations are not, however, addressed. BPG is represented as either a bullet or an open circle. A bullet indicates BPG bound to Tstate structures, species I and II. The open circle indicates BPG bound to Rstate structures, species III and IV. ΔG°=- 33.7 kJ/mol at 25°C for binding BPG with E-free R(α*, β*) yielding species I, T(α*●β*). Conversion of the Tstate back to the Rstate will require, at first glance, an input of -33.7 kJ/mol. ΔG°=-10.5 kJ/mol at 37°C for binding BPG with Rstate structures, species III and IV [1-4].
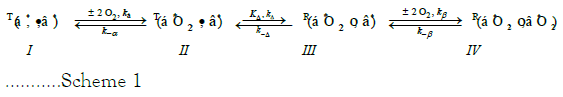
Scheme 1: Symbolic Representation of the Sequence of Reactions in the Conversion of Hb4/BPG to (HbO2)4/BPG in RBCs. Rate constants are defined as being the value obtained with hypothetical monomeric α- and β-chains. Upper left T or R assigns conformational state. An upper right asterisk, *, denotes equivalent O2-binding of multiple subunits. A bullet, ●, represents BPG bound to Tstate structures. An open circle represents BPG bound to Rstate structures.
The first stage in oxygenation of Hb4/BPG, conversion of species I to species II, consists of a sequence of two reactions in each of which O2 binds to Tstate Scheme 2 moieties of each α-chain, reacting equivalently. Structural states, indicated by left superscripts, T or R, apply to either a single subunit or all subunits within parentheses.
Equivalent reactivity, indicated by a right superscript asterisk, *, is defined in Figure 1 for the pair of Tstate α-chains

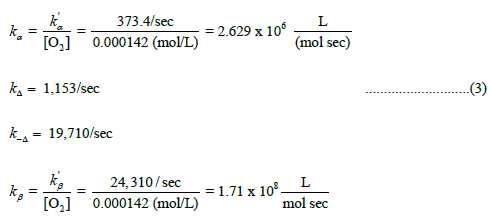
Figure 1: Progress curve for reaction # 2017_08_02_004: Hb4/BPG
with di-oxygen at 21°C. The best fitting values for k1, k2, k3, and k4 (kꞌα, kΔ, k-Δ, kꞌβ are: 373.4/sec; 1,153/sec; 19,710/sec; 24,310/sec. The
correlation coefficient for observed and predicted values of ΔA at time,
t, is calculated from best fitting values and the rate law. Note:  Predicated values of ΔAt

Scheme 2: Equivalent binding in multi-subunit protein assemblies is defined as the equilibrium constant, Kα, for an isolated α-chain, the properties of which are not modified by removing the α-subunit from the entire assembly. A similar statement can be made for an isolated β-chain.
The equilibrium constant for the first Tstate α-chain to bind O2 is: 2 Kα/k-α=2 Kα. The equilibrium constant for the second Tstate α-chain O2-binding reaction is: (Kα/(2 k-α)=Kα/2. The rate law for a 2-step ordered sequence of equivalent first order or pseudo first order reactions collapses to a first-order rate equation (Appendix A). Similar comments apply to the third stage, conversion of species III to species IV, consisting of a sequence of two reactions in which O2 binds to Rstate β-chain Scheme 2 moieties, reacting equivalently. The 1st-step for oxygenation is carried out where pseudo 1st-order kinetics is observed.
The 2nd-step, species II going to species III, accounts for an endothermic change in the structure of the globin moiety, from Tstate to Rstate. The endothermic structure change is coupled to (i) exothermic conversion of Tstate Tα*O2 chains to Rstate Rα*O2 chains and (ii) exothermic formation of a binary complex with Rstate structures, BPG/(Rstate structure), Rstate structures being species III or IV of Figure 1. The 2nd-step is reversible and does not involve an O2-binding reaction [5-8].
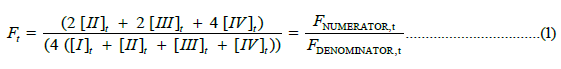
Under pseudo 1st-order conditions the kinetic model for the oxygenation sequence is comprised of 4 unknown quantities:
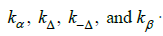
In this instance species I is T(Hb4/BPG) and species IV is R((HbO2)4/BPG). Dithionate mediated de-oxygenation reactions are first order. The kinetic model for the dithionite mediated deoxygenation sequence is comprised of 4 unknown quantities: k-β, k-Δ, kΔ, k-β. Both kinetic models are summarized in Scheme 3.
Scheme 3: Kinetic models for the oxygenation sequence and the dithionite mediated de-oxygenation sequence.
This communication seeks to confirm the model presented in Figure 2, in terms of rate constants and equilibrium constants: Kα=kα/k-α; Kβ=kβ/k-β. KΔ=kΔ/k-Δ for the oxygenation reaction and KΔ=k-Δ/kΔ for the de-oxygenation reaction. Values of Kα, Kβ, and K determined by thermodynamic and kinetic methods are required to be in agreement if the model presented in Figures 3, is to be considered as a description of the reversible sequence of events accompanying the conversion of Hb4 to (HbO2)4 in the presence of BPG, under standard conditions, in human red blood cells [9-11].

Figure 2: Comparison of observed and predicted values of for oxygenation of Hb4/BPG. The observed values of are shown in Figure 6. Predicted values of absorbance are calculated using the best fitting values for kα, kΔ, k-Δ, kβ. Note: y=0.9929x-0.0016

Figure 3: Progress curve for reaction # 2017_10_17_017: Reaction of (HbO2)4/BPG with 0.0611 M Dithionite, 0.05 M BisTris,0.050 KCl, pH 7.4 34.5°C. The correlation coefficient for observed and predicted values of ΔA at time, t, was calculated from best-fitting values of observed rates, the rate law, and experimentally observed values of t: 0.9995.
Materials and Methods
Preparation of cell-free Hb4/BPG binary complex
Red blood cells, collected by centrifugation of freshly drawn blood, were washed three times by: (i) suspension in 0.1 M NaCl and (ii) sedimentation by centrifugation. Washed RBCs were lysed by suspension in three volumes of 0.05 M BisTris, pH 7.4. The pH of the stock solution of BisTris was adjusted with HCl. Red blood cells were resealed by addition of solid NaCl to a final concentration of 0.1 M NaCl. Resealed RBCs were collected by centrifugation at 10,000 rpm for 1 hr. The supernatant solution is the binary complex (HbO2)4/BPG. The cell-free supernatant solution was used in experiments to establish the progress curves for the reaction of Hb4/BPG with excess O2 and the progress curves for reaction of (HbO2)4/BPG with dithionite.
Kinetics of reaction
Stopped flow observations of progress curves were carried out with a Durrum-Gibson stopped flow instrument manufactured by Dionex, Sunnyvale, CA, Model D-110. The stopped flow spectrophotometer was fitted with stainless steel drive and stopping syringes (Knowles, 1979). Temperature controlled circulating water was pumped directly into the jacketed observation chamber and drained through the main water bath containing the syringe block. Photomultiplier voltage was monitored by a Picoscope ADC 212 Virtual Oscilloscope. Triggering for data collection preceded onset of mixing. Voltages were transferred into Excel for conversion to absorbance at a known time, At. Progress curves, At, at corresponding values of time, t, were transferred to MatLab files for determination of the best-fitting values of rate constants. Figures were composed in EXCEL. Reaction of Hb4/BPG with O2 was observed at 560 nm. Reaction of (HbO2)4/BPG with dithionite was observed at 578 nm.
Results
Rate laws
The model on which the Perutz-Adair equation is based, described in Figures 1 and 3 predicts that progress curves for the binding of O2 by Hb4/BPG will obey a 3-stage ordered sequence. The rate law describing the progress curve for reaction of Hb4/BPG with excess O2 yields pseudo 1st-order values: kꞌα and kꞌβ, where kα= kꞌα/ [O2] and kβ=kꞌβ/[O2]; and KΔ=kΔ/k-Δ. Similarly, the progress curve for the dissociation of O2 in the presence of excess dithionite will appear to be a 3-stage ordered sequence. The progress curves for reaction of (HbO2)4/BPG with dithionite yields 1st-order rate constants for release of O2 from both α- and β-chains, directly: k-β; k-α; and KΔ=kΔ/k-Δ. Insofar as these rate laws describe a pseudo 1st-order equation and a 1st-order equation, it is not necessary to capture 100% of the progress curve in order to determine the values of kꞌα, kꞌβ, k-β, k-α, kΔ and k-Δ. Proof that an ordered sequence of equivalent 1st-order reactions or pseudo 1st-order reactions simplify to a 1st-order expression is given in Appendix A. Bateman equations describe the time-dependence of the concentration of intermediate species. Separate Bateman equations exist for species II and III. These equations contribute to the definition of fractional saturation, Ft=At/A∞, the value of Ft being taken from the progress curve at At and A∞. Progress curves are presented as absorbance at time=t versus time, t.
Formulation of equations of state for: (i) Rate of the O2 binding reaction of Hb4/BPG and O2 and (ii) Rate of O2 release from (HbO2)4/BPG
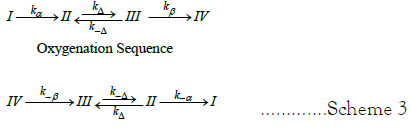
The predicted time dependence of the concentration of species I, II, and III are given in Figure 4 (Equation 1) Scheme 4. Time dependence of species IV, [IV]t, is defined as follows: [IV]t=[I]o –[I]t– [II]t – [III]t.

Figure 4: Progress curve (number 2017_10_17_017) of observed and predicted values of absorbance for de-oxygenation of (HBO2)4/bpg with dithionite. Conditions of reaction are: 0.0611 m sodium dithionite, 0.050 m bistris, 0.050 m kcl, ph 7.4 with hcl, 34.5°C. Note: y = 0.9981x - 0.0008 R2 = 0.9995
Scheme 4: Rate equation for the time dependence of [I]t. bateman equations for time dependence of concentration of intermediate species [II]t and [III]t.
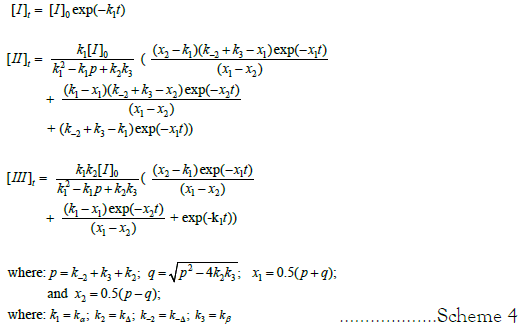
Fractional saturation of Hb4/BPG with O2 at time, t, is defined as follows:
Substituting the analytical expression for [IV]t into FDENOMINATOR,t, rearranging, combining like terms and carrying out summations leads to FDENOMINATOR, t=4 [I]o. In FNUMERATOR, t the term for species [IV]t is replaced by its analytical expression resulting in Scheme 4 (Equation 2).
FNUMERATOR,t=4 ( [I]o–4 [I]t–2 [II]t –2 [III]t ). Ft, then, is defined as follows:
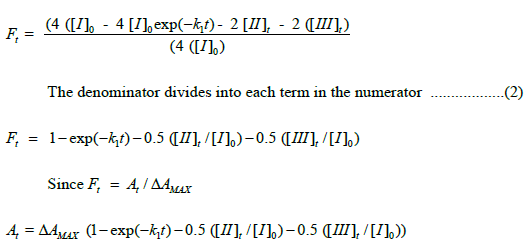
Analytical expressions for [II]t and [III]t contain the term [I]0. Substitution of analytical expressions for species [II]t and [III]t results in elimination of [I]0. The rate law for Ft is presented in Scheme 5.
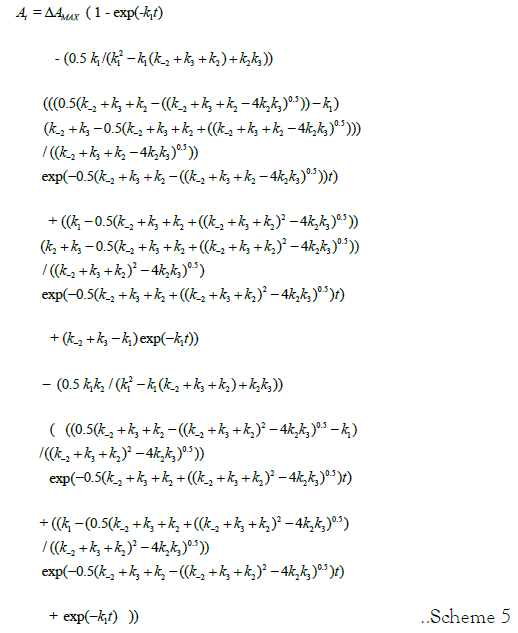
Scheme 5: Rate Law for the progress curve of the oxygenation reaction of Hb4/BPG. The equation, separated into sections representing concentration of species [I]t, [II]t, [III]t, and [IV]t is a single line of text. k1=kα; k2=kΔ; k-2=k-Δ; k3=kβ The rate law also describes the dithionite-mediated de-oxygenation reaction: k1=k-β; k2=k-Δ; k-2=kΔ; k3=k-α.
Calculation of rate constants for the oxygenation reaction
A progress curve for the reaction of Hb4/BPG with O2 is illustrated in Scheme 5. The progress curve was fitted by the rate law outlined in Scheme 5. The magnitude of the absorbance excursion, ΔAMAX, can be read: (i) directly from the progress curve or (ii) treated as an unknown and determined from curve fitting procedures. Procedure (ii) provides a more precise estimate of the value of ΔAMAX. The value of ΔAMAX would then be inserted into the curve-fitting algorithm prior to determination of the best fitting values for the pseudo-first-order rate constants: kα, kΔ, k-Δ, kβ.
The progress curve of Figure 1 was compared to data simulated using the rate law, the best fitting values for the rate constants, and experimental values of t. Predicted absorbance excursions are plotted against observed absorbance excursions in Figure 2. The result is expected to be linear: ΔAPREDICTED=ΔAOBSERVED. The result for the best fitting straight line is: ΔAPREDICTED=0.9792 ΔAOBSERVED –0.005.
Calculation of rate constants for the progress curve illustrated in Scheme 5 is described below. Pseudo 1st-order rate constants, kꞌα=kꞌβ, as well as absolute rate constants, kΔ and k-Δ, are returned by the curve fitting procedure in (Equation 3).
Calculation of rate constants for the de-oxygenation reaction with dithionite
The progress curve for reaction of (HbO2)4/BPG with 0.00611 M dithionite at 35.4°C, is illustrated in Figure 3. The progress curve was fitted to the kinetic model for the de-oxygenation reaction, Scheme 3. The best fitting values for are: 718.7/sec; 1,143/sec; 41/sec; 309.2/sec, respectively. The correlation coefficient for the curve fitting procedure was 0.9994.
The predicted progress curve, ΔAt, is compared with the observed progress curve, Figure 4. The progress curve, comprised of 483 data points over 40 m/sec, was predicted using the equation of state for the rate law, and best fitting values for the four rate constants. The result is expected to be linear: ΔAPREDICTED=ΔAOBSERVED. The result for the best fitting straight line is: ΔAPREDICTED=0.9981 ΔAOBSERVED –0.0008, a close approximation of a straight line [12-15].
Rate constants for the progress curve illustrated in Figure 4, returned by the curve fitting procedure are: k-β= 718.7/sec; k-Δ=1143/sec; kΔ=41/sec: k-α=309.2/sec.
Calculation of equilibrium constants
Calculation of equilibrium constants for the three mechanistic steps comprising the pathway from Hb4/BPG to (HbO2)4/BPG, Scheme 1 are summarized below, together with the values of equilibrium constants obtained by fitting Roughton’s equilibrium binding data for whole blood, under standard conditions, to the Perutz/Adair equation. Data for the equilibrium constant for the structural change, Tstate to Rstate, revealed by the progress curves for both the oxygenation reaction and the dithionite-mediated deoxygenation reaction, are also included in Equation 4.
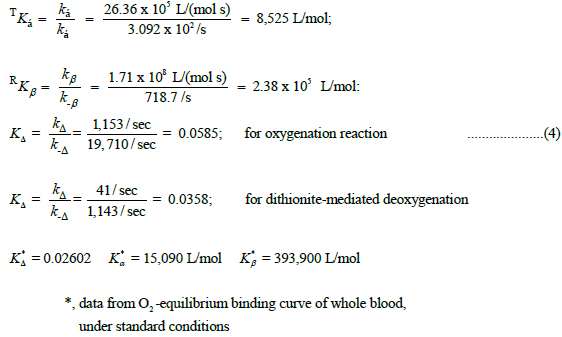
Equilibrium constants determined by kinetic methods are close to but not identical to those determined by thermodynamic methods at 37°C. Equilibrium O2-binding constants obtained by kinetic methods for both α-chains and β-chains are both lower than values based on thermodynamic methods by 40%. Progress curves for oxygenation reactions were carried out at 21°C. Progress curves for de-oxygenation reactions, in the presence of dithionite, were carried out at 34.5°C. Corrections based on the temperature dependence of the oxygenation reactions result in a much closer agreement for the values the values of Kα and Kβ returned by kinetic and thermodynamic methods. Further measurements of the oxygenation and de-oxygenation reactions with a thermally compliant cuvette assembly are justified.
Discussion
Architecture of allosteric structure
Hemoglobin, free of both O2 and BPG, does not exist in the RBC, in vivo. Species II, Figure 1, binding two O2 molecules can be considered the form of hemoglobin in RBCs with the lowest number of O2 molecules. BPG is a non-competitive inhibitor of R(α*,β*), the binary complex of BPG and R(α*,β*) being Species I. The elements of allosteric structure expressed in conversion of Species II to Species III relieve steric hindrace at the surface of Rstate β-chains. Binding of O2 by equivalent β-chains is free of allosteric mechanisms under standard conditions. The Bohr Effect in RBCs is exerted in response to changes in pH brought about by accumulation of CO2 during passage of RBCs through the systemic circulation and removal of CO2 in the pulmonary circulation. Standard conditions, pH 7.4, P(CO2)=40 torr, 37°C, do not acknowledge the cyclic variation in pH in the interior of RBCs as the venous drainage enters the pulmonary and systemic circulations, in that order.
The equilibrium constants for Kα and Kβ, based on the kinetics experiment are each lower by 40% than results returned by application of the Perutz/Adair equation to the O2-equilibrium binding curve for human blood, under standard conditions, at 37°C. Results for the O2-binding reactions were obtained at 21°C, 16°C lower than standard conditions. The rate constants, kα and kβ, then, are certainly lower than would be observed at 37°C. Temperature control at 34.5°C, close to standard conditions was established when the rate constants for the dithionite- mediated de-oxygenation reactions of hemoglobin were determined. A temperature correction would only need to be applied to the oxygenation reaction. Determination of rate constants for dithionite-mediated de-oxygenation reactions is less demanding then procedures for the oxygenation reactions. With oxygenation reactions, the O2-concentration must be accurately known. This condition does not exist when monitoring the progress curve of de-oxygenation reactions in the presence of dithionite. If one has confidence in equilibrium constants returned by the Perutz/Adair equation, rate constants for O2-binding reactions could be predicted from the product of the corresponding equilibrium constant and the observed rate constant for the dithionite-mediated deoxygenation reaction: kα, PRE=Kα, OBS k-α, OBS=1.77; Kβ, OBS k-β, OBS=1.66. Multiplication of the value of kα by a factor of 1.77 and of the value of kβ by a factor of 1.66, in this instance, predicts the exact values of the equilibrium constants for O2-binding reactions returned by the Perutz/Adair equation. These multiplication factors are quite reasonable. In the physiological context, the effect of temperature is described as Q10, describing the effect of temperature on a measured phenomenon. A value of 1 means there is no effect for a temperature range of 10°C. Increases in Q10 can be as high as 3. These considerations support the conclusion that the model presented in Figure 1, correctly describes the reaction of hemoglobin in red blood cells with O2.
Chain heterogeneity
Tstate α-chains are the only O2-binding species present in T(Hb4/ BPG). The Tstate → Rstate change in structure cannot occur until both Tα-chains have been converted to T(αO2)-chains. In the absence of BPG, in an E-free supporting electrolyte, RβO2-chains regulate the reactivity of α-chains. In the presence of BPG, α-chains participate in regulation of the reactivity of β-chains. Tstate α-chains maintain the structure establishing steric hindrance to approach of O2 to the distal surface of β-chain heme moieties. Rstate α*O2- chains maintain the structure permitting unhindered binding of O2 to the distal surface of β-chain heme moieties.
Equilibrium constant for the Tstate/Rstate structure change: Hot blood in mammals and birds
The equilibrium constant for the structure change, KC=0.02602, is significant. Following depletion of O2 from equivalent Rstate (βO2) chains, which possess very high affinity for O2, Rβ-chains revert to Tβ-chains, re-imposing distal side steric hindrance to approach of O2 to the distal surface of β-chains, effectively reducing the equilibrium binding constant of Rβ-chains from approximately 400,000 L/mol, at pH 7.4, to less than 100 L/mol. This allows diffusive release of O2 molecules from the RBC without a very limited possibility of O2 being recaptured by Rβ-chains. There is no use for high affinity Rβ-chains in the systemic circulation. The conformation change, Rstate → Tstate, ensures the highest possible rate of diffusion of O2 from RBCs. The concentration of O2 in the tissue irrigated by the systemic circulation can never rise so high as to donate O2 to RBCs. The value of KΔ, then, is the biophysical basis for high rates of resting metabolism in warm-blooded mammals and birds. The rate constant for the O2-binding reaction of Rstate β-chains collapses from approximately 400,000 L/(mol s) to less than 100 L/ (mol s) upon losing the second O2 molecule. It is scarcely possible to deliver O2 from RBCs to the organs of the systemic circulation faster.
Flash photolysis
Progress curves following flash photolysis of CO derivatives of hemoglobin are often inconclusive. Fast rates of recombination with CO have, without good reason, been taken to support the 2-state model (Monod et al. 1965). The progress curve following photolysis of anaerobic R((HbCO)4/BPG) in RBC lysates depends on the products of photolysis. Removing one CO molecule will generate two possible products: R(((HbCO)3(α))/BPG) with a single Rα-chain or R(((HbCO)3(β))/BPG) with a single Rβ-chain. In the case of R(((HbCO)3(α))/BPG), with a single Rα-chain, one would observe something new: reaction of an Rα-chain with CO. The R((HbCO)3(α))/BPG) tetramer would not relax to a Tstate molecule, the Rstate being stabilized by the large negative value of ΔG° released by binding of 3 molecules of CO. The fast reaction with CO, not observed in mixing experiments, can only be attributed to the R(α) component of R((HbCO)3(α))/BPG generated by a laser pulse that cannot make a distinction between the heme moieties of α-and β-chains. The progress curve following limited photolysis (less than 2%) of R((HbCO)4/BPG) in the presence of O2 can be attributed to simultaneous binding of O2 by Rα-chains and Rβ-chains, present in concentrations corresponding to the quantum yield of each chain. CO replacement reactions following O2-binding could then be monitored. The total time course following photolysis would yield rate constants for O2 binding to both α- and β-chains and CO replacement rates for O2- containing species.
Historical perspective
Using continuous flow methods, Roughton and Hartridge carried out the first observations of progress curves for reaction of carbon monoxide with oxyHb (1923) and reaction of oxyHb with dithionite (1923a). Roughton also developed accurate methods for determination of equilibrium binding curves for both O2 and CO, the first paper concerning O2 equilibrium binding curves appearing in 1931. Roughton attempted to account for his results in terms of the Adair model in which the conversion of Hb4 to (HbO2)4, was a sequence of four O2 binding reactions. Each step is described by an O2-equilibrium binding constant: K1=k1/k2; K2=k2/k-2; K3=k3/k-3; and K4=k4/k-4.

By the time of the haemoglobin symposium in memory of Sir Joseph Barcroft Roughton had established a well-defined program to describe the Adair model in physical chemical terms of reaction kinetics and thermodynamics. The goal was to determine (i) the value of the four equilibrium constants in the Adair equation of state defining fractional saturation of hemoglobin with O2 and (ii) the value of rate constants of progress curves for both the oxygenation reaction, in the presence of excess O2 and the deoxygenation reaction, in the presence of dithionite. If the four step Adair model had been, if fact, an accurate description of the mechanism by which the oxygenation reactions occur, it would be possible to determine real values for the four equilibrium constants and the eight rate constants. Statements concerning the scope of these investigations appeared as late as 1972 (Roughton et al.) Roughton and Gibson formed a liason in the years following the Barcroft Symposium. Development of the stopped flow kinetics spectrophotometer (Gibson, 1954) raised the possibility for achieving Roughton’s goals.
Redefinition of Adair’s hemoglobin model permits a full and complete achievement of the goals of Roughton and Gibson. The Perutz-Adair equation arises by combining the elements of the Perutz (stereochemical) model, accommodating chain heterogeneity, while reducing the number of O2 equilibrium constants in the sequential Adair equation from four to two: Kα and Kβ. Reduction of the number of unknown quantities for O2 equilibrium constants was realized by recognizing equivalent O2-equilibrium binding constants to the pair of α-chains and the pair of β-chains. In this manner, a sequence of four consecutive O2 binding reactions requires only two unknown quantities, not counting the dimensionless equilibrium constant for the Tstate to Rstate structural change. The structural (stereochemical) aspect of the redefined model provides a mechanism whereby chain heterogeneity is recognized and equivalent reactions by both α- and β-chains was established. Both equivalent α-chains react before both equivalent β-chains. Insofar as the 3-stage ordered-sequence is comprised of first-order or pseudo first-order reactions, rate constants are returned by any part of the progress curve captured by the kinetics spectrophotometer. The Perutz/Adair model is comprised of only six rate constants. These six rate constants describe three equilibrium constants: Kα, KΔ, Kβ. The three equilibrium constants are returned by the Perutz/Adair equation. Four of these rate constants originate with O2-binding reactions, two on-rates and two off-rates. Two rate constants originate from the structural change from Tstate to Rstate and from Rstate to Tstate. The challenge in unraveling the Perutz/Adair model requires only three experiments: (i) an O2-equilibrium binding curve; (ii) a progress curve for O2-binding: and (iii) a progress curve for de-oxygenation in the presence of dithionite.
Our initial estimates of rate constants for the oxygenation and deoxygenation reactions confirm the equilibrium binding constants of the α- and β-chains returned by the Perutz-Adair equation. This communication claims to have realized the goals of Roughton, fully describing the kinetic properties of each step in the sequential binding of four molecules of O2 by hemoglobin tetramers in RBCs of whole blood under standard conditions of temperature and pH: 37°C and pH 7.4. This was realized using cell free preparations of human blood in which the stoichiometric ratio of hemoglobin tetramers to the naturally occurring E-molecule, BPG, was maintained intact. The progress curves for the reaction of Hb4/BPG with O2 can be formulated as a Bateman equation for an ordered sequence of reactions Scheme 1 with the 1st and 3rd stages being comprised of pseudo first-order and first order reactions. The 2nd step represents the change from Tstate to Rstate. The same equation describes the progress curve for the de-oxygenation reaction of (HbO2)4/BPG with dithionite.
Conclusion
These results account for the classic demonstration of shattering of purple hexagonal crystals of Hb4/BPG, in the presence of O2, followed by re-crystallization of (HbO2)4/BPG in a new format, as scarlet colored needles.
Evaluation of these results and conclusions of these four manuscripts will be judged by their ability to clarify and account for larger aspects of respiratory physiology. Integration of reactions involving:
• Sequestering CO2 with simultaneous decrease of pH in RBCs in the systemic circulation
• Release of CO2 with simultaneous increase of pH in the pulmonary circulation.
Acknowledgements
Francis Knowles wishes to acknowledge assistance from Professor Gerald Boss, School of Medicine, Professors Ulrich Műller, Michael Tauber, Judy Kim, and Charles Perrin of the Department of Chemistry and Biochemistry, UCSD and the many helpful graduate students on the 3rd and 5th floors of Urey Hall, UCSD.
Accession Code
The accession code for adult human hemoglobin is: UniProtKB-P69905 (HbA Human).
References
- Knowles F. Architecture of Allosteric Structure Manuscript I
- Knowles F, Magde D. Architecture of Allosteric Structure Manuscript II
- Knowles F, Magde D. Architecture of Allosteric Structure Manuscript III
- DeBruin SH, Janssen LMH The Interaction of 2,3-Diphosphoglycerate with human hemoglobin. J Biol Chem. 1973; 248(8):2774-2777.
[Google Scholar] [PubMed]
- Knowles F. Stainless-steel syringes for stopped flow kinetics. Anal Biochem. 1979; 93(2): 407-408.
[Crossref] [Google Scholar] [PubMed]
- Monod J, Wyman J, Changeux JP. On the nature of allosteric transitions: A plausible model. J Mol Biol. 1965; 12: 88-118.
[Crossref] [Google Scholar] [PubMed]
- Roughton FJW, Hartridge H. The velocity with which carbon monoxide displaces oxygen from combination with haemoglobin. Proc R Soc Lond B. 1923; 94:336-367.
- Roughton FJW, Hartridge H. Kinetics of haemoglobin II Velocity with which oxygen dissociates from its combination with haemoglobin. Proc R Soc Lond A. 1923; 104:395-430.
- Roughton FJW, Forbes WH. The equilibrium between oxygen and haemoglobin: I the oxygen dissociation curve of dilute blood solutions. J Physiol. 1931; 71:229-260.
[Crossref] [Google Scholar] [PubMed]
- Adair GS (1925). The haemoglobin system VI the oxygen dissociation curve of haemoglobin. J Biol Chem. 1925; 63:529-5454.
- Roughton FJW. The intermediate compound hypothesis in relation to the equilibria and kinetics of the reactions of hemoglobin with oxygen and carbon monoxide. In Haemoglobin; a symposium based on conference held at Cambridge in June 1948 in memory of Sir Joseph Barcroft, ed. FJW Roughton and JC Kendrew, 83-93. New York. 1949.
- Roughton FJW, DeLand EC Kernohan JC, Severinghaus JW. In oxygen affinity of hemoglobin and red cell acid base status ed. 1972.
- Gibson GH. Stopped-flow apparatus for the study of rapid reactions. 1954; 17:137-139.
- Knowles F. Application of 19F NMR spectroscopy to a study of carbon monoxide binding to human hemoglobin modified at cys-β93 with the s-trifluoroethyl residue. Arch Biochem Biophys. 1984; 230:327-334
[Crossref] [Google Scholar] [PubMed]
- Haurowitz F. Das gleichgewicht zwischen haemoglobin und sauerstoff. Z Physiol Chem. 1938; 254:266-274.
Citation: Knowles F, Doyle S, Magde D (2023) Rate and equilibrium constants of O2-binding and O2 release: “The forward and reverse steps for the Tstate → Rstate change for human Hb4/BPG, under standard conditions”. Biochem Anal Biochem. 12:502.
Copyright: © 2023 Knowles F, et al. This is an open-access article distributed under the terms of the Creative Commons Attribution License, which permits unrestricted use, distribution, and reproduction in any medium, provided the original author and source are credited.