Indexed In
- Open J Gate
- Genamics JournalSeek
- Academic Keys
- JournalTOCs
- ResearchBible
- Electronic Journals Library
- RefSeek
- Hamdard University
- EBSCO A-Z
- OCLC- WorldCat
- Proquest Summons
- SWB online catalog
- Virtual Library of Biology (vifabio)
- Publons
- MIAR
- Euro Pub
- Google Scholar
Useful Links
Share This Page
Journal Flyer
Open Access Journals
- Agri and Aquaculture
- Biochemistry
- Bioinformatics & Systems Biology
- Business & Management
- Chemistry
- Clinical Sciences
- Engineering
- Food & Nutrition
- General Science
- Genetics & Molecular Biology
- Immunology & Microbiology
- Medical Sciences
- Neuroscience & Psychology
- Nursing & Health Care
- Pharmaceutical Sciences
Research Article - (2025) Volume 16, Issue 1
Proteomic Response of Tartary Buckwheat under Mercury-Induced Stress
Tanveer Bilal Pirzadah1,2*, Bisma Malik1,3 and Reiaz Ul Rehman12Department of Bioresources, Government Degree College for Women, Pulwama, Jammu and Kashmir, India
3Department of Bioresources, Government Degree College, Bijbehara, Jammu and Kashmir, India
Received: 21-Feb-2024, Manuscript No. JPP-24-24979; Editor assigned: 23-Feb-2024, Pre QC No. JPP-24-24979 (PQ); Reviewed: 04-Mar-2024, QC No. JPP-24-24979; Revised: 13-Feb-2025, Manuscript No. JPP-24-24979 (R); Published: 20-Feb-2025, DOI: 10.35248/2153-0645.25.16.125
Abstract
Mercury (Hg) is severe toxic pollutants that pose a threat to the environment. Its accumulation alters various metabolic pathways by inducing oxidative stress and ultimately affects yield. Present study was conducted to explore how tartary buckwheat modulates its proteome and biomarkers in response to Hg stress. Plants were exposed to Hg (75 μM) exposure for 15 days. Two-Dimensional Gel Electrophoresis (2-DGE) was used for resolving leaf proteome and differential protein expression was studied using PDQuest software. Results showed that hydrogen peroxide (H2O2) and Thiobarbituric Acid Reactive Substance (TBARS) exhibited a concomitant increase under Hg-induced oxidative stress. Proteomic analysis showed that about 213 protein spots were reproducibly detected in control and 174 protein spots were differentially expressed under Hg stress, among which 12 were up-regulated and 19 were downregulated. The differential protein expression suggests that tartary buckwheat modulates its leaf proteome subjected to Hg which might be an adaptive response mechanism by plants to Hg stress.
Keywords
Biomarker; Proteomics; Tartary buckwheat
Introduction
Heavy Metal (HM) pollution has gained a rapid momentum due to various anthropogenic and geogenic activities that leads to deterioration of soil quality and ultimately affects the yield of crops. Mercury (Hg) is a severe toxic pollutant regarded as “priority hazardous substance,” due to its toxic nature, solubility and mobility and extended biological half-life [1]. Hg is released into the soil through various routes viz., chemical fertilizers, pesticides and disinfectants [2]. Moreover, Hg exists in various forms in the soil such as; ionic (Hg2+), Methyl (MeHg), Sulfides (HgS), Elemental (Hg0), as well as Hydroxide (Hg(OH)2) among which Hg2+ is dominant in the agricultural soils and is readily available to plants [3]. The Hg toxicity in plants causes severe alterations in various metabolic pathways because of the Reactive Oxygen Species (ROS) generation which in turn reflect as different morpho-physiological attributes like shunted growth, chlorophyll degradation, membrane disruption, restrained aquaporins and inactivated enzyme [4]. Hg toxicity in plants is neutralized by phytochelatins or their precursors (cysteine and glutathione) as both possess strong affinity through sulfhydryl groups [5]. Besides, plants have innate anti-oxidative defense mechanism that plays a pivotal role to combat oxidative stress through signal transduction, and activating other defensive metabolic pathways. Yet, it is challenging to understand the complexity of toxic mechanism in plants and unravel cellular and biochemical targets involved in different pathways [6].
Therefore, there is an immediate need to screen the plants that can withstand the abiotic stress conditions. The, current study was investigated to unravel the effect of Hg on Tartary buckwheat plant by accessing biomarkers and using proteomics to unravel various proteins involved in defense system against the Hg stress.
Materials and Methods
Plant material and design of the experiment
Tartary buckwheat seeds were procured from University of Kashmir (Department of Botany). The viable seeds were surface sterilized (5% v/v sodium hypochlorite NaOCl) for 15 min, followed by rinsing for 1 h with distilled water. Plastic pots (8 cm diameter) containing 0.5 kg acid washed autoclaved sand were used for sowing of seeds. Pots were supplied with Hoagland nutrient solution (pH 5.5) during the experiment. The pots were maintained under controlled conditions (25 ± 2℃ with an 8 h photoperiod, relative humidity of 60%-70% and light intensity 300μmol m-2 s-1). Different concentrations (0, 25, 50 and 75 mM) of mercury chloride solution were processed in Hoagland nutrient solution and the treatments were given for 15 Days after Sowing (DAS). Experiments were done in replicates and were arranged in a completely randomized block design. Harvesting of the material was done at 15 days after sowing for further analysis.
Analysis of biomarkers
Biomarker analysis was done by estimating H2O2 and 2-Thiobarbituric Acid (TBA) content. H2O2 was quantified following the protocol of [7]. Lipid peroxidation was done according to the protocol of and was expressed as nmol/g fresh weight.
The quantity of H2O2 and TBARS content was measured following the equation:
H2O2 (μmol/g FW)=(1+227.8) × A390
A390 represents absorbance at 390 nm
TBARS content=(A532-A600) × V × 1000/ε × W
A532 and A600 denotes absorbance at 532 and 600 nm respectively
“V” represents extraction volume; “W” represents the tissue fresh weight “ε” represents molar extinction coefficient for MDA (ε=155 mM ÃÂ?¶1 cm ÃÂ?¶1).
Proteomics analysis
To analyse the proteome, protein extraction was done using the protocol of Bagheri et al. Briefly, frozen leaf were ground in liquid nitrogen and extracted in a buffer with pH 7.5 (30 mM Tris-Base, 2 mM EDTA, 2% PVP, 0.1% SDS, 0.07% β- mercaptoethanol, 1% triton × 100, 1 mM PMSF, 10 mM NaCl, 10% glycerol). The extract was then centrifuged for 1 h at 12,000 rpm (4℃). Protein precipitated was done with 10% chilled TCA consisting of β-mercaptoethanol (0.07%) and EDTA (2 mM) and left at -20℃ overnight followed by a spun at 20,000 rpm/15 min/4℃. Protein pellet was washed with prechilled acetone, dried under vacuum and solubilized in solubilization buffer with pH 3-10 (7.0 M urea, 2 M thiourea, 4% CHAPS, 50 mM DDT and 0.2% ampholytes) followed by a spun at 12000 rpm/5 min/RT. Bradford reagent was used for quantification of protein content with BSA as standard. Later, 200 μg protein was Iso-Electrically Focused (IEF) on Immobilized pH Gradient (IPG) strips of 11 cm (pH 4-7 NL; Bio-Rad USA) for 55000 Vh. The IPG strips were equilibrated using a solution of 130 mM DTT and 135 mM iodoacetamide. Later IPG strips were resolved on gels for second dimensional run (12% SDSPAGE) at 100 volts. Protein containing gels were stained with colloidal Coomassic blue G-250 dye followed by de-staining in distilled water. Calculation of spot densities from 2D gels were analysed by means of PDQuest software. The image analysis of both control and Hg-stressed samples was done and the protein spots were estimated depending upon their relative volume (whole set of spots: volume of single spot). Significant changes in the spots (quantitative changes more than two-fold in abundance) were considered.
Data analysis
Data was generated in replicates and were represented as mean ± SD. Data was also subjected to one-way Analysis of Variance (ANOVA) using Tukey’s test.
Results and Discussion
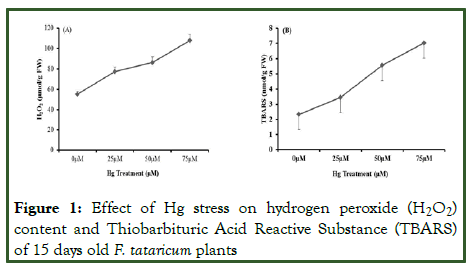
H2O2 and TBARS are essential indices and are considered as stress biomarkers in the plant stress biology. The data revealed that H2O2 concentration showed an inclined trend in a dosedependent manner under Hg-induced stress (Figure 1A) and the maximal content observed was 95.95% at 75 μM. Increase in H2O2 content in the present investigation might be due to its role as a secondary messenger in the signal transduction pathways that induces tolerance responses to Hg stress or it might be due to the feedback inhibition of H2O2 scavenging enzymes. Lipid peroxidation is estimated in terms of TBARS content and is considered as an essential stress biomarker [8]. Present data revealed that Malondialdehyde (MDA) concentration in 15 days old tartary buckwheat inclined in a concentration-dependent manner and maximal content found was 201% at 75 μM in comparison to control (Figure 1B). The increment in MDA concentration might be due to the disruption of membrane by production of free radicals [9]. Our data is supported by previous reports of Cd stress in Prunus; Hg stress in Brassica juncea; Cichorium intybus and Al stress in Fagopyrum species [10-15].
Figure 1: Effect of Hg stress on hydrogen peroxide (H2O2) content and Thiobarbituric Acid Reactive Substance (TBARS) of 15 days old F. tataricum plants
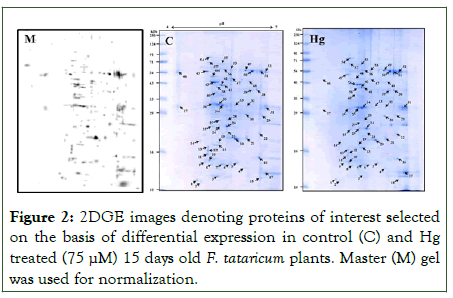
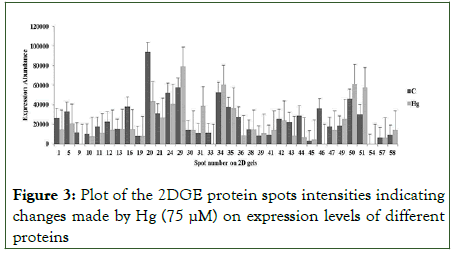
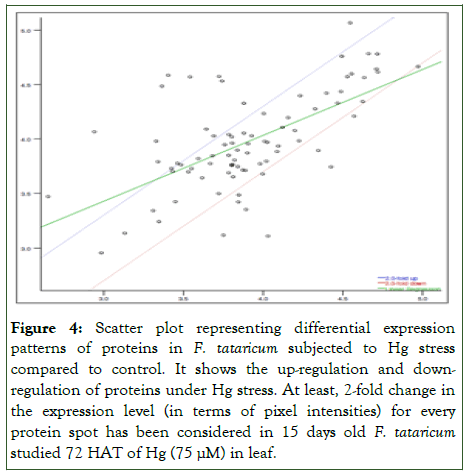
Result of PDQuest analysis of comparing 2D gels of tartary buckwheat proteins of control with 15 days old 75 μM Hg stress detected about 213 spots of proteins reproducibly on every gel (Figure 2). Out of 213 spots, 174 spots were differentially expressed in response to Hg stress, moreover, 12 spots were upregulated and 19 were down-regulated. Spot intensities with significant difference (more than 2-fold in abundance) have been depicted in Figure 3 and were selected for additional investigation. Scatter plot investigation was done showing 2-fold up-or down-regulation with respect to control (Figure 4). The differential protein expression suggests that tartary buckwheat modify its leaf proteome subjected to Hg stress which might be an adaptive mechanism of defense to Hg stress.
Figure 2: 2DGE images denoting proteins of interest selected on the basis of differential expression in control (C) and Hg treated (75 μM) 15 days old F. tataricum plants. Master (M) gel was used for normalization.
Figure 3: Plot of the 2DGE protein spots intensities indicating changes made by Hg (75 μM) on expression levels of different proteins
Figure 4: Scatter plot representing differential expression patterns of proteins in F. tataricum subjected to Hg stress compared to control. It shows the up-regulation and downregulation of proteins under Hg stress. At least, 2-fold change in the expression level (in terms of pixel intensities) for every protein spot has been considered in 15 days old F. tataricum studied 72 HAT of Hg (75 μM) in leaf.
Conclusion
In conclusion, the study showed that Hg caused oxidative stress in the Tartary buckwheat as observed by enhanced production of H2O2 and TBARS content. Besides, the Hg-induced oxidative stress modulates the leaf proteome as analysed by 2D-proteomics and PDQuest software. The proportion of the up-regulated protein was less (7%) compared to the proportion downregulated proteins (11%) of the total proteome. Thus, Hg downregulated more proteins than it up-regulates in the leaf Tartary buckwheat.
References
- Azevedo R, Rodriguez E. Phytotoxicity of mercury in plants: A review. J Bot. 2012;2012(1):848614.
- Bagheri R, Bashir H, Ahmad J, Iqbal M, Qureshi MI. Spinach (Spinacia oleracea L.) modulates its proteome differentially in response to salinity, cadmium and their combination stress. Plant Physiol Biochem. 2015;97:235-245.
[Crossref] [Google Scholar] [PubMed]
- Chang CY, Yu HY, Chen JJ, Li FB, Zhang HH, Liu CP. Accumulation of heavy metals in leaf vegetables from agricultural soils and associated potential health risks in the Pearl River Delta, South China. Environ Monit Assess. 2014;186:1547-1560.
[Crossref] [Google Scholar] [PubMed]
- Cobbett CS. Phytochelatins and their roles in heavy metal detoxification. Plant Physiol. 2000;123(3):825-832.
[Crossref] [Google Scholar] [PubMed]
- Elloumi N, Zouari M, Chaari L, Jomni C, Marzouk B, Ben Abdallah F. Effects of cadmium on lipids of almond seedlings (Prunus dulcis). Bot Stud. 2014;55:1-9.
[Crossref] [Google Scholar] [PubMed]
- Han FX, Su Y, Monts DL, Waggoner CA, Plodinec MJ. Binding, distribution, and plant uptake of mercury in a soil from Oak Ridge, Tennessee, USA. Sci Total Environ. 2006;368(2-3):753-768.
[Crossref] [Google Scholar] [PubMed]
- Heath RL, Packer L. Photoperoxidation in isolated chloroplasts: I. Kinetics and stoichiometry of fatty acid peroxidation. Arch Biochem Biophys. 1968;125(1):189-198.
[Crossref] [Google Scholar] [PubMed]
- Malik B, Pirzadah TB, Tahir I, Ul Rehman R. Growth and physiological responses in chicory towards mercury induced in vitro oxidative stress. Plant Physiol Rep. 2019;24:236-248.
- Pirzadah TB, Malik B, Tahir I, Irfan QM, Rehman RU. Characterization of mercury-induced stress biomarkers in Fagopyrum tataricum plants. Int J Phytoremediation. 2018;20(3):225-236.
[Google Scholar] [PubMed]
- Pirzadah TB, Malik B, Tahir I, Rehman RU, Hakeem KR, Alharby HF. Aluminium stress modulates the osmolytes and enzyme defense system in Fagopyrum species. Plant Physiol Biochem. 2019;144:178-186.
[Crossref] [Google Scholar] [PubMed]
- Sekmen AH, Turkan I, Tanyolac ZO, Ozfidan C, Dinc A. Different antioxidant defense responses to salt stress during germination and vegetative stages of endemic halophyte Gypsophila oblanceolata Bark. Environ Exp Bot. 2012;77:63-76.
- Sewelam N, Kazan K, Schenk PM. Global plant stress signaling: Reactive oxygen species at the cross-road. Front Plant Sci. 2016;7:187.
[Crossref] [Google Scholar] [PubMed]
- Shiyab S, Chen J, Han FX, Monts DL, Matta FB, Gu M, et al. Mercuryâ?induced oxidative stress in Indian mustard (Brassica juncea L.). Environ Toxicol. 2009;24(5):462-471.
[Crossref] [Google Scholar] [PubMed]
- Velikova V, Yordanov I, Edreva AJ. Oxidative stress and some antioxidant systems in acid rain-treated bean plants: protective role of exogenous polyamines. Plant Sci. 2000;151(1):59-66.
- Xu FJ, Li G, Jin CW, Liu WJ, Zhang SS, Zhang YS, et al. Aluminum-induced changes in reactive oxygen species accumulation, lipid peroxidation and antioxidant capacity in wheat root tips. Biol Plant. 2012;56:89-96.
Citation: Pirzadah TB, Malik B, Rehman RU (2025) Proteomic Response of Tartary Buckwheat under Mercury-Induced Stress. J Pharmacogenom Pharmacoproteomics. 16:125.
Copyright: © 2025 Pirzadah TB, et al. This is an open-access article distributed under the terms of the Creative Commons Attribution License, which permits unrestricted use, distribution and reproduction in any medium, provided the original author and source are credited.
