
Indexed In
- Online Access to Research in the Environment (OARE)
- Open J Gate
- Genamics JournalSeek
- JournalTOCs
- Scimago
- Ulrich's Periodicals Directory
- Access to Global Online Research in Agriculture (AGORA)
- Electronic Journals Library
- Centre for Agriculture and Biosciences International (CABI)
- RefSeek
- Directory of Research Journal Indexing (DRJI)
- Hamdard University
- EBSCO A-Z
- OCLC- WorldCat
- Scholarsteer
- SWB online catalog
- Virtual Library of Biology (vifabio)
- Publons
- MIAR
- University Grants Commission
- Euro Pub
- Google Scholar
Useful Links
Share This Page
Journal Flyer
Open Access Journals
- Agri and Aquaculture
- Biochemistry
- Bioinformatics & Systems Biology
- Business & Management
- Chemistry
- Clinical Sciences
- Engineering
- Food & Nutrition
- General Science
- Genetics & Molecular Biology
- Immunology & Microbiology
- Medical Sciences
- Neuroscience & Psychology
- Nursing & Health Care
- Pharmaceutical Sciences
Research Article - (2020) Volume 11, Issue 6
Monitoring of Water Quality and Zooplankton Community in Presence of Different Dietary Levels of Commercial Wood Charcoal of Red Tilapia
Ahmed M.M. Heneash and Ahmed E. Alprol*Received: 11-May-2020 Published: 20-Jun-2020, DOI: 10.35248/2155-9546.19.10.592
Abstract
The objective of this study assess the effects of physico-chemical parameters and dietary active commercial wood charcoal (CWC) levels on the zooplankton standing crop in addition to growth and biochemical of red tilapias in fifteen fish cement ponds for period an eight weeks feeding trial during 2019. The results declared that, water temperature, pH and salinity didn´t show any major differences among wood charcoal treatments when measured inside fish ponds, while dissolved oxygen, ammonia, moisture, ash and total lipid are significantly (P<0.05) enhancement affected by the increment in (CWC) levels. Mean range of physico-chemical factors were: temperature 28.1°C (Week 7) to 30.9°C (Week 0), salinty 8.4 ppt (Week 3) to 5 ppt (Week 6 & 7), pH 8.4 (Week 4) and 9 (Week 3), Dissolved oxygen 4.44 mg/l (Week 4) to 7.80 mg/l (Week 0) and ammonia 0.01-00.04 μg/l (Week 3) to 0.13 μg/l (Week 4). Biochemical and antioxidant parameters as moisture, ash and total lipid have significant differences (P >0.05) could be detected among fish groups that received dietary charcoal in feeds. Furthermore, the effect of heavy metals decrease with increase of activated carbon at fed fish, leading to protect cultured fish. Soon after the juvenile red tilapias stocking, rotifers, Cladocera and rare groups replaced Copepoda, which constituted more than 80% of total zooplankton community. Diversity Index classified the pond water as being among moderately and heavily polluted. The results displayed that 30-40 g/kg dietary CWC in T3 and T4 are a suitable level to improve water quality parameter of the fish farm and improve growth percentage (S%) of red tilapia with percentage higher than 95%.
Keywords
Aquaculture; Commercial wood charcoal; Water quality parameters; Zooplankton
Introduction
Fish is budgeter source of protein in numerous zones of the world while, water serves as the physical support in which they do their function viz., breeding, feeding, digestion, swimming and excretion [1]. Fish farming in Egypt is increasing all year to satisfy the demands of internal and external markets. Tilapias have been terming as one of the most essential fish for their capabilities to tolerate a wide scope of environmental factor and stress conditions. One of the most significant fish is Nile tilapia, juvenile red tilapias (Oreochromis mossambicus & Oreochromis niloticus) (L.), which is folksier between fish farmers owing to its good growth among different marine ecosystems including polluted ones by heavy metals [2].
Zooplankton is considered the main natural food for fish culture especially during the early stages because of its effectiveness in increasing the population growth rate of fish larvae [3]. In addition to the live food is considered as an easily digestible protein for shellfish and fish. The zooplanktons are playing an essential function to evaluation the faunal bio-diversity of aquatic ecosystems. They comprise representatives of almost every taxa of the animal kingdom and take place in the environment as either adults or larvae and eggs. The importance of micro zooplankton in aquatic food webs as grazers, food for high trophic levels [4], and recyclers of nutrients [5], is currently widely recognized.
Water quality parameter is one of the most concerns in aquaculture. Any change in the chemical or physical parameters can cause a negative influence on the growth of the organisms, their physiological state, or even mortality, causing major losses in production. The main physicochemical parameter determine via farmers in small-scale production system are dissolved oxygen, pH and conductivity, ammonium and nitrite inside the production ponds.
Charcoal is a crystalline form of carbon, which is generally produced as a carbonaceous residue of wood, cellulose, bamboo, coconut shells, or different manufacturing wastes after heating the organic material. It comprise of about 70% to 90% clean carbon and include multi-trace metals as potassium, calcium, sodium, iron, manganese, copper, magnesium, zinc, etc. [6]. Charcoal compound is odorless, fine, black powder, tasteless and a good an adsorbent for several toxic materials as pesticide, heavy metals, dyes, unwanted gases and drugs due to its higher surface area [7].
In addition, charcoal compound has been worked as a feed additive for several terrestrial animals owing to its capability to absorb gases, as ammonia and nitrogen, activate the intestinal purpose, and remove the impurities and toxic from the gastrointestinal tract of animals [8].
Therefore, this study was carried out to investigate the role of locally available commercial wood charcoal in the feeds of red tilapia to improve their growth performances and study effect the water quality of the El Max fish farm. In addition to studying zooplankton community structure, species diversity, and relation conditions in aquaculture.
Materials and Methods
Experimental design, diet preparation and proximate chemical analyses
Red tilapia (Oreochromis mossambicus × Oreochromis niloticus) fingerlings were obtained from El-Max research situation (NIOF), West of Alexandria, Egypt, for seven Weeks from July 2019 to September 2019. After acclimation for a Week on the basal diet (without charcoal) the fish were separated into five triplicate groups of 30 fish, all replication, with an average weight (1.2 ± 0.04 g/fish) and randomly stocked in 15 net ponds, all 1 pond of 2 × 1 × 1 m (Length × Width × Depth) and 200 L. water capacity.
The frame of the ponds was made of iron and coated with antirust paint. Net mesh size was of 2 mm2; the ponds were suspended (30 cm off the bottom) in the aquatic column by ropes. The ponds were placed separately by a non-successive way and facing the pond aquatic current, in order to diminish the negative loading impact of one-another. The test diets were feed twice daily, at 09.00 and 17.00 h, at 4% feeding rate for 6 days a Week. Fish were weighed every 15 days from the beginning of the investigation to the end for 60 days with adjusted Feeding ration after all sampling.
Five diets were formulated to include approximately 32% crude protein and 10% crude lipid mainly from; fish meal (65% protein, 8% fats) and soybean meal (48% protein, 2% fats) from Esraa trade Co., Giza, Egypt. The test diets were formulated as control charcoalfree diet (T1) and other 4 diets, including varying percentage of charcoal 1% (T2); 2% (T3), 3% (T4) and 4% (T5). Levels of CWC were selected according to similar previous studies on other fish species [9]. Diets formulation is presented in Table 1.
Table 1: Composition of dietary ingredients with different commercial wood charcoal (CWC) levels for fish diets.
| Diet composition% | |||||
|---|---|---|---|---|---|
| Ingredients | T 2 (0% CWC) | T2 (1% CWC) | T3 (2% CWC) | T4 (3% CWC) | T5 (4% CWC) |
| Fish meal | 25 | 25 | 25 | 25 | 25 |
| Soybean meal | 30 | 30 | 30 | 30 | 30 |
| Yellow corn | 10 | 10 | 10 | 10 | 10 |
| Wheat | 18 | 17 | 16 | 15 | 14 |
| Wheat Bran | 10 | 10 | 10 | 10 | 10 |
| Sunflower oil | 5 | 5 | 5 | 5 | 5 |
| Vitamins and Minerals premix* | 2 | 2 | 2 | 2 | 2 |
| Charcoal | 0 | 1 | 2 | 3 | 4 |
| Total | 100 | 100 | 100 | 100 | 100 |
*Vitamins and minerals premix (mg/kg); p-amino benzoic acid (9.48); D-Biotin (0.38); Inositol (379.20); Niacin (37.92); Ca-pantothenate (56.88); Pyridoxine-HCl (11.38); Riboflavin (7.58); Thiamine-HCl (3.79); L-ascorbyl-2-phosphate Mg (APM) (296.00); Folic acid (0.76); Cyanocobalamine (0.08); Menadione (3.80), Vitamin A-palmitate (17.85); α-tocopherol (18.96); Calciferol (1.14). K2PO4 (2.011); Ca3 (PO4)2 (2.736); Mg SO47H2O (3.058); NaH2PO4 2H2O (0.795).
All dry dietary ingredients were blended with homogenous thoroughly then oil was added. The mixer was moistened; coldpelleted with a laboratory feed extruder, and dried in a convection oven at 55°C for 3 hours to approximately 9% moisture then stored at -20°C until used, as reported by Michael et al. [10]. Feed utilization and fish growth performance were analysed in terms of survival (S%) and can be calculate by following equation: Survival (S %) = (Final fish count/initial fish count) × 100.
Analyses of the proximate chemical
Analytical procedures of proximate analyses of diet fish for total lipids, moisture, crude protein, and total ash, were calculated in dry weight basis, according to the standard technique of AOAC [11]. Moisture content analysis was determined by drying at 85°C for 48 hours, crude protein was estimated by multiplying nitrogen content by 6.25. Lipid content analysis was measured by ether extraction in many-unit extraction Soxhlet apparatus for 16 h. Total ash analysis was measured by combusting dry samples in a muffle furnace at 550°C for 6 h as presented in Table 2.
Table 2: Proximate analyses of the diet for fish diets.
| Proximate composition (g/kg) | T1 | T2 | T3 | T4 | T5 |
|---|---|---|---|---|---|
| Crude Protein | 32.9 ± 0.21 | 32.6 ± 0.35 | 32.8 ± 0.42 | 32.3 ± 0.14 | 33.0 ± 0.14 |
| Total Lipids | 10.0 ± 0.06 | 10.1 ± 0.04 | 10.0 ± 0.02 | 10.2 ± 0.08 | 10.0 ± 0.01 |
| Crude Fiber | 2.0 ± 0.11 | 2.1 ± 0.13 | 2.2 ± 0.21 | 2.2 ± 0.22 | 2.3 ± 0.34 |
| Ash | 8.3 ± 0.49 | 8.4 ± 0.31 | 8.7 ± 0.62 | 8.2 ± 0.42 | 8.5 ± 0.36 |
| Moisture | 9.1 ± 0.07 | 9.1 ± 0.12 | 9.1 ± 0.01 | 9.0 ± 0.07 | 8.9 ± 0.25 |
| NFE* | 46.8 ± 0.32 | 46.8 ± 0.21 | 46.3 ± 0.46 | 47.1 ± 0.57 | 46.2 ± 0.68 |
*Nitrogen-free extracts (NFE) = 1000 - [% Ash +% lipid +% protein +% Fiber]
Water quality parameters
Water samples were collected in 500 ml polyethylene containers at 10-20 cm depth from surface water of each aquarium to screen various water quality parameters. Water temperature (°C), salinity, pH, dissolved oxygen (DO) (mg/l) and ammonia concentration were measured in situ. Water temperature was determined by using mercury thermometer. Hydrogen ion concentration (pH) was evaluated by a pH meter (Digital Mini-pH Meter, model 55, USA). Ammonia and dissolved oxygen concentrations were analyzed all 15 days according to APHA [12]. The standard curve of ammonia was obtained from three different ammonium sulfate mixtures (0.2 ml, 0.4 ml, 0.6 ml). Heavy metals concentration was determined in whole body of fish according to Abdel-Tawwab et al. [13].
Water Quality Index Approach (WQI)
The pollution index is important approach to provide information about the water quality. It's a rating reflecting the composite impact of various water quality factors on the overall quality of water. WQI was evaluated by using this equation [14,15]:
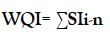
Where: n is the number of factors and SI (sub index for all chemical factors) which calculated as
SIi =Wi × qi.
Where: Wi is the relative weight of the chemical parameter was computed using the next formula

In addition to qi is the quality rating for all parameter is assigned by
qi= (Ci/Si) *100
Where: qi is the quality rating, Ci is the concentration of all chemical factors in every water sample in mg/l, and Si is the seawater standard according to guidelines [16] for all chemical parameter in mg/l. The classification of WQI values was dived into five categories as heavily polluted and unsuitable for drinking (> 300), very poor (200–300), poor (100–200), good (50–100), Excellent (<50).
Zooplankton sampling and count
Zooplankton samples were collected during summer season (31/7- 18/9/2019) to period 8 Weeks by filtering 50 L of water by a small standard plankton net (mesh size 55 μm) using a plastic container of liters’ capacity. The collected samples were conserved with 4% neutral formalin mixture in 250 ml polyethylene bottles. The volume of per sample was concentrated to 100 ml and the whole sample was investigated in a Petri dish under a research binocular microscope. For zooplankton enumeration purposes, at least two aliquots (2 ml of well-shaken suspension) were withdrawn from all samples by a graduated pipette, placed in a counting chamber and the number of individuals of all species was counted. The average number of duplicated assessment for per sample was evaluted and the counts were calculated as number of individuals per cubic meter [17,18]. The identification of zooplankton species was done according to Edmondson et al. [19]. Aliquots for counts were taken from the total sample adjusted to 100 ml. the standing crop of zooplankton community was calculated and expressed in number per cubic meter.
Statistical analysis
Statistical analysis was computed by Microsoft office Excel 2010. Diversity (H`) was user to calculate the community structure for zooplankton. Inter relationships among various factors were measured by using the correlation matrix formed in IBM SPSS statistics, ver. 22 program. The correlation coefficients are considered significant at the 95% confidence level (p ≤ 0.05) and 0.01 levels (2-tailed). Cluster Analysis (CA) was used to the results data via using the MVSP (version 3.1) package program. Cluster analysis was done using Ward’s method (z-transformation of the input data, Euclidean distance as similarity measure) based on the standardized mean.
Results
Effects of water physicochemical parameters and CWC Water management in aquaculture is one of the important factors contributing to the success of aquaculture, reducing the occurrence of fish disease and enhancing fish growth and survival. Results of physicochemical parameters from water ponds in fish farms of red tilapia fed various amount of CWC and the period of experiment are presented in Table 3.
Table 3: Physico-chemical parameters at different amount of CWC and the period of experiment in fish ponds.
| Parameters | pH | Salinity (PSU) | Do (mg/l) | Ammonia (mg/l) | Temp (°C) |
|---|---|---|---|---|---|
| T1 | 8.625 | 6.85 | 6.193 | 0.093 | 29.588 |
| T2 | 8.682 | 5.848 | 0.084 | ||
| T3 | 8.584 | 6.406 | 0.060 | ||
| T4 | 8.618 | 6.586 | 0.066 | ||
| T5 | 8.722 | 6.150 | 0.081 | ||
| Week | |||||
| W0 | 8.62 | 7.10 | 7.80 | 0.06 | 30.90 |
| W1 | 8.58 | 7.10 | 6.21 | 0.07 | 29.50 |
| W2 | 8.56 | 7.50 | 4.79 | 0.08 | 30.50 |
| W3 | 9.00 | 8.40 | 6.09 | 0.04 | 30.00 |
| W4 | 8.44 | 8.40 | 4.44 | 0.13 | 29.80 |
| W5 | 8.77 | 6.30 | 6.35 | 0.05 | 29.40 |
| W6 | 8.55 | 5.00 | 8.58 | 0.05 | 28.50 |
| W7 | 8.63 | 5.00 | 6.90 | 0.12 | 28.10 |
Water temperatures is one of the most essential basic environmental factors for all aquatic organisms which effects chemical and biological reaction in water [20]. The change in temperature affects the metabolism, productivity and physiology. In the present research water temperature is obtained in the scope of 28.1°C (Week 7) to 30.9°C (Week 0), which are come under the standards of WHO [21].
Salinity parameter is influence the growth performance of many fish. Salinity influence has been investigated in numerous species of fish in tanks, raceways, ponds and pon. Salinity exhibited fluctuations and reached maximum value was 8.4 ppt in Week 3, whereas the lowest value was 5 ppt were measured in Week 6 and Week 7.
pH indicates the acid base balance of the water. In present study, the pH values ranging between 8.4 (Week 4) and 9 (Week 3), while recorded the highest value in T3 (8.58), and the minimum value shown in T5 (8.72), which appears that the approving conditions for fishes production. The pH results can agrees with the worldwide standards criteria; WHO [21] and FEPA [22]. Most fish species do favorite within the pH range of 6.5 to 9.5.
Water temperature, pH and salinity didn´t display any significant differences between treatments when measured inside fish ponds.
Dissolved oxygen (DO) is the highest essential environmental influence in fish culture. It is assess of amount of dissolved oxygen in aquatic ecosystem. It plays a vital parameter in the survival, growth behavior and physiology of marine organisms. In present research DO obtained are in the scope of 4.44 mg/l (Week 4) to 7.80 mg/l (Week 0) and the highest DO level was recorded in T2 (5.84 mg/l), and the lowest DO levels were recorded in T4 (6.58), its results agree with those of WHO.
Boyd et al. [20] reported that the best concentration of DO in fishpond waters is 6 to 9 mg/l. Fish are not the only depreciates of oxygen in fish farm system; bacteria, phytoplankton, and zooplankton depreciate large amount oxygen as well decomposition of organic substances (algae and fish wastes) is the single highest consumer of oxygen in aquaculture method.
Low-dissolved oxygen amounts are dependable for more fish kills, with directly or indirectly, all other problems combined.
Like humans, fish need oxygen for respiration. The amount of oxygen depreciated by fishes is a function of its temperature, activity percentage, size and feeding rate. Small fish depreciate more oxygen than make large fish because of their higher metabolic rate. Dissolved oxygen concentrations treatments stocking demonstrated mean ranged among 5.8 mg/l at T2 and 6.5 mg/l at T4, but maximum mean recorded in Week 6 (8.57 mg/l), while minimum mean listed in Week 2 (4.78 mg/l).
Ammonia is considered as waste product of protein metabolism through fishes and other marine organism's excretion. The main source of nitrogen substances in fishpond culture is the protein contained in the feed. Thus, the rate of ammonia production of fish is proportional to the feeding rate and protein level in food. The ammonia concentration in this work is range from 0.04 μg/l (Week 3) to 0.13 μg/l (Week 4). The lowest ammonia level was recorded in T4 (0.066 mg/l), and the highest ammonia level was recorded in T1 (0.093 μg/l) and T0 (0.12 μg/l). The results demonstrated that the increasing in CWC amounts in the feeds of red tilapia with decrease in the water ammonia concentrations.
The ionized form (NH4+)– and the relative proportion of each type depends on pH and temperature. As pH increases, there is an increasing proportion of un-ionized ammonia, which is very toxic to fish. Some studies considered ammonia above 0.1 μg/l is harmful to fish [23] and in the present research it was below these levels (<0.13 μg/l). The decreased ammonia concentrations at active carbon-fed fish could be owing to efficacy the active carbon to adsorb ammonia.
Correlation between abiotic parameters, zooplankton community and commercial wood charcoal
Zooplankton is a good indicator of changes in water quality, because it is strongly affected by environmental condition and responds quickly to change in environmental quality [24]. In first and second Weeks, zero charcoal concentration (T1) was zooplankton density larger from concentration charcoal treatments, but from Week 3 start increasing zooplankton at concentration charcoal (T2, T3, T4, T5) due to this organism's adaptation with concentration charcoal, or because charcoal influence on water quality was slowly.
Dietary charcoal 3% was showed to be a suitable amount to maintain average growth of red tilapia juveniles in addition to maintain good water quality within the rearing pond [10]. The results data showed that 30-40 g/kg-1 dietary CWC in T3 and T4 can be a suitable level to improve water quality factor of the rearing area and improve growth percentage (S %) of red tilapia juveniles with percentage higher than 95%.
This study agree with previous study as Boonanuntanasarn et al. [25] who studied fed Nile tilapia fish (380–460 g) on diets including 0, 10, 20, and 30 g AC/kg diet and they reported no significant alterations in growth performances between experimental treatments. On other hand, Yoo et al. [26] revealed that the suitable amount of wood vinegar mixture and dietary charcoal (20% vinegar and CV 82; 80 % charcoal) for best growth of juvenile fish Japanese flounder was 0.5 – 1% of diet.
In a previous study, 30-40 g/kg charcoal showed the best growth, biochemical composition in addition to improving the quality of water for red tilapia hybrid [10].
A strong positive correlation was observed between mean T and pH (r = 0.800, p = 0.104), rotifers (r = 0.600, p = 0.285), and copepods (r = 0.800, p = 0.104), in addition to highly positive relation between salinity and pH (r=0.900, p=0.037), rotifers and ammonia (r=1.000). While, a negative correlation was showed between mean T and Do (r=-0.700, p=0.188), pH & salinity (r=-0.600, p=0.285), Do & ammonia (r=-0.600, p=0.285), Cladocera &Temp. (r=-0.600). In addition, a positive correlation was showed between rotifers and pH (r=0.6, p=0.285), copepods & NH3 (r=0.500, p= 0.391), salinity & other (r = 0.500, p = 0.391). Other relations between parameters showed low or no significant correlations (Table 4).
Table 4: Pearson-moment Correlation (r) between the different physico-chemical parameters zooplankton and mean (T level).
| Variables | pH | salinity | Do | Ammonia | Temp | Rotifera | Copepoda | Cladocera | Other zooplankton | T (Mean) |
|---|---|---|---|---|---|---|---|---|---|---|
| pH | 1.000 | |||||||||
| salinity | -.600 | 1.000 | ||||||||
| Do | -.800 | 0.000 | 1.000 | |||||||
| Ammonia | .600 | -.200 | -.600 | 1.000 | ||||||
| Temp | -.300 | .900* | -.300 | .100 | 1.000 | |||||
| Rotifera | .600 | -.200 | -.600 | 1.000** | .100 | 1.000 | ||||
| Copepoda | .300 | -.100 | -.300 | .500 | -.200 | .500 | 1.000 | |||
| Cladocera | .400 | -.800 | .100 | 0.000 | -.600 | 0.000 | -.500 | 1.000 | ||
| Other zooplankton | -.700 | .500 | .500 | .100 | .300 | .100 | .300 | -.600 | 1.000 | |
| T (Mean) | .800 | -.400 | -.700 | .600 | -.300 | .600 | .800 | -.100 | -.300 | 1.000 |
*Correlation is significant at the 0.05 level (2-tailed).**.Correlation is significant at the 0.01 level (2-tailed).
Proximate composition effect of red tilapia hybrid fed different levels of CWC
In terms of crude protein (CP) and efficiency of nitrogen retention (NRE), the fish groups (T1, T2, T3 and T4) that fed charcoal-based diets showed a significant improvement (P >0.05) than those of the control fish group (T0) for both efficiency of nitrogen retention and crude protein. The fish groups that received dietary charcoal in feeds (T1, T2, T3 and T4) showed no significant alterations for both CP and NRE. In addition to no significant alterations (P >0.05) could be detected among fish groups that received dietary charcoal in feeds (T1, T2, T3 and T4) in terms of moisture, ash and total lipid as presented in Table 5. Charcoal can made complexes with phenol substance to prevent hydrolysable tannins interfering with protein formation, thus augment the availability of proteins [27].
Table 5: Proximate composition of red tilapia hybrid fed different levels of commercial wood charcoal* (Source: Michael et al. 2015).
| Parameters (g/kg) | T0 | T1 | T2 | T3 | T4 |
|---|---|---|---|---|---|
| Moisture | 744.6 | 744.3 | 742.4 | 743 | 743.8 |
| Ash | 122.4 | 123.0 | 123.2 | 125.7 | 124.4 |
| Total lipid (TL) | 205.2 | 203.3 | 204.3 | 203.4 | 204 |
| Crude protein (CP) | 563.4 | 574.2 | 572.5 | 571.2 | 572.3 |
| Efficiency of nitrogen retention (NRE) | 378.1 | 403.2 | 402.7 | 412.3 | 411.8 |
Different letters represent significant difference (P < 0.05) within each row of data, while no letters represents no significance (P > 0.05).
Cluster analysis
Cluster analysis is an unsupervised multivariate statistical method used to classify the objects into clusters based on their similarity, it is used multivariate statistical system to calculate the surface water quality, and it is typically demonstrated by a dendrogram [15]. The cluster analysis of levels of charcoal 1% (T2); 2% (T3), 3% (T4) and 4% (T5) and according to their physico-chemical similarity are given in Figure 1.

Figure 1: Dendrogram viewing the relationship amongst different levels of charcoal, physico-chemical and zooplankton.
Produced two different clusters, one solely composed of cluster corresponded to T1 and the other one includes the other four clusters. T2 and T4 showed that similar properties and high similarity as they are included in the same subgroup followed by (T5) then (T3).
The correlation between different (T) levels, physico-chemical parameters and zooplankton on the ordination diagram produced by Canonical Correspondence Analysis (CCA) of the biplot of species-environment. The length and direction of an arrow demonstrating any environmental variable gives an indication of the significance and direction of the gradient of environmental changes, for that variable, within the site of sampled measured. The angle among an arrow besides per axis is a reflection of its grade degree of correlation with the axis. By dropping a perpendicular to the arrow from all “species-point”, an indication is given of the relative position of species along the environmental gradient.
As presented in Figure 2, it is obvious that T1, T2, T3, T4, T5, temp, NH3, DO, copepods, rotifers and other zooplankton, the showed high significant correlations with the first and second axes of CCA ordination diagram.

Figure 2: Canonical correspondence analysis ordination diagram between different (T) levels, physico-chemical parameters and zooplankton by arrows.
On the upper right side of CCA-biplot diagram, the dominant factors are copepods and other zooplankton. The upper left sides of CCA- biplot diagram, the dominated factors are rotifers and T1. On the upper left side of CCA- biplot diagram, the dominated factor is T3, while in the lower left side, the important parameter are temp, T2, T4, and T5. Activated of charcoal have been usually used as an adsorbent and detoxicant in medical sciences and contamination [28]. Efficiency of adsorption basd on dosage of AC and the concentration of toxins existing in the digestive tract [29]. Rotifers may afforded 1 to 97 ppt salinity, but optimize reproduction take place below 35 ppt. Salinity changes of more than five ppt can inhibit swimming or even effect death, so acclimation should be fixe carefully and slowly [30]. Cladocerans zooplanktons, which are colored a deep red are often indicators of low dissolved oxygen conditions.
Zooplankton community structure and composition
Most species in the zooplankton community divided into three major groups: Crustacea (copepods and Cladocera), Protozoa and Rotifers among zooplankters, copepods were dominant density groups (49%) and rotifers were second dominant groups (48%), while rotifer larger numerous species from copepods (Figures 3-5). Numerically, a few rotifer and crustacean taxa formed the major component of the zooplankton. Rotifera are known to be more species rich than Cladocerans and copepods in subtropical water bodies [31]. The lowest and highest species diversities (H-) were 2.58 (T2) and 2.77 (T1) (Table 6). Species evenness (J) varied between 0.88 and 0.90, Species richness varied between 1.26 and 1.63, indicating a reduction in the degree of dominance at this period.

Figure 3: Showed that the zooplankton density percentages during the treatment period.

Figure 4: Showed that the other zooplankton density percentages during the treatment period.

Figure 5: Weekly variations of zooplankton abundance subdivided by groups of treatments during Summer 2019.
Table 6: Range and Mean of zooplankton density (ind.m-3), Richness, evenness and diversity in fish ponds.
| Parameters | No. species | density | Richness | evenness | Diveristy (H) |
|---|---|---|---|---|---|
| T1 | 24 | 1520143 | 1.63 | 0.88 | 2.77 |
| T2 | 19 | 1303643 | 1.26 | 0.88 | 2.58 |
| T3 | 20 | 1459072 | 1.37 | 0.88 | 2.64 |
| T4 | 21 | 1412230 | 1.41 | 0.90 | 2.71 |
| T5 | 21 | 2055476 | 1.40 | 0.90 | 2.72 |
In total, 30 zooplankton species were investigating and identifying including adult and the larval stages of different groups. Most of zooplankton was rotifers (15 species). Copepods formed 8 species, protozoans two groups, each group contained one species (2 species: one of each of tintinnids and foraminiferans), Cladocera formed 2 species, while, Ostracoda, Amphipoda and Nematoda were represented by only one species each. The results indicate that, fish fries generate detectable changes in the zooplankton assemblages and their ecological attributes.
The rotifer community initial in Week 0 was 1404000 indv. m-3. The rotifer average was depressed after Week 1 to reach 908067 indv.m-3, and continue to decreased to Week 3, but increased from Week 4 to end experimental (Week 7) due to adaptation this organisms on environmental conditions. Spine-bearing genus Brachionus plicatilis and Keratella cochlearis were generally well represented in the study period; it was represented by 15 species; in which Brachionus plicatilis Müller, 1786 Brachionus calyciflorus calyciflorus Pallas, 1776, Keratella cochlearis cochlearis (Gosse et al.) and Asplanchna periodontal (Gosse et al.) were the most dominant species. Rotifers were culturing as feed for the larvae and juveniles of fish, when scientists were studying their reproduction and life history. Brachionus plicatilis is widely used in the larval culture of more than 60 species of marine finfish and 18 crustaceans worldwide [32].
Brachionus bidentata B. Quadridentatus, B. Angularis, B. Urceolaris, B. Caudatus, Eosphora najas , Ploesoma lenticulare, Cephalodella megalocephala, Cephalodella auriculata, Philodina roseola, Vanoyella globosa were appear and disappear different treatments and Weeks. In general, rotifers are the smallest of the main zooplankton groups. Body lengths of rotifer species vary from 0.04 to 2.5 mm.
Rotifers reach maturity two to eight days after hatching and some species can increase in number very rapidly. However, modest populations of larger rotifers (Brachionus plicatilis and Keratella cochlearis) may appear after stocking, particularly when fish fry and Cyclopoid copepods prey on small rotifers.
Rotifers density, population, fecundity and growth rate were dependent on food availability and quality [33]. The euryhaline rotifer Brachionus plicatilis is a species complex, which are commonly uses for rearing marine fish larvae. It is also important to obtain rotifers with higher growth rate and tolerance against environmental stress and better nutritional quality after enrichment [34]. Copepods were fluctuating between increasing and decreasing from Week to Week because life cycle of them seven days. Copepods are the most important feed for planktivorous fish, including the larval stages of many fish species [35]. Among copepods dominant including adults, Mesocyclops hyalinus and Thermocyclops neglectus [36] were most represented period study. Cyclopoid copepods prey on tiniest rotifers and together, copepods and Cladocerans inhibit enrichment of the smallest rotifers [37]. Eight species under copepod were identifying and investigating, including naupllus larvea of different groups. Mesocyclops hyalinus, Thermocyclops neglectus, Thermocyclops crassus, Acanthocyclops americanus, Acartia latisetosa, Oithona nana, Nitocera lacustris, naupllus larvae. Zooplanktons are an important food source for many fish larvae, post juvenile and larvae in addition to crustaceans [38]. Cladoceran density was lowest compared to copepods and rotifers. Highest Cladoceran abundance (3067 indiv. m-3) was recording in Week 1. Two Cladoceran species: Daphnia magna and Moina micrura were appeared only in Week 0 and Week 1, while it was disappeared from Week 2 to Week 7 may be affected by concentration of charcoal. Cladocerans, are the third dominate group of zooplankton found in freshwater ponds. Larger fry and per adults of specific fish species are often eclectic prey on copepod and Cladocera. Geiger [39] states that the predation exerts perhaps are the major single effect on pond zooplankton compositions. Tilapia fish was omnivore that feed on both zooplankton and aquatic plants, the fries consume mainly rotifers. Selective fish predation plays important role in systematization abundance of zooplankton and the diversity.
Most fish fry feed three main groups of zooplankton rotifers, Cladocerans and copepods. For the smallest fish fry, as the newly hatched fry, tiny rotifers may be the only zooplankton small enough to food. For larger fry, the tiniest rotifers may not retrofit enough nutrients to do chivying and ingesting them fetches the effort.
Copepod nauplii, which are just-hatched copepods, are consequential main foods for larval fish, too. Protozoans may be are fed, but little is known about their contribution to fry foods. Overall, fry must have zooplankton as natural food to survive, and at least to be healthy and develop speedily.
In general, fry need to have zooplankton as natural food to survive, to be healthy and grow speedily. Most fry are not particular about the groups of zooplankton they food, but some organisms must be minor enough to beseem into their mouths. To highest survival, stock every fry just as communities of zooplankton small enough for the fry to food are quickly highest and before invasive predators become several.
Ahlen et al. [40] maintained that planktivorous fish are terms to affect the zooplankton population in terms of both species composition and species-specific morphological traits. This difference in zooplankton diversity and species richness may be are linked to alterations in predation by the various fish species.
Water quality index (WQI)
Water quality is the most significant feature affecting fish health and performance in aquaculture production systems. The results of WQI and water type based on five parameters are pH, salinity, DO, ammonia, temperature. The values of average water quality index of all Weeks ranged from 68.14 to 79.28, with average 73.20 (good water) as presented in Table 7.
Table 7: WQI of fish farm at different weeks.
| Weeks | 0 | 1 | 2 | 3 | 4 | 5 | 6 | 7 | Average |
| WQI | 79.28 | 71.69 | 68.14 | 72.10 | 69.43 | 71.16 | 77.93 | 75.86 | 73.20 |
The water at almost in all Weeks in fish farm showed that; the quality of water was good as a result of water pollution resulting from pond effluents (i.e., salinization of land and water by effluents, seepage, and sediment from brackish water ponds), [41] which can to convert water quality from excellent water to good water. Good water quality is very essential for survival and fish growth.
Good water quality denotes to that with proper temperature, adequate oxygen, limited levels of metabolites, transparency and ideal levels of other environmental parameter affecting culture of fish. This information would help the worker in aquaculture filed to take well care of their fish ponds through frequently observing the conditions of the ponds, behavior of fish, and color of water for any abnormal variations [42].
The resulted displayed that the highest value of WQI was showed at zero Week then decreased in fish farm due to no commercial wood charcoal in first Week and fish farm receives huge amounts of containing high levels of organic, inorganic toxic materials and nutrient salts from Umum Drain in El-Mex which are pumped directly into the fish farm site by a pipeline.
Bioaccumulation in heavy metals pollutant in body of tilapia (Oreochromis niloticus) fed on nutriments supplemented by various levels of active charcoal
The obtained data in herein are in accompaniment with previous data of Abdel-Tawwab et al. [13], who found that before expose to heavy metals as Zn (II), Cu (II), Pb (II) and Cd (II), no significant difference in whole-fish body between the fish groups and their ranges were 9.79-11.55, 0.32-0.41, 0.18-0.26, and 6.21-7.86 mg/g dry weight for Zn (II), Cu (II), Pb (II) and Cd (II), respectively as shown in Table 8.
Table 8: Heavy metals concentration in Nile tilapia fed diets with various levels of dry active charcoal.
| AC levels (mg/g dry weight diet) | Heavy metal exposure | Zn (II) | Cu (II) | Pb (II) | Cd (II) |
|---|---|---|---|---|---|
| 0 | Before exposure | 9.92 | 0.32 | 0.18 | 6.21 |
| 2 | 9.79 | 0.35 | 0.20 | 0.20 | |
| 5 | 11.55 | 0.41 | 0.21 | 0.21 | |
| 10 | 11.55 | 0.32 | 0.22 | 0.22 | |
| 20 | 10.93 | 0.35 | 0.26 | 0.26 | |
| 0 | After exposure | 40.25 | 7.04 | 6.86 | 22.84 |
| 2 | 25.86 | 5.09 | 3.10 | 18.93 | |
| 5 | 15.82 | 4.49 | 1.84 | 16.54 | |
| 10 | 15.48 | 3.22 | 1.18 | 12.54 | |
| 20 | 14.75 | 3.27 | 0.92 | 12.54 |
While, after expose to heavy metals, fish feed the control diet cumulative maximal HM values in their bodies; meanwhile, concentrations of heavy metals were inversely influenced by dry active charcoal supplementation. This relationship was amount dependent which the lowest heavy metals values were shown in the Nile tilapia fish bodies at fed 5-20g of dry active charcoal diet for 7 days as presented in Table 8, with ranges 40.25-14.75, 7.04 -3.2, 6.68-0.92, and 22.8412.54 mg/g for for Zn (II), Cu (II), Pb (II) and Cd (II), respectively. Furthermore, residues of heavy metals in bodies of fish fed from 10 to 20 g/kg active charcoal diet were lesser than those of the control fish and their concentrations were close to those of fish before heavy metals exposure, which decrease heavy metal contents with increase level of activated carbon. The efficacy of adsorption based on dry active charcoal amount and the quantity of gases in the digestive tract [29].
These results demonstrate that activated carbon could likely protect cultured fish from the offensive effect of heavy metal toxicity and decreased the heavy metal bioaccumulation in body of fish via augmentation metal ions excretion, metal-ion chelating, and reduced metal ions absorption.
Discussion
Present research was established to estimate the quality of water of the fish farm by physicochemical and biological methods. In spite of major changes in the zooplankton population structure were found in ponds due to cultivation of planktivorous fish fry, quality of water and zooplankton diversity indices were thef same in appreciation. The water used for culture of tilapia fish in aquaculture farm was slightly basic. Ammonia, pH and DO parameters in the ponds were within the best levels for growing of tilapia, however temperature and salinity parameters were below best levels. The ammonia factor was adversely affected by dietary AC amounts where lowest concentration of ammonia was showed at T2 (20 g AC/kg diet) and the maximum concentration was showed at the control group and T1 (10 g AC/kg diet). These results showed that an interaction among the nutrients and non-selective adsorbent of activated carbon in the feed, such as there is a loss of the nutrients and the favorable materials owing to non-selective adsorption in the feed at the higher amount of activated carbon.
Dietary charcoal 3% (30 g/kg was found to be favorable amount to improve normal growing of red tilapia juveniles fish in addition to maintain good water quality within the rearing pond, due to the adsorption mechanism of nitrogen and ammonia.
The average water quality index of all Weeks ranged from 68.14 to 79.28, with average 73.20 (good water).
Conclusion
Many species in the zooplankton population fall into three main types: Crustacea (copepods and Cladocera), Rotifera, and Protozoa among zooplankters, copepods were dominant density groups (49%) and rotifers were second dominant groups (48%), while rotifer larger numerous species from copepods. The lowest and highest species diversities (H-) were 2.58 (T2) and 2.77 (T1). Species evenness (J) varied between 0.88 and 0.90, Species richness varied between 1.26 and 1.63, indicating a reduction in the degree of dominance at this period. So that, this study recommended to use dietary active commercial wood charcoal in fish farm because it was proven to be a good feed additive in the feeds of fish and improve the quality of fish and associated organisms, as well as water quality in fish ponds.
Acknowledgement
The authors would like to express their gratitude to all the workers in El-Max research station and authors in Michael et al. for their continuous help along the experimental feeding period.
REFERENCES
- Anyanwu LT, Solomon JR. Physio-chemical parameters of fish pond used for Dutch clarias hybrid fed coconut chaff and bambara nuts. Afr J Environ Pollut Health. 2015; 11:1-10.
- El-Sayed AFM. Tilapia Culture. Willingford: CABI publishing, CABI International, UK. 2006.
- Heneash AMM. Assessment of water quality of unfertilized fish farm using zooplankton diversity index and some abiotic factors. Egy J Aqua Fish. 2015; 19: 35-44.
- Schmidt K, Atkison A, Petzke K, Voss M, Pond DW. Protozoans as a food source for Antarctic krill, Euphausia superba: complementary insights from stomach content, fatty acids, and stable isotopes. Limnol Oceanogr. 2006; 51: 2409–2427.
- Sherr EB, Sherr BF. Significance of predation by protistsin aquatic microbial food webs. Antonie van Leeuwenhoek. 2002; 81: 293–308.
- Brouwer ID, Hartog AP, Kamwendo MO, Heldens MW. Wood quality and wood preferences in relation to food preparation and composition in central Malawi. Ecol Food Nutri. 1996; 35: l-13.
- Osol A. Remington’s Pharmaceutical Sciences, 15th edition. Mack Publishing Co, Easton, Pennsylvania, USA. 1975.
- Mekbungwan A, Yamakuchi K, Sakaida T. Intestinal villus histological alterations in piglets fed dietary charcoal powder including wood vinegar compound liquid. Anat Histol Embryol. 2004; 33: 11–16.
- Nopadon P, Boonananthanasarn S, Krongpong L, Katagiri T. Effect of activated charcoal-supplemented diet on growth performance and intestinal morphology of Nile Tilapia (Oreochromis niloticus). Thai J Vet Med. 2015; 45: 113–119.
- Michael F, Saleh N, Shalaby S, Sakr E, Abd El-khalek DE, Abd El-Monem AI. Effect of different dietary levels of commercial wood charcoal on growth, body composition and environmental loading of red tilapia hybrid. Aquacult Nutr. 2015; 23: 210- 216.
- Association of Official Analytical Chemists (AOAC). The Official Methods of Analyses Association of Official Analytical Chemists International. 15th edition, Arlington, VA, 2220, USA. 1990.
- American Public Health Association (APHA). Standard methods for the examination of water and wastewater 16th ed, Washington, D.C., USA, 2000.
- Abdel-Tawwab M, El-Sayed G, Shady S. Effect of dietary active charcoal supplementation on growth performance, biochemical and antioxidant responses, and resistance of Nile tilapia, Oreochromis niloticus (L.) to environmental heavy metals exposure. Aquaculture. 2017; 479: 17-24.
- Batabyal AK, Chakraborty S. Hydro geochemistry and water quality index in the assessment of groundwater quality for drinking uses. Water EnvironResource. 2015; 5: 607-617.
- El-Feky M, Alprol AE, Heneash AM, Abo-Taleb HA, Omer M. Evaluation of Water Quality and Plankton for Mahmoudia Canal in Northern West of Egypt. Egy J Aqua Bio Fish. 2018; 22: 461-474.
- Tanjung RH, Hamuna B, Alianto. Assessment of Water Quality and Pollution Index in Coastal Waters of Mimika, Indonesia. J Eco Eng. 2019; 20: 87–94.
- Heneash A, Tadrose HR, Hussein MM, Hamdona SK, Abdel-Aziz N, Gharib S. Potential effects of abiotic factors on the abundance and distribution of the plankton in the Western Harbour, south-eastern Mediterranean Sea. Egy Oceano. 2015; 57: 61-70.
- Heneash A, Ashour M, Matar M. Effect of un-live microalgal diet, Nannochloropsis oculata and Arthrospira (Spirulina) platensis,comparing to yeast, on Population and Growth rate of Brachionus plicatilis. Med Aqua J. 2015; 7: 63-70.
- Edmondson WT. Freshwater Biology, (2nd edn). John Wiley & Sons, Inc., New York, USA. 1959; 1248.
- Boyd CE, Lichtkoppler FR. Water Quality Management in Pond Fish Culture Res. Dev. Ser.: 22 Auburn University Aubum Alabama. 1985.
- WHO. Guideline for Drinking Water Quality. World Health Organization, Geneva. 2009.
- FEPA. Guidelines and Standard for Environmental Pollution Control. Federal Environmental Protection, Agency. 1991.
- Sunitha K, Padmavathi P. Influence of Probiotics on Water Quality and Fish Yield in Fish Ponds. Inter J Pure Appl Sci Technol. 2013; 19: 48-60.
- Gannon JE, Stemberger RS. Zooplankton especially Rotifer and Florida red tilapia in marine ponds: the effect of stocking density and dietary protein on Feed. Sci Technol. 1978; 130: 242-256.
- Boonanuntanasarn S, Khaomek P, Pitaksong T, Hua Y. The effects of the supplementation of activated charcoal on the growth, health status and fillet compositionodor of Nile tilapia (Oreochromis niloticus) before harvesting. Aquacult Inter. 2014; 22: 1417-1436.
- Yoo JH, Ji SC, Jeong GS. Effect of dietary charcoal and wood vinegar mixture (CV82) on body composition of olive flounder, Paralichthys olivaceus. J Wor Aqua Soc. 2005; 36: 203–208.
- Van DT, Mui NT, Ledin, I. Effect of method of processing foliage of Acacia mangium and inclusion of bamboo charcoal in the diet on performance of growing goats. Anim Feed Sci Technol. 2006; 130: 242–256.
- Choi JY, Shinde PL, Kwon IK, Song YH, Chae BJ. Effect of wood vinegar on the performance, nutrient digestibility and intestinal microflora in weanling pigs. Asia Austr J Ani Sci. 2009; 22: 267-274.
- Bisson MG, Scott CB, Taylor CA. Activated charcoal and experience affect intake of juniper by goats. J Ran Manag. 2001; 54: 274–278.
- Treece GD, Davis AD. Culture of Small Zooplankters for the Feeding of Larval Fish. The Southern Regional Aquaculture Center (SRAC) Publication No. 701 Grant No. 97-38500-4124 from the United States Department of Agriculture, Cooperative States Research, Education, and Extension Service. 2000.
- Sampaio EV, Rocha O, Matsumura-Tundisi T, Tundisi JG. Composition and abundance of zooplankton in the limnetic zone of seven reservoirs of the Paranapanema River, Brazil. Braz J Biol. 2000; 62: 525-545.
- Wendy F, Kevan M. Rotifer and microalgae culture system. Honolulu Hawaii. 1991; 1: 28-31.
- Ferreira M, Pedro S, Paula C, Jaime F, Ana O. Effect of the nutrition status of semi-continuous microalgal culture on the productivity and biochemical composition of Brachionus plicatilis. Marine Biotechnology. 2011; 13: 1074-1085.
- Hagiwara A, Suga K, Akazawa A, Kotani T, Sakakura Y. Development of rotifer strains with useful traits for rearing fish larvae. Aquacul. 2007; 268: 44–52.
- Möllmann C, Kornilovs G, Fetter M, Köster FW. Feeding ecology of central Baltic Sea herring and sprat. J Fish Biol. 2004; 65: 1563–1581.
- Sars GO. Copepoda Harpacticoida. An account of the Crustacea of Norway with short descriptions and figures of all the species. Parts XXV & XXVI Laophontidae (concluded), Cletodidae. 1990. 5: 277–304.
- Ludwig GM. Zooplankton succession and larval fish culture in freshwater ponds, Southern Regional Aquaculture Center Publication Number 700. Southern Regional Aquaculture Center. Texas A&M University, College Station, TX. 1999.
- Shaker IMA, Mona AH, Abd El-Aal MM. Zooplankton as live food for fry and fingerlings of Oreochromis niloticus in concrete ponds. 8th International Symposium on Tilapia in Aquac. 2008; 2: 757-771.
- Geiger GJ. A review of pond zooplankton production and fertilization for the culture of larval and fingerlings striped bass. Aquacul. 1983. 35: 353-369.
- Ahlén EB, Pär K, Persson LR. Relationships between planktivore community capacity (PCC) and Cladoceran microfossils in northern Swedish lakes. Fundam Appl Limnol. 2011; 78: 315-324.
- Boyd CE. Guidelines for aquaculture effluent management at the farm-level. Aquacult. 2003; 226:101–112.
- Makori AJ, Abuom PO, Kapiyo R, Anyona DN, Dida GO. Effects of water physico-chemical parameters on tilapia (Oreochromis niloticus) growth in earthen ponds in Teso North Sub-County, Busia County loading of red tilapia hybrid. Aquacult Nutr Fish Aqua Sci. 2017; 23: 20-30.
Citation: Heneash AMM, Alprol AE (2020) Monitoring of Water Quality and Zooplankton Community in Presence of Different Dietary Levels of Commercial Wood Charcoal of Red Tilapia. J Aquac Res Development 11: 6. doi: 10.35248/2155-9546.20.11.592
Copyright: © 2020 Heneash AMM, et al. This is an open-access article distributed under the terms of the Creative Commons Attribution License, which permits unrestricted use, distribution, and reproduction in any medium, provided the original author and source are credited.