
Indexed In
- RefSeek
- Hamdard University
- EBSCO A-Z
- Euro Pub
- Google Scholar
Useful Links
Share This Page
Journal Flyer
Open Access Journals
- Agri and Aquaculture
- Biochemistry
- Bioinformatics & Systems Biology
- Business & Management
- Chemistry
- Clinical Sciences
- Engineering
- Food & Nutrition
- General Science
- Genetics & Molecular Biology
- Immunology & Microbiology
- Medical Sciences
- Neuroscience & Psychology
- Nursing & Health Care
- Pharmaceutical Sciences
Research Article - (2026) Volume 11, Issue 2
Modulation of Ras GTPase and IRS-1 Activities by Spermine in Type 2 Diabetes: A Study Using Goto Kakizaki Rat Model
Boniface O. Ogar1,2, Azubuike I. Okafor2, Kenneth C. Nwachukwu1, Bassey A. Inyang1, Lukman A. Alli1* and Michael P. Okoh1*2Department of Medical Biochemistry, University of Cross River State, Cross River State, Nigeria
Received: 11-May-2026, Manuscript No. DCRS-26-32102; Editor assigned: 13-May-2026, Pre QC No. DCRS-26-32102; Reviewed: 27-May-2026, QC No. DCRS-26-32102; Revised: 03-Jun-2026, Manuscript No. DCRS-26-32102; Published: 11-Jun-2026, DOI: 10.35841/2572-5629.26.11.278
Abstract
In this study, we investigated the biochemical relationship between spermine, Ras GTPase activity, Insulin Receptor Substrate-1 and how they possibly affect insulin signaling and blood glucose concentrations using Goto Kakizaki (GK) rats as a model for type 2 diabetes mellitus. Type 2 diabetes mellitus is characterized by impaired insulin signaling and glucose dysregulation. Ras GTPases play a crucial role in regulating downstream signaling pathways, cycling between active GTP-bound and inactive GDP-bound states. GK rats were administered varying doses of spermine (6.25-25.00 mg/kg body weight) for six weeks. Spermine treatment enhanced Ras GTPase activity, associated with elevated Guanine Nucleotide Exchange Factor (GEF) activity and reduced GTPase-Activating Protein (GAP) activity. This upregulation corresponded with increased IRS-1 concentrations and improved glucose regulation. Notably, 25.00 mg/kg body weight spermine reduced blood glucose levels by 21.6% (from 12.40 mmol/L to 9.80 mmol/L) and increased total IRS-1 concentrations. Our findings suggest that spermine modulates Ras GTPase activity and IRS-1 expression, leading to improved insulin signaling and glucose homeostasis. These results highlight Ras GTPase modulation as a potential therapeutic target for improving cellular responsiveness to insulin in type 2 diabetes management.
Keywords
Spermine; Polyamine; Guanosine Triphosphatase (GTPase); GTPase-Activating Proteins (GAPs); Guanine Nucleotide Exchange Factors (GEF); Insulin Receptor Substrate-1 (IRS-1); Goto-Kakizaki Rat (GK Rat)
Introduction
The mammalian pancreas is composed of several cells that play vital roles in energy metabolism. These cells co-exist together in a physiologically homeostatic enclosure, while eliciting their functions in paracrine or endocrine mode [1]. The islet cells of the pancreas are made up of five (5) different cells, responsible for different functions: (1) Alpha-cells, (2) Beta-cells, (3) Delta cells, (4) Epsilon cells and (5) Gamma cells. Despite their distinct functions, these cells work together in a complex regulatory network to maintain energy homeostasis [2]. The unique biochemical and cellular interplay in pancreas cell organization and distribution of most mammalian species is constantly studied to gain more insights into the similarity between human and experimental animals as scientists attempt to study and propose effective management of diabetes mellitus [3].
Presently, diabetes mellitus remains a life-threatening disease, with varied complications ranging from retinopathy, nephropathy, neuropathy, infertility and cardiovascular diseases4. Overall, diabetes mellitus is classified into two types; namely, type I diabetes mellitus and type 2 diabetes mellitus. In type 1 diabetes mellitus, β cells of the pancreas are disrupted and it is considered as an autoimmune disease, leading to impaired insulin secretion. However, the insulin levels are relatively high in type 2 diabetes mellitus, but cells are resistant to the insulin that is present [4]. In their work of, they reported in their study, validating the regulatory function of GTPase in coordinating cell membrane traffic and as a central biochemical process for determining cell survival and cell death as described [5-9]. Similarly, most recently, they provided insights into Ras GTPase effector proteins, with a significant background of how Ras-GTPase mediate signaling process, which has great therapeutic potential, revealing Ras GTPase as central for future research into human disease, due to its ability to promote downstream signaling, protein-protein interaction and cell signal activation. This further corroborated, which had established the biochemical connection between Ras GTPase and the activation of certain Protein Kinases, which promote cell signaling, cell-to-cell interaction and cellular regeneration processes [10]. Thus, research into bioactive compounds like spermine or secondary metabolites that could promote Ras GTPase activity in diabetic GK rats will be essential, as it may provide the needed insight into what may happen to Ras GTPase activity in diabetic and non-diabetic patients [10]. Moreover, most receptor proteins and signal activators are membrane-bound [11], the activation and deactivation functions of the GTPases and their receptors could become the determining factor for cell sensitivity to protein-protein interactions and cell to cell signaling for a wide range of biomolecules entering and exiting through the cell membrane [10,12]. An anti-diabetic study on polyamines by, has clearly demonstrated dysregulated polyamine metabolism in patients with type 2 diabetes [13].
IRS-1 serves as the receptor link or docking protein, whose biochemical state either favour or disfavour insulin binding, the later, being the physiological situation in type 2 diabetes. In the works of [14], they reported how activation of IRS-1 could be linked to type 2 diabetes, revealing that a biochemical link exists between the signaling pathway of IRS-1 activation through phosphorylation reaction codes very recently demonstrated that IRS and certain kinase phosphorylation enhances insulin signaling and sensitivity [14,15].
The Goto Kakizaki (GK) Rat is a suitable animal model for experimenting on type 2 diabetes mellitus. This strain of rat has been used extensively by scientists, including to study type 2 diabetes and also to explore the genetic and physiological characterization of this disease phenotype [16,17].
The GK rat’s characteristics make it the most preferred animal model for studying non-obese type 2 diabetes. GK rat was first developed by selective inbreeding of Wistar rats, after a successive inbreeding process, to get a new strain of GK rat with genetic impairment for glucose tolerance, which is characterized by hyperglycemia, nephropathy and retinopathy from 8-10 weeks of age [18,19]. GK rat polygenic strain characterization has been studied and these was found to reside on three independent loci on chromosome 7, which is involved in type 2 diabetes.
Spermine is a bioactive compound of very important physiological relevance that promotes cell-to-cell signaling, cell regeneration and cell growth in eukaryotic cells, describing the potential role of leveraging the healthy cell regenerative ability, influenced by spermine in cancer and malignancy [20,21]. Spermine and other polyamines have been reported as essential biomolecules responsible for normal cellular metabolism in humans [22]. In the overview study of polyamines by, he revealed the tumor and cancersuppressing effects of spermine and spermidine, through Deoxyribo Nucleic Acid (DNA) methylation of targeted pathological cells, corroborating that polyamines have become bioactive compounds of therapeutic interest in life science research [23,24].
Amongst other polyamines, spermine is considered as a very important polyamine produced by mammalian cells that is involved in ion channel regulation and inhibition of lipid formation [20]. Recent studies show that spermine holds the potential of promoting immune responses and also triggering cell-to-cell communication in mediating cellular metabolite homeostasis [20]. Several biochemical studies in recent times seek to unravel the underlying biochemical disorders [20,21]. Polyamines have been reported to play a vital role in the growth and differentiation of the β cells of the pancreas, where they have been associated with proinsulin biosynthesis and secretion of insulin [22-25]. They are present in millimolar (mM) concentrations in both eukaryotic and Prokaryotic cells [17,22]. Moreover, different genes in eukaryotes and their components are modulated by polyamine-bearing polyamine-encoded proteins that are involved in transcriptional processes [26].
In this work, our focus is to understand the biochemical role of spermine on GTPase and IRS-1 activities and how they possibly affect cellular response to insulin in type 2 diabetes.
Materials and Methods
Chemicals and reagents
All materials used for this study were of analytical and molecular grade and purchased from the following companies: GTPase reagent, GloMax Luminescence assay kits (Promega Corperation, USA), Nras protein (MCE, USA), BUN kit ((Roche Cobas 6000(c501 module), total IRS-1 kit (Elabscience), Glucose meter (Accu-Check), Spermine (MedChemExpress, USA), Dimethylsulfoxide 96% DMSO (MedChem Express, USA), Ethanol (Sigma-Aldrich, USA) Luminometer (version V301001 (VITL Tech, Germany) and Goto Kakizaki (GK) rats were purchased from (CLEA, Japan).
Experimental animals
10-week-old male Goto Kakizaki (GK) rats, weighing 198g to 200g, purchased from CLEA, Japan, were housed in an animal facility at room temperature with a 12-hour day/night cycle and given unlimited access to standard rat feed (Top feeds, Sapele, Delta State, Nigeria) and water ad libitum at the Animal house. The procedure for animal handling and experimentation was approved by the Institutional Ethical Committee on animal use, University of Abuja, with Ethical Clearance Number (UAECAU/2024/018) in line with the Helsinki Declaration of, as revised in [27,28], and also the National Institute of Health (NIH) Guidelines for the care and use of Laboratory Animals [29,30].
Confirmation test
Upon arrival, Goto-Kakizaki (GK) rats underwent biochemical assessments including Blood Urea Nitrogen (BUN) and blood glucose levels to confirm hyperglycemia. A physical examination was also performed. Due to the unavailability of a non-mydriatic camera, retinal imaging (cotton wool spots and dilated intra-retinal hemorrhage) could not be conducted. Nephropathy was assessed via BUN serum assay (Roche Cobas 6000 c501 module, BUN assay kit). Hyperglycemia was determined as described previously [31]. Body weight and blood glucose concentrations were measured using a digital weighing balance and glucometer, respectively.
Determination of Lethal Dose (LD50) for spermine
The LD50 of spermine was determined using a modified protocol [32,33]. Twelve GK rats (mean body weight per group: 198 g) were randomly allocated into six groups (A-F; n=2 per group). Spermine was dissolved in Dimethyl Sulfoxide (DMSO) and administered via serial dose dilution. Group A received 3.16 mg/kg body weight, Group B 6.25 mg/kg, Group C 12.50 mg/kg, Group D 25.00 mg/kg, Group E 50.00 mg/kg and Group F 100.00 mg/kg body weight. Following administration, animals were monitored for 24 hours continuously for clinical signs of toxicity and mortality.
Animal grouping
Fifteen (15) male Goto-Kakizaki (GK) rats, aged 10 weeks and weighing between 198 and 200 g, were randomly assigned to five groups (A-E), with three animals per group (n-3). Before treatment, an acute toxicity (LD50) study was conducted to determine nonlethal spermine dose levels in GK rats. Based on the LD50 findings, oral administration of spermine was initiated. Group A received 25.00 mg/kg body weight spermine, Group B received 12.50 mg/kg, Group C received 6.25 mg/kg, and Group D received 3.13 mg/kg body weight. Group E served as the control group.
Male GK rats were selected because female GK rats exhibit metabolic and polycystic disturbances, as previously reported [34]. Furthermore, ageing female GK rats have been shown to develop hypertrophy, increased body weight, and elevated mortality rates [35]. The use of male GK rats also minimizes variability associated with hormonal fluctuations, thereby providing more stable metabolic and physiological parameters for experimental evaluation [35].
Reagent preparation
All reagents were prepared in accordance with the manufacturer’s instructions under a well-illuminated laminar flow hood. All preparations were appropriately labeled. Since members of the Ras and Rho GTPase subfamilies regulate distinct signalling pathways and cellular functions, and given that Ras proteins constitute a major GTPase subfamily, our initial objective was to optimise the GTPase reaction conditions using the assay kit for Ras-specific luminescence-based detection, following the methodology described in [36].
Reagent preparation for Ras GTPase assay
Reagent A: GTPase-Glo Reagent
Nras protein (2.5 μL, stock concentration) was diluted in GTPase/GAP buffer (20 μL) containing 2 × GTP solution (10 μM GTP, 1 mM DTT) and additional GTPase/GAP buffer (20 μL).
15 μL of this mixture was added to GTPase-Glo buffer (5 mL) supplemented with ADP (50 μL, 10 mM) to generate Reconstituted GTPase-Glo Reagent A.
Reagent B: Spermine Solutions
Spermine was dissolved in DMSO (25 mL) at concentrations corresponding to doses of 3.13, 6.25, 12.50 and 25.00 mg/kg in labeled bottles. Solutions were mixed thoroughly and stored at room temperature. All reagents were equilibrated before administration to GK rats.
Evaluation of the effect of spermine on Ras GTPase activity
Assay procedures
The effects of spermine on Ras GTPase activity were evaluated using the Promega GTPase-Glo™️ Assay (V7681/V7682, Promega, 2020) according to the manufacturer’s instructions. Briefly, serum was extracted from blood samples (0.5 mL, centrifuged at 7000 rpm for 10 min) and incubated with pre-optimized Ras GTPase buffer containing 2 μL serum, 5 μL of 2 × GTP reaction mix and 5 μL of detection reagent at 25°C for 1 hour. Luminescence was subsequently measured using a luminometer. Spermine was administered via intraperitoneal injection at doses of 3.13, 6.25, 12.50 and 25.00 mg/kg body weight once weekly for 6 weeks. Ras GTPase activity assays were conducted at baseline and at weeks 1,3 and 6 post treatment.
IRS-1 ELISA
Total IRS-1 levels were quantified using the Elabscience Enzyme-Linked Immunosorbent Assay (ELISA) kit (E-EL-H554, Elabscience Biotechnology Inc.) following the manufacturer’s protocol. Serum samples (2 μL, obtained from 2 mL blood centrifuged at 7000 rpm for 10 min) were added to IRS-1 antibody-coated wells and incubated with biotinylated detection reagent (10 μL, 1 h, 37°C), Avidin-HRP (10 μL, 1 h, 37°C) and substrate (5 μL, 15 min, 37°C). Absorbance was measured at 450 nm using a microplate reader.
Analysis of results: The data obtained from the study were analyzed using One Way Analysis of Variance (ANOVA) using Statistical Package for Social Sciences (SPSS) version 27. Results are presented as Mean ± SD. The level of significance was set at P< 0.05.
Results
The results of this study, detailing the impact of spermine administration on glucose homeostasis, Ras GTPase activity, and IRS-1 expression in GK rats, are presented in the following section, with data represented in both tabular and graphical formats.
This shows survival and death rates for animals exposed to low and high doses of spermine within 24 hours, for randomly selected GK rats for each group, expressed in mg/kg body weight (average body weight of animals=198g) (Table 1).
| Group | Dose (mg/kg body weight) | Log of dose | Death | Survival | Mortality ratio | % Mortality |
|---|---|---|---|---|---|---|
| A | 3.13 | 0.49 | 0 | 2 | 0/2 | 0 |
| B | 6.25 | 0.79 | 0 | 2 | 0/2 | 0 |
| C | 12.5 | 1.09 | 0 | 2 | 0/2 | 0 |
| D | 25 | 1.39 | 0 | 2 | 0/2 | 0 |
| E | 50 | 1.69 | 1 | 1 | 1/2 | 50 |
| F | 100 | 2 | 2 | 0 | 2/2 | 100 |
Table 1: Determination of spermine lethality in GK rats.
This shows the mean values for BUN before commencement and after 6 weeks of spermine treatment. BUN values dropped significantly across all groups except the control group. However, animals in group A were observed to have shown better BUN values. The BUN values and subsequent experiments were conducted using the maximum tolerated dose determined from the LD50 study (A-D), (Table 2).
| Before | After | ||
|---|---|---|---|
| Group | BUN (mg/dL) | Group | BUN (mg/dL) |
| A | 24.30 ± 1.3 | A | 10.20 ± 0.9 |
| B | 21.42 ± 0.9 | B | 13.61 ± 1.0 |
| C | 26.10 ± 1.0 | C | 14.43 ± 0.7 |
| D | 23.20 ± 1.0 | D | 13.72 ± 1.0 |
| E (control) | 21.90 ± 0.9 | E (control) | 21.89 ± 0.7 |
Table 2: Values for Blood Urea Nitrogen (BUN) before and after spermine treatment.
This shows the mean values for GTPase GAPs and GEF activities, measured in Relative Light Unit (RLU) for GK rats across all groups, before the commencement of administration of spermine. Inactive Ras GTPase readings of 50000 (RLU), suggest that animals, yet to be subjected to spermine administration, showed no Ras GTPase, GAPs and GEF activities (Figure 1).
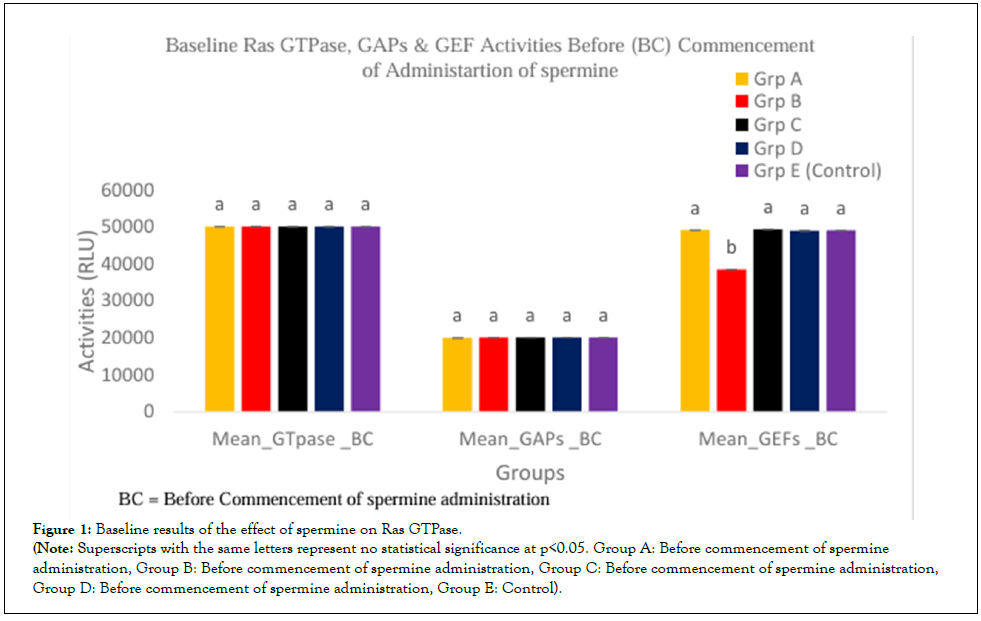
Figure 1: Baseline results of the effect of spermine on Ras GTPase.
(Note: Superscripts with the same letters represent no statistical significance at p<0.05. Group A: Before commencement of spermine administration, Group B: Before commencement of spermine administration, Group C: Before commencement of spermine administration, Group D: Before commencement of spermine administration, Group E: Control).
This showcases the outcome of the experiment at the end of the first week of spermine administration; results for the treated groups and the untreated group showed varied luminometer readings. Active Ras GTPase activities were recorded for groups A and B, treated with 25.00 mg/kg body weight and 12.50 mg/kg body weight of spermine, and luminometer values of about 80000 (8x10⁴) (RLU) were recorded, with corresponding increase in GEF activities for both groups. The results indicate gradual sensitivity of GTPase to spermine across treated groups; after the first week of spermine administration, GTPase remained inactive for groups C, D and the control group (Figure 2).
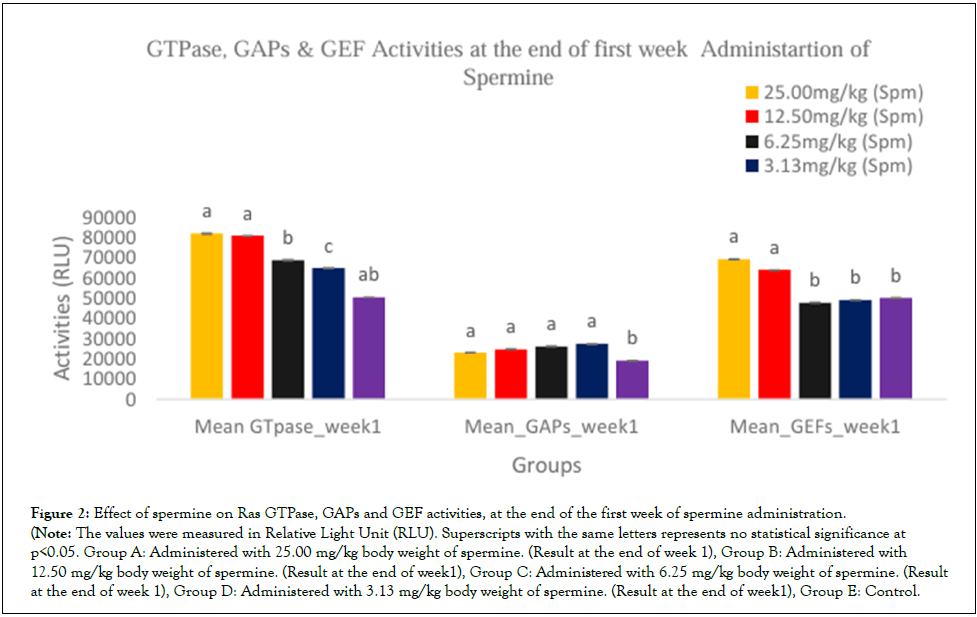
Figure 2: Effect of spermine on Ras GTPase, GAPs and GEF activities, at the end of the first week of spermine administration.
(Note: The values were measured in Relative Light Unit (RLU). Superscripts with the same letters represents no statistical significance at p<0.05. Group A: Administered with 25.00 mg/kg body weight of spermine. (Result at the end of week 1), Group B: Administered with 12.50 mg/kg body weight of spermine. (Result at the end of week1), Group C: Administered with 6.25 mg/kg body weight of spermine. (Result at the end of week 1), Group D: Administered with 3.13 mg/kg body weight of spermine. (Result at the end of week1), Group E: Control.
At the end of six (6At the end of the third week of spermine administration, results showed a very significant increase in Ras GTPase activities across the test groups, with corresponding increase in GEF activities. The control group values remained fairly unchanged, with no Ras GTPase activities at the end of the third week of spermine administration (Figure 3).) weeks of spermine administration, Ras GTPase activity noticeably stabilized among all test groups, as seen in Figure 4. Among the test groups, an increase in GTPase activities translated to an increase in GEF activities across groups. Conversely, an increase in GTPase activities translated to a decrease in GAPs activities. The control group, however, remained inactive from week one (1) through the six (6) weeks of spermine treatment at varied concentrations (Figure 4).
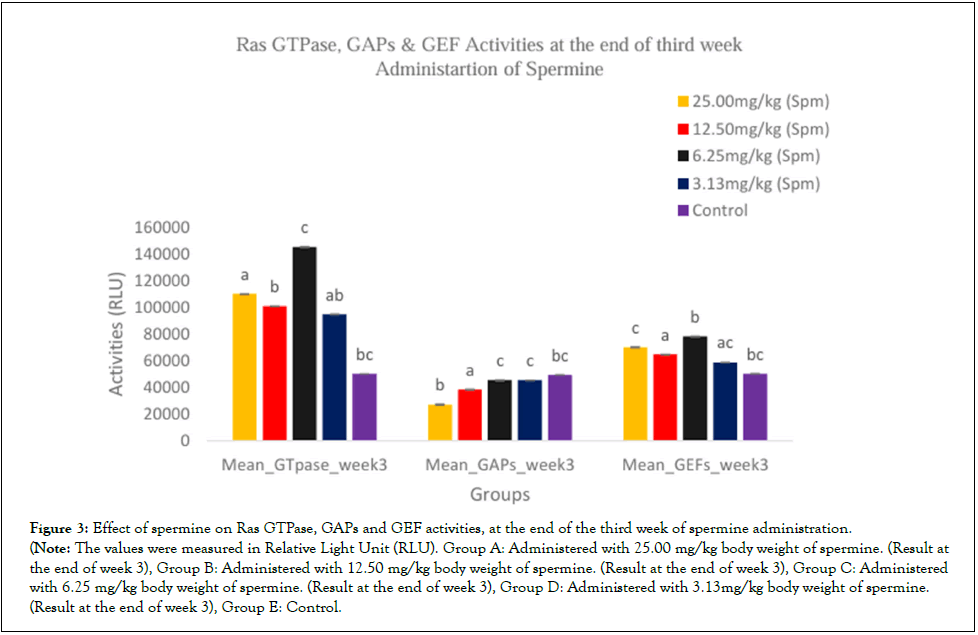
Figure 3: Effect of spermine on Ras GTPase, GAPs and GEF activities, at the end of the third week of spermine administration.
(Note: The values were measured in Relative Light Unit (RLU). Group A: Administered with 25.00 mg/kg body weight of spermine. (Result at the end of week 3), Group B: Administered with 12.50 mg/kg body weight of spermine. (Result at the end of week 3), Group C: Administered with 6.25 mg/kg body weight of spermine. (Result at the end of week 3), Group D: Administered with 3.13mg/kg body weight of spermine. (Result at the end of week 3), Group E: Control.
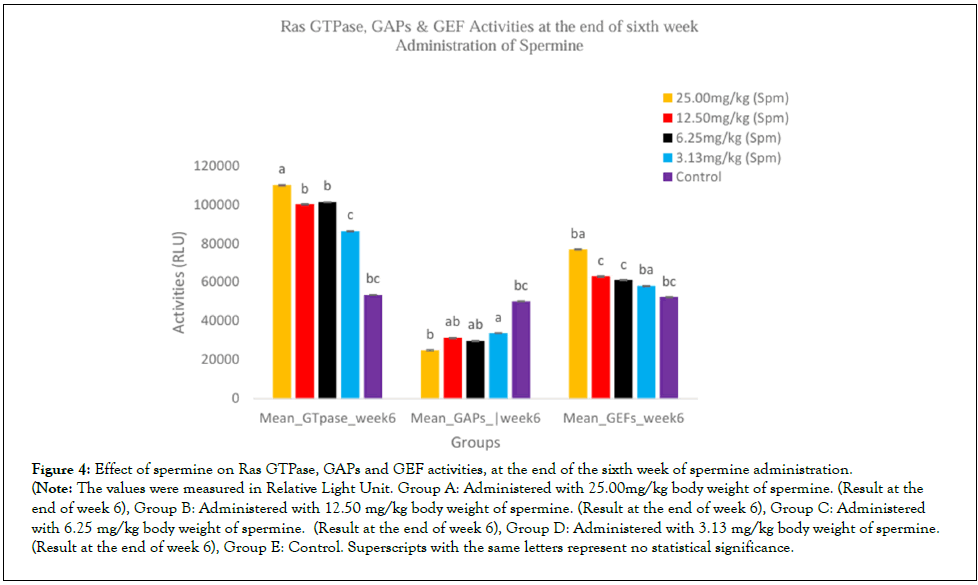
Figure 4: Effect of spermine on Ras GTPase, GAPs and GEF activities, at the end of the sixth week of spermine administration.
(Note: The values were measured in Relative Light Unit. Group A: Administered with 25.00mg/kg body weight of spermine. (Result at the end of week 6), Group B: Administered with 12.50 mg/kg body weight of spermine. (Result at the end of week 6), Group C: Administered with 6.25 mg/kg body weight of spermine. (Result at the end of week 6), Group D: Administered with 3.13 mg/kg body weight of spermine. (Result at the end of week 6), Group E: Control. Superscripts with the same letters represent no statistical significance.
This shows the effect of spermine administration on total IRS-1 concentration in GK rats before commencement of spermine administration, at the end of week 1, at the end of week 3 and at the end of week 6, across all treated groups at varied concentrations. Values show a constant increase in total IRS-1 concentrations from week 1 to week 6, with results of week 6 recording the highest total IRS-1 concentration at 25 mg/kg body weight spermine treatment (Figure 5).
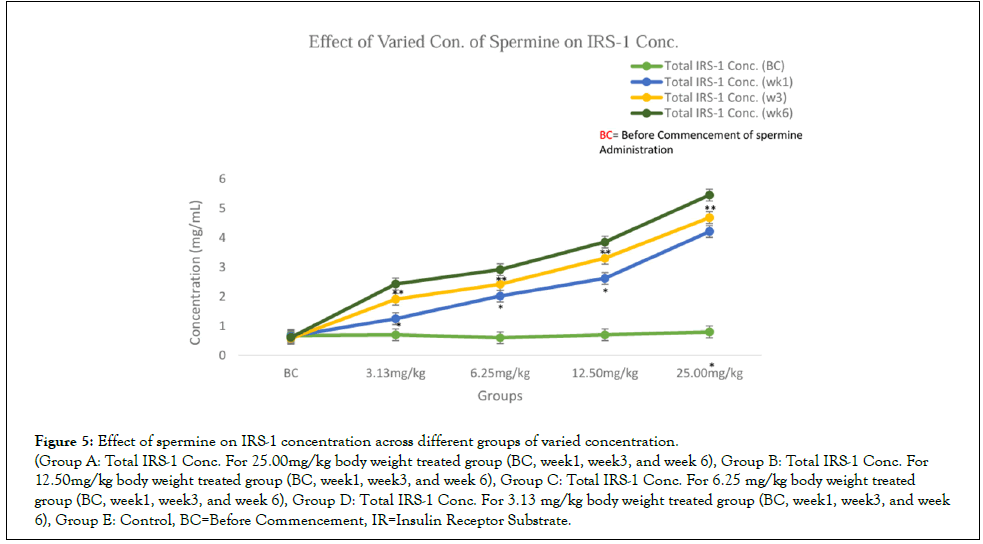
Figure 5: Effect of spermine on IRS-1 concentration across different groups of varied concentration.
(Group A: Total IRS-1 Conc. For 25.00mg/kg body weight treated group (BC, week1, week3, and week 6), Group B: Total IRS-1 Conc. For 12.50mg/kg body weight treated group (BC, week1, week3, and week 6), Group C: Total IRS-1 Conc. For 6.25 mg/kg body weight treated group (BC, week1, week3, and week 6), Group D: Total IRS-1 Conc. For 3.13 mg/kg body weight treated group (BC, week1, week3, and week 6), Group E: Control, BC=Before Commencement, IR=Insulin Receptor Substrate.
This shows the effect of varied concentrations of spermine on blood glucose concentrations in GK rats. There was a significant decrease in glucose level from 12.43 mmol/L to 9.80 mmol/L for group A, which was treated with 25.00 mg/kg body weight spermine after 6 weeks of administration, making it the best-performing decreased glucose concentration for the effect of spermine on blood glucose concentration in GK rats. Glucose levels also dropped significantly for other treated groups B, C and D, as compared to the control group E (Figure 6).
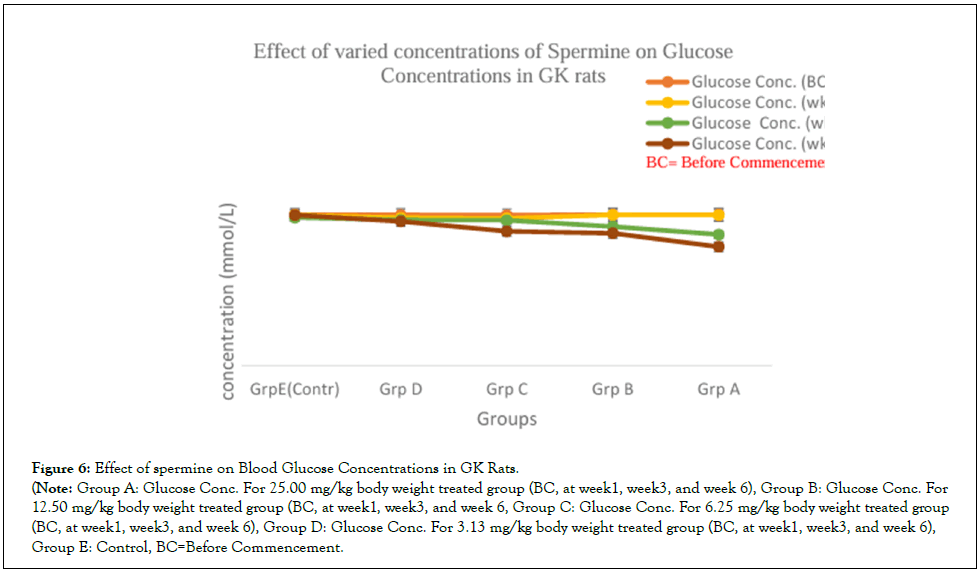
Figure 6: Effect of spermine on Blood Glucose Concentrations in GK Rats.
(Note: Group A: Glucose Conc. For 25.00 mg/kg body weight treated group (BC, at week1, week3, and week 6), Group B: Glucose Conc. For 12.50 mg/kg body weight treated group (BC, at week1, week3, and week 6, Group C: Glucose Conc. For 6.25 mg/kg body weight treated group (BC, at week1, week3, and week 6), Group D: Glucose Conc. For 3.13 mg/kg body weight treated group (BC, at week1, week3, and week 6), Group E: Control, BC=Before Commencement.
This shows the percentage decrease in glucose concentration following administration of a high dose of spermine (25.00 mg/kg body weight) across treatment groups for the first, third and sixth weeks, respectively. Glucose concentration dropped from 12.40 mmol/L at the end of the first week of spermine administration to 9.80 mmol/L at the end of the sixth week of spermine administration, representing a 21.60% decrease (Table 3).
| Weeks | Mean blood glucose Conc. (mmol/L) | Standard Derivation (SD) | Percentage (%) glucose Conc. |
|---|---|---|---|
| 1 | 12.43 | 1.7 | 0.8 |
| 3 | 10.8 | 0.9 | 13.6 |
| 6 | 9.8 | 1.2 | 21.6 |
Table 3: Values for Blood Urea Nitrogen (BUN) before and after spermine treatment.
Discussion
Results from this study show a biochemical link between spermine, Ras GTPase activities, total IRS-1 concentrations and glucose metabolism in GK rats. This is seen in the significant decrease in blood glucose concentrations after six (6) weeks of spermine administration in some of the treated groups.
To effectively monitor ras GTPase activity which primarily function to mediate signal transduction among other GTPase sub-families, it was important that the GTPase-Glo luminescence reaction was first optimized for ras GTPase activity detection. Assaying for GTPase reaction often involves concomitant monitoring of Guanine Activating Proteins (GAPs)-which inhibits downstream signaling and Guanine Nucleotide Exchange Factor (GEF)-which promotes downstream signaling [37]. This luminescence monitoring was possible due to the all-inclusive GAPs, GEF and GTPase reagents and buffers in the Promega GTPase-Glo reaction kits.
Spermine treatment for six weeks resulted in a dose-dependent increase in Ras GTPase activity, accompanied by elevated total IRS-1 concentrations and reduced blood glucose levels in treated GK rats, whereas no significant changes were observed in control animals. These findings agree, suggesting a possible link between IRS-1, Protein Kinase B (PKB) and the phosphorylation triggers of signaling proteins (PI3K). It is known that Ras GTPase is active when it binds GTP, leading to concomitant signal transduction between cells. This signaling, mediated by Ras GTPase, is believed to be amplified via phosphorylation of downstream kinase cascades, leading to PKB activation (with potential GLUT4 translocation) and phosphoinositide 3-kinase (PI3K) activation [38].
The activation of PKB further facilitate the activation of IRS-1 and the activation IRS-1 further triggers the activation of facilitated glucose transport like the Glucose Transporter 4 (GLUT 4), as reported by [39].
Further, based on our results and available data, we propose a spermine-induced mechanism for Ras GTPase activation and IRS-1 modulation as a probable biochemical pathway underlying spermine's effects on glucose homeostasis (Figure 7).
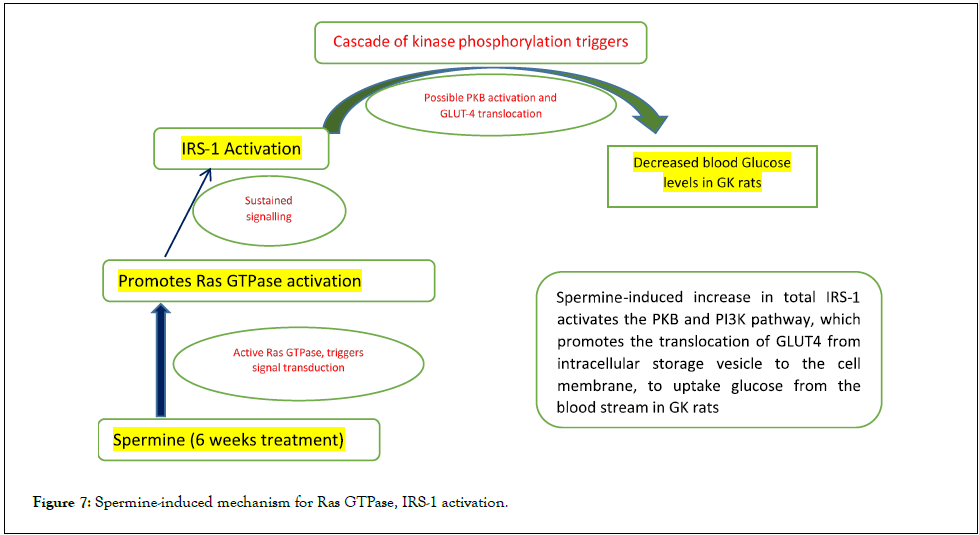
Figure 7: Spermine-induced mechanism for Ras GTPase, IRS-1 activation.
Two (2) families of proteins Guanine Activating Proteins (GAPs) and Guanine Nucleotide Exchange Factors (GEFs), are responsible for the switching process between the active and inactive state, as they mediates the alternating states of the GTPase [40]. GEFs bind the inactive GDP-GTPase, to replace GDP with GTP, enabling the switching on of the active GTP-GTPase state. GAPs are required to hydrolyze the GTP-GTPase bond complex, to release GTP from GTPase and the remaining GTP, converted to GDP, ATP and inorganic phosphate (pi) [40]. The amount of ATP released is measured as luminescence, by the Luminometer using the Promega GTPase-Glo assay kit which is pre-optimized for quantitative Ras GTPase activity measurement.
The ATP measured by the luminometer is based on the "luciferin-luciferase" principle of the optimized Ras GTPase Promega reagent. This reagent facilitates the conversion of available GTP into GDP and ATP following the GTPase-GTP reaction. Active Ras GTPase indicates enhanced Guanine Nucleotide Exchange Factor (GEF) activity, resulting in decreased availability of GTP during the reaction process [40, 41]. A lower GTP concentration leads to reduced ATP detection in the GTPase-Glo assay, signifying an active Ras GTPase-GTP state and consequently sustaining cell signaling processes. In contrast, active Ras GTPase promotes signal transduction, while inactive Ras GTPase is associated with minimal or no signal transduction. Conversely, high GTP levels during the GTPase-Glo assay indicate reduced Ras GTPase activity, leading to impaired signal transduction [40].
Interestingly, Ras GTPase activity progressively increased from the first week of commencement of administration to the sixth week, with proportional decrease in blood glucose values in treated groups. Across the groups, group A animals administered 25mg/kg body weight spermine, recorded most optimal ras GTPase activities, with proportional decrease in blood glucose levels (of group A animals), dropping from 12.43mmol/L at the first week of administration to 9.80mmol/L, representing a 21.60% decrease at the end of week six of spermine administration. A similar increase in Ras GTPase activity was associated with a slight decrease in blood glucose levels in animals administered doses of 12.50 mg/kg and 6.25 mg/kg body weight. Glucose levels decreased from 1245 mmol/L for both groups to 10.50 mmol/L for Group B and 11.15 mmol/L for Group C, respectively.
These findings support available biochemical reports that temporary induced increase in total IRS-1 promotes the activation of glucose Transporter Type 4 (GLUT 4). Glut 4 functions to enhance glucose uptake in muscle and adipose tissue via the insulin Receptor Substrate 1 (IRS-1) [40], whose activation, triggers the activation of GLUT 4 from a cascade of PKB/AKT biochemical reactions [42].
We may therefore draw that a spermine-mediated biochemical link to Ras GTPase signal activation and decreased glucose level, as seen from the data presented in this study, leading to our mechanistic proposition. Protein kinase B (PKB) and phosphoinosol-3 kinase (PIK-3) (PKB, P13K) activation through phosphorylation reactions favour the activity of IRS-1 and Glut 4 [17, 41], leading to GLUT 4 glucose trafficking from the extracellular space and enhancing glucose utilization and maintaining homeostasis [37, 41].
The results presented in this research further enhance available scientific data that bioactive compounds like spermine are important in enhancing insulin sensitivity; it promotes glucose utilization in diabetic GK rats, a non-obese model, known to be genetically stable with a consistent phenotype. Such is possible through the involvement of spermine in further promoting the up-regulation of cell signaling activities, through phosphorylation process involving the kinases [41].
Conclusion
In conclusion, direct up-regulation of Ras GTPase activity in diabetic GK rats by the polyamine spermine, was observed to proportionately account for a significant decrease in blood glucose levels in diabetic GK rats. Hence, 25.00 mg/kg body weight of spermine supplementation may be more beneficial in reducing hyperglycemia and ultimately in the management of type 2 Diabetes Mellitus. Undoubtedly, further studies are needed to have a full understanding of the molecular mechanisms underlying spermine's effects on Ras GTPase activity and cellular signaling, warranting clinical trials to evaluate the safety and efficacy of spermine as a therapeutic agent for type 2 Diabetes Mellitus.
Study Limitation
A limitation of this study was the unavailability of non-mydriatic fundus photography to assess retinopathy (e.g., cotton wool spots, intraretinal hemorrhage). The scope of the study was constrained by funding limitations.
Funding
This research did not receive any specific grant from funding agencies in the public, commercial, or not-for-profit sectors."
Author Statement
The author’s contributions are as follows; Boniface O. Ogar: Conceptualization, Methodology, Original draft preparation. Azuibike A. Okafor: Original draft preparation, Data validation. Kenneth C. Nwachukwua: Data validation, Data Investigation, Data curation. Bassey Inyang: Methodology, Data validation, Visualization. Lukman A. Alli: Data curation, original drafting preparation, Visualization, Supervision. Michael P. Okoh: Conceptualization, Supervision, Data Investigation, Writing reviewing and editing.
References
- Hill TG, Hill DJ. The importance of intra-islet communication in the function and plasticity of the islets of Langerhans during health and diabetes. Int J Mol Sci. 2024;25(7):4070.
[Crossref] [Google Scholar] [Pubmed]
- Gamble A, Pepper AR, Bruni A, Shapiro AJ. The journey of islet cell transplantation and future development. Islets. 2018 Mar 4;10(2):80-94.
[Crossref] [Google Scholar] [Pubmed]
- Sharon N, Chawla R, Mueller J, Vanderhooft J, Whitehorn LJ, Rosenthal B, et al. A Peninsular Structure Coordinates Asynchronous Differentiation with Morphogenesis to Generate Pancreas Islets. Cells. 2019;176(4):790-804.e13.
[Crossref] [Google Scholar] [Pubmed]
- Da Silva Xavier G. The Cells of the Islet of Langerhans. J Clin Med. 2018;7(3):54.
[Crossref] [Google Scholar] [Pubmed]
- Ademaj A, Veltsista DP, Ghadjar P, Marder D, Oberacker E, Ott OJ, et al. Clinical evidence for thermometric parameters to guide hyperthermia treatment. Cancers. 2022;14(3):625.
[Crossref] [Google Scholar] [Pubmed]
- Wiegandt D, Vieweg S, Hofmann F, Koch D, Li F, Wu YW, et al. Locking GTPases covalently in their functional states. Nat Commun 2015; 6:7773.
[Crossref] [Google Scholar] [Pubmed]
- Verma K, Srivastava VK, Datta S. Rab GTPases take centre stage in understanding Entamoeba histolytica biology. Small GTPases. 2020; 11(5):320-333.
[Crossref] [Google Scholar] [Pubmed]
- Mozzarelli AM, Simanshu DK, Castel P. Functional and structural insights into RAS effector proteins. Mol Cell. 2024;84(15):2807-2821.
[Crossref] [Google Scholar] [Pubmed]
- Nan X, Tamgüney TM, Collisson EA, Lin LJ, Pitt C, Galeas J, et al. Ras-GTP dimers activate the mitogen-activated protein kinase (MAPK) pathway. Proc Natl Acad Sci U S A. 2015;112(26):7996-8001.
[Crossref] [Google Scholar] [Pubmed]
- Ashrafizadeh M, Mirzaei S, Hushmandi K, Rahmanian V, Zabolian A, Raei M, et al. Therapeutic potential of AMPK signaling targeting in lung cancer: Advances, challenges and future prospects. Life Sci. 2021; 278:119649.
[Crossref] [Google Scholar] [Pubmed]
- Meagher P, Civitarese R, Lee X, Gordon M, Bugyei-Twum A, Desjardins JF, et al. The Goto Kakizaki rat: Impact of age upon changes in cardiac and renal structure, function. Plos one. 2021;16(6): e0252711.
[Crossref] [Google Scholar] [Pubmed]
- Papur OS, Glatz JF, Luiken JJ. Protein kinase-D1 and downstream signaling mechanisms involved in GLUT4 translocation in cardiac muscle. Biochim Biophys Acta Mol Cell Rez. 2024;1871(6):119748.
[Crossref] [Google Scholar] [Pubmed]
- Zhang H, Wang J, Li L, Chai N, Chen Y, Wu F, et al. Spermine and spermidine reversed age-related cardiac deterioration in rats. Oncotarget. 2017;8(39):64793.
[Crossref] [Google Scholar] [Pubmed]
- Martínez Báez A, Ayala G, Pedroza-Saavedra A, González-Sánchez HM, Chihu Amparan L. Phosphorylation codes in IRS-1 and IRS-2 are associated with the activation/inhibition of insulin canonical signaling pathways. Curr Issues Mol Biol. 2024;46(1):634-49.
[Crossref] [Google Scholar] [Pubmed]
- Tse RT, Wong CY, Chiu PK, Ng CF. The Potential Role of Spermine and its Acetylated Derivatives in Human Malignancies. Int J Mol Sci. 2022;23(3):1258.
[Crossref] [Google Scholar] [Pubmed]
- Ohta T, Sasase T, Gotoh T, Shinohara M, Sirichaiyakul P, Furuta S, et al. Non-Obese Type 2 Diabetic Rat Models-GK Rat and SDT Rat. Open J Anima Sci. 8, 396-420.
- Guest PC. Characterization of the Goto-Kakizaki (GK) Rat Model of Type 2 Diabetes. Methods Mol Biol. 2019;1916:203-211.
[Crossref] [Google Scholar] [Pubmed]
- Xu G, Liu B, Sun Y, Du Y, Snetselaar LG, Hu FB, et al. Prevalence of diagnosed type 1 and type 2 diabetes among US adults in 2016 and 2017: Population based study. BMJ. 2018;362:1497
[Crossref] [Google Scholar] [Pubmed]
- Robertson MA, Padgett LR, Fine JA, Chopra G, Mastracci TL. Targeting polyamine biosynthesis to stimulate beta cell regeneration in zebrafish. Islets. 2020;12(5):99-107.
[Crossref] [Google Scholar] [Pubmed]
- Kanamori Y, Finotti A, Di Magno L, Canettieri G, Tahara T, Timeus F, et al. Enzymatic Spermine Metabolites Induce Apoptosis Associated with Increase of p53, caspase-3 and miR-34a in Both Neuroblastoma Cells, SJNKP and the N-Myc-Amplified Form IMR5. Cells. 2021;10(8):1950.
[Crossref] [Google Scholar] [Pubmed]
- Khan A, Gamble LD, Upton DH, Ung C, Yu DM, Ehteda A, et al. Dual targeting of polyamine synthesis and uptake in diffuse intrinsic pontine gliomas. Nat Commun 2021;12:971.
[Crossref] [Google Scholar] [Pubmed]
- Soda K. Overview of Polyamines as Nutrients for Human Healthy Long Life and Effect of Increased Polyamine Intake on DNA Methylation. Cells. 2022;11(1):164.
[Crossref] [Google Scholar] [Pubmed]
- Fernandez-Garcia JC, Delpino-Rius A, Samarra I, Castellano-Castillo D, Muñoz-Garach A, Bernal-Lopez MR, et al. Type 2 Diabetes Is Associated with a Different Pattern of Serum Polyamines: A Case–Control Study from the PREDIMED-Plus Trial. J Clin Med. 2019;8(1):71.
[Crossref] [Google Scholar] [Pubmed]
- Sanaye MM, Kavishwar SA. Diabetic Neuropathy: Review on Molecular Mechanisms. Curr Mol Med. 2023;23:97-110.
[Crossref] [Google Scholar] [Pubmed]
- Holbert CE, Cullen MT, Casero Jr RA, Stewart TM. Polyamines in cancer: Integrating organismal metabolism and antitumour immunity. Nat Rev Cancer. 2022;22:467-480.
[Crossref] [Google Scholar] [Pubmed]
- Helsinki. WMA declaration: Ethical Principles for Medical Research. 29th WMA General Assembly, Tokyo, Japan, October 1975.
- Helsinki. WMA declaration: Ethical Principles for Medical Research. 52nd WMA General Assembly, Edinburg, Scotland, October 2000.
- The importance of intra-islet communication in the function and plasticity of the islets of Langerhans during health and diabetes
- Nakalembe L, Kasolo JN, Nyatia E, Lubega A, Bbosa GS. Analgesic and anti-inflammatory activity of total crude leaf extract of phytolacca dodecandra in wistar albino rats. Neurosci Med. 2019;10:259-271.
- Wang Z, Yang Y, Xiang X, Zhu Y, Men J, He M. Estimation of the normal range of blood glucose in rats. J Hyg Res. 2010;39(2):133-137.
[Google Scholar] [Pubmed]
- Reed LJ, Muench H. A simple method of estimating fifty per cent endpoints. Am J Hyg. 1938;27:493-495.
- Saganuwan SA. A modified arithmetical method of Reed and Muench for determination of a relatively ideal median lethal dose (LD50). Afr J Pharm Pharmacol. 2011;5(12):1543-1546.
- Bourgneuf C, Bailbé D, Lamazière A, Dupont C, Moldes M, Farabos D, et al. The Goto-Kakizaki rat is a spontaneous prototypical rodent model of polycystic ovary syndrome. Nat Commun. 2021;12(1):1064.
[Crossref] [Google Scholar] [Pubmed]
- Mate NA, Wadhwa G, Taliyan R, Banerjee A. Impact of polyamine supplementation on GnRH expression, folliculogenesis, and puberty onset in young mice. Theriogenology. 2024;229:202-213.
[Crossref] [Google Scholar] [Pubmed]
- Versions V7681 and 7682: GTPase-Glo Assay. Promega Product Use Instructions and protocol, 2020.
- Martínez Báez A, Ayala G, Pedroza-Saavedra A, González-Sánchez HM, Chihu Amparan L. Phosphorylation codes in IRS-1 and IRS-2 are associated with the activation/inhibition of insulin canonical signaling pathways. Curr Issues Mol Biol. 2024;46(1):634-649.
[Crossref] [Google Scholar] [Pubmed]
- Savova MS, Mihaylova LV, Tews D, Wabitsch M, Georgiev MI. Targeting PI3K/AKT signaling pathway in obesity. Biomed Pharmacother. 2023;159:114244.
[Crossref] [Google Scholar] [Pubmed]
- Papur OS, Glatz JF, Luiken JJ. Protein kinase-D1 and downstream signaling mechanisms involved in GLUT4 translocation in cardiac muscle. Biochim Biophys Acta Mol Cell Res. 2024;1871(6):119748.
[Crossref] [Google Scholar] [Pubmed]
- Toma-Fukai S, Shimizu T. Structural insights into the regulation mechanism of small GTPases by GEFs. Molecules. 2019;24(18):3308.
[Crossref] [Google Scholar] [Pubmed]
- Manning BD, Toker A. AKT/PKB signaling: navigating the network. Cell. 2017;169(3):381-405.
[Crossref] [Google Scholar] [Pubmed]
- Woo JR, Bae SH, Wales TE, Engen JR, Lee J, Jang H, et al. The serine phosphorylations in the IRS-1 PIR domain abrogate IRS-1 and IR interaction. Proc Natl Acad Sci. 2024;121(17):2401716121.
[Crossref] [Google Scholar] [Pubmed]
Citation: Ogar BO, Okafor AI, Nwachukwu KC, Inyang BA, Okoh M P, Alli LA. (2026). Modulation of Ras GTPase and IRS-1 Activities by Spermine in Type 2 Diabetes: A Study Using Goto Kakizaki Rat Model. Diabetes Case Rep. 11:278.
Copyright: �?�© 2026 Ogar BO, et al. This is an open-access article distributed under the terms of the Creative Commons Attribution License, which permits unrestricted use, distribution and reproduction in any medium, provided the original author and source are credited.