

Indexed In
- Academic Journals Database
- Open J Gate
- Genamics JournalSeek
- Academic Keys
- JournalTOCs
- China National Knowledge Infrastructure (CNKI)
- CiteFactor
- Scimago
- Ulrich's Periodicals Directory
- Electronic Journals Library
- RefSeek
- Hamdard University
- EBSCO A-Z
- OCLC- WorldCat
- SWB online catalog
- Virtual Library of Biology (vifabio)
- Publons
- MIAR
- University Grants Commission
- Geneva Foundation for Medical Education and Research
- Euro Pub
- Google Scholar
Useful Links
Share This Page
Journal Flyer
Open Access Journals
- Agri and Aquaculture
- Biochemistry
- Bioinformatics & Systems Biology
- Business & Management
- Chemistry
- Clinical Sciences
- Engineering
- Food & Nutrition
- General Science
- Genetics & Molecular Biology
- Immunology & Microbiology
- Medical Sciences
- Neuroscience & Psychology
- Nursing & Health Care
- Pharmaceutical Sciences
Research Article - (2020) Volume 12, Issue 4
Model-Based Elaboration of a Limited Sampling Strategy in the Bioequivalence Assessment of Highly Variable Dabigatran
Cassandre Legault and Jun Li*Received: 05-May-2020 Published: 28-May-2020, DOI: 10.35248/0975-0851.20.12.396
Abstract
Background: The bioequivalence (BE) assessment of generic (Test) and brand name (Reference) formulations of drugs with steep exposure-response relationships exhibiting high pharmacokinetic (PK) variability such as dabigatran represent an expensive challenge for pharmaceutical companies. Supported by the population pharmacokinetics (pop-PK) approach, the present article investigates modelling potential to assess BE using a reduced number of blood samples.
Methods: Pop-PK models for the Reference and Test formulations were developed retrospectively using standard modeling techniques for a BE study of dabigatran. Reduced sampling scenarios were selected and the developed pop- PK models were refitted on each dataset for the respective formulations. These models were simulated to generate virtual PK profiles to be tested with the standard BE criteria, in order to identify the scenarios maintaining the original BE conclusions with the least samples required.
Results: The BE study original data was best described as a pop-PK model presenting two compartments with first order elimination and absorption, as well as an absorption lag time. Sex was identified as a significant covariate with impact on bioavailability. Using a rational sampling selection procedure under the framework of modeling and simulation, the results proved that the BE verdict could be maintained with only five of the 20 original blood samples using the current regulatory BE standards and criteria.
Conclusion: We conclude that the pop-PK model-based BE assessment can be an efficient tool for aiding the BE assessment of dabigatran by significantly reducing the number of samples required, and consequently lower trial costs and increase benefits for enrolled participants.
Keywords
Bioequivalence; Pop-PK modelling; Reduced sampling strategy; Dabigatran; Highly variable drugs
Introduction
The manufacture of generic drugs is an important part of pharmaceutical industry worldwide. In fact, close to 90% of current prescriptions in the United States and 70% in Canada are generics [1], since their inexpensive pricing allows patients a relatively easy access to innovative therapies. For a pharmaceutical company investing in generic drug development, holding the majority share of a highly competitive and profitable market by being the first regulatory approved generic formulation is a priority.
For drugs with high intra-individual variability as well as steep exposure-response relationship such as dabigatran [2,3], this endeavor is particularly arduous. The high variability indicates that a large number of subjects will be required to conclude in favor of bioequivalence (BE) with a sufficient power, resulting in more
expensive studies. Moreover, the presence of an abrupt expositionresponse relationship for dabigatran prevents the use of widened BE limits suggested by regulatory agencies for highly variable drugs [4]. As a result, the odds of failing a BE trial are increased for tested dabigatran generics. These peculiarities render the task of demonstrating BE between the Test formulation (the generic not yet approved) and the Reference product (currently marketed drug) of dabigatran extremely difficult, as well as often overpriced, in the development period under the current framework of BE practices supported by regulatory agencies.
Population pharmacokinetic (pop-PK) modeling is a computational approach that can provide solutions to these concerns. Pop-PK does not present a strict requirement in terms of the number or timing of blood samples for each subject, in contrast to other approaches that usually need many observed concentrations (“rich” sampling data) to characterize the pharmacokinetics (PK) of a molecule [5]. However, the rule of same number and timing of samples must be maintained for both formulations in order to preserve the integrity of the double-blind criterion expected in a BE trial. Otherwise, the drug given to a subject could be identified and thus make the results biased. Moreover, a pop-PK model-based approach renders unnecessary the use of a replicate design to determine the inter-individual variability of the Reference formulation, which is time-consuming and expensive in practice. Although the current regulatory guideline for BE assessment is the final golden standard, applying a pop-PK model approach in the development process of a dabigatran generic could significantly improve the study design and efficiently reduce the costs of subsequent BE trials.
In this article, we will investigate the potential of developing a pop- PK modeling approach to improve the efficiency and cost in the BE evaluation for highly variable drugs such as dabigatran. Based on the results, a model-based reduced sampling strategy will be proposed to assist in the BE assessment of these drugs in their future generic development.
Materials and Methods
Study data
The data used to build the pop-PK model was extracted from a single dose, 2-period, 2-sequence, crossover comparative bioavailability study performed by Altasciences. The aim of the trial was to determine the BE of a dabigatran Test formulation under development to a Reference product in the market. The Reference formulation used was Pradaxa® [dabigatran etexilate mesylate, developed by Boehringer Ingelheim Pharmaceuticals Inc, application number N022512] 150 mg capsules, available upon prescription. Dabigatran etexilate mesylate is a non-hygroscopic yellow-white powder with no chiral centres, a melting point occurring close to 180°C, two dissociation constants (pKa1 at 4.0 and pKa2 at 6.7), an apparent partition coefficient of 3.8 and an increased solubility in acidic pH (water solubility of 1.8 mg/ mL) [2]. The study population was comprised of healthy male and female volunteers. Sixteen subjects were included in the pop-PK dataset, corresponding to 640 plasma concentrations values.
Population pharmacokinetic modelling
The pop-PK modeling was processed using the NONMEM software (NONMEM® 7.4, ICON Development Solutions) assisted with Perl-speaks-NONMEM (PsN). The whole procedure followed the standard model selection process using the first-order conditional estimation method, a widely accepted pop-PK model building algorithm [6]. The selection process of models was based on goodness-of-fit plots, precision of model parameter estimates as well as the difference in the minimum values of the objective function as provided by NONMEM [5,6].
Reference base and final models
To develop a generic formulation (Test), adequate available PK information on the already approved brand name product (Reference) was supposed. This generally means a sufficient number of collected concentrations of active ingredient of the Reference product is accessible. Since rich information on PK is a prerequisite in routine BE trials, this requirement in the design of model-based BE assessment was deemed reasonable and kept.
Under this assumption, a base pop-PK model was developed with the available rich data of the Reference product. Then, the standard stepwise forward-inclusion and backward-exclusion were performed for the statistical significance of each covariate on the base model. Significant covariates were added to the pop-PK base model to obtain the final pop-PK model. This final pop-PK model was then validated through two internal methods: a visual predictive check (VPC) and a bootstrap analysis.
As the second assumption, it was further assumed that the pop- PK model of the Reference product was suitable for the Test formulations in terms of model structure such as the number of compartments, the mechanics of absorption and elimination processes. This inference is predicated upon the fact that Test formulations are comprised of the same active ingredient as the Reference product, and are designed to be similar in terms of absorption and exposure to meet the requirements of BE assessment [7]. Hence, after validation, the final pop-PK model of the Reference product was used to refit the dataset of the Test formulation to obtain its own pop-PK model. As discussed above, the putative pop-PK model structure for both the Reference and Test formulations is an appropriate hypothesis since we assumed both should share the same pharmacological features as a manufacturing requirement, with only very limited differences in terms of their parameter estimates [8]. Thereby, the cumbersome requirement in data collecting and model building procedure for the Test formulation can be simplified such that a reduced sampling of blood concentration of the Test formulation could be possible.
Bioequivalence verdict
The purpose of the current study was to investigate the potential of using a pop-PK model-based approach to reduce the number of blood samples of the Test and Reference formulations as required in a standard BE trial (Figure 1).

Figure 1: Model-based limited sampling procedure to evaluate the BE of drug formulations.
To do so, various reduced sampling scenarios were chosen from the original sampling scheme for the Test formulation. The corresponding pop-PK models for the Test formulation were obtained by refitting the final pop-PK model of the Reference product to these datasets of Test formulation of reduced sampling scenarios. The simulated concentration datasets following the original complete sampling scheme of these scenario specific pop- PK models were compared with Reference product data using the standard BE testing procedure.
The determination of BE between a Test formulation and a Reference product is done through statistical tests of balanced subjects, which compare their respective PK parameters of rate and extent of drug exposure such as Cmax, AUC0-T and AUC0‑∞ [4]. These parameters are obtained by performing a non-compartmental analysis (NCA) on the full drug concentration-time data of each subject. In this instance, the pop-PK models of the Reference and Test formulations were used to simulate the full PK profiles for sampling concentrations of multiple virtual subjects used for different reduced sampling scenarios for the Test and Reference products.
As recommended in the FDA Guidance [4], these estimated AUCs and Cmax were first log-transformed, then their geometric least-squared means (LSmeans) were calculated. The 90% confidence interval (CI) for the exponential of the difference in LSmeans between the Test and Reference products (Test to Reference ratio of geometric LSmeans) were calculated for the log-transformed parameters of Cmax, AUC0-T and AUC0-∞, which were obtained from the NCA analysis. BE was declared if all CIs of these ratios were within the standard BE range of 80.00% to 125.00%.
Reduced sampling scenarios
The original sampling dataset available for the Test formulation included 20 sampling time points. From this complete sampling dataset, several sub-datasets with reduced number of sampling times were chosen to investigate reduced sampling scenarios. For all these sampling scenarios, several key time points were kept based on know dabigatran PK properties, such as the expected Cmax, the inter- and intra-subject variation around Cmax and its elimination half‑life. According to known data on dabigatran [2], it is expected to attain Cmax within 2 hours with close to 50% of variability, and eliminated with a half-life of approximately 10 hours. Consequently, the time points at hours 1, 2, 3 and 8 were relevant to these properties and were kept in all chosen sampling scenarios to adequately represent the drug PK profile. Moreover, the predose time point (at 0 hour) was kept for clinical reason to reflect the actual BE testing environment. Thus, sub-datasets with 19, 15, 10, 8, 6, 5 and 4 of the original 20 samples were generated by removing time points from the complete sampling dataset. In the evaluation plan, multiple combinations of different time points were considered.
As a technical measure for quality control, when fitting with the final pop-PK model of the Reference product to these sub-datasets of Test formulation, the minimum number of samples that can be judged for an adequate modeling of the PK profile of Test formulation was determined until the model could no longer converge (“minimization terminated” in NONMEM output). Using the pop-PK model obtained for each of these limited sampling scenarios, the PK profiles were simulated to produce a complete synthetic sampling scenario for the Test formulation. Based upon these simulated data, Cmax, AUC0-T and AUC0-∞ parameters were calculated using NCA approach. A standard BE test was subsequently performed between the Test and Reference formulations using these PK parameters. For each of these limited sampling scenarios, the BE results were thereafter compared to the primary BE conclusions obtained based on the original sampling datasets of the Test and Reference formulations. The scenario with the least number of samples while being able to maintain the BE conclusion was identified.
Additional metrics
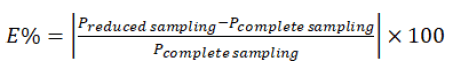
In fact, when sampling numbers are reduced, there is a direct impact on the estimation of various PK parameters compared to that of the original complete samplings. To investigate how close the NCA results of the reduced sampling scenario are to those obtained from the original sampling dataset, which are in terms of the Test/Reference ratios of Cmax, AUC0-T and AUC0-∞ that are used in BE assessment, we calculate the absolute relative prediction error (E) as described below:
 Equation (1)
 Equation (2)
where Pi indicates the Test/Reference value of the concerned NCA PK parameters for each subject in the original complete data or simulated ones with the same characteristics.
Since the standard pop-PK modeling in NONMEM is based on algorithms of linear approximation, the convergence of a model for a given dataset is a crucial issue. This means, given a dataset, there is no absolute guarantee from NONMEM that successful estimates of the parameters will be obtained. To measure the likelihood of a successful modeling for a specific sampling scheme, its convergence success rate was also computed. Using the bootstrap tool provided by Pearl Speaks NONMEM (PsN) [5], this success rate for a specific reduced sampling scheme was estimated by fitting the corresponding Reference pop-PK model to multiple datasets, each consisting of subjects resampled from the original dataset, and then summarizing across the model fits. For each reduced scenario, 500 replicates were done, and the number of successful convergences was recorded. This metric presented in Equation 3 was performed and compared across all the reduced sampling models:
 Equation (3)
Results
Population pharmacokinetic model of the reference product
By performing the standard pop-PK modeling procedure on the data of Reference product, plasma concentrations were best described by a two-compartment linear disposition model with first order elimination and absorption, and a lag time was identified as relevant for absorption. The base and final Reference model parameters estimates are shown in Appendix 1 (Table 1). The final parameters were estimated with good precision (relative standard error [RSE] ≤ 34.7%). The goodness of fit plots are presented in Appendix 2 (Figure 2).
| Parameters1 | Description | Base model value (RSE) | Final model value (RSE) |
|---|---|---|---|
| CL (L/h) | Clearance | 146 (10.30%) | 183 (11.6%) |
| V2 (L) | Volume of distribution, central compartment | 522 (34.30%) | 677 (23.5%) |
| Ka (h-1) | First-order absorption rate constant | 0.426 (30.30%) | 0.445 (21.8%) |
| V3 (L) | Volume of distribution, peripheral compartment | 525 (16.90%) | 686 (16.2%) |
| Q (L/h) | Inter-compartmental clearance | 61.2 (16.30%) | 85.8 (14.5%) |
| Tlag (h-1) | Absorption lag time | 0.455 (1.80%) | 0.456 (1.6%) |
| F | Relative bioavailability | 1* | 1* |
| Sex | Effect of sex on F | - | 0.545 (34.7) |
| IIV V2 (CV%) | IIV in the apparent volume of distribution of the central compartment | 42.90 (26.90%) | 44.3 (7.5%) |
| IIV F (CV%) | IIV in the relative bioavailability | 31.10 (17%) | 30.6 (14.3%) |
| PRV (%) | Proportional residual variability | 0.458 (8.30%) | 0.444 (7.5%) |
| ARV (%) | Additive residual variability | 0.001* | 0.001* |
| 1Model parameters selected based on NONMEM’s ADVAN4 TRANS4 routine *Parameters fixed CV: Coefficient of Variation; IIV: Inter-Individual Variability; RSE: Residual Standard Error |
|||
Table 1: The reference pop-PK model (Appendix 1).

Figure 2: Goodness-of-fit plots for the final pop-PK model of the reference (Appendix 2).
In the final Reference model, sex was the only covariate that influenced bioavailability (F) and explained part of its variability, albeit slightly.
Validation of the reference and test population pharmacokinetic models
The validated final Reference model was used to fit the Test formulation data. The estimates of parameters were sensibly the same as shown in Table 2.
| Parameters1 | Description | Reference model (RSE) | Test model (RSE) |
|---|---|---|---|
| CL (L/h) | Clearance | 183 (11.6%) | 184 (14.9%) |
| V2 (L) | Volume of distribution, central compartment | 677 (23.5%) | 728 (37.5%) |
| Ka (h-1) | First-order absorption rate constant | 0.445 (21.8%) | 0.416 (24.8%) |
| V3 (L) | Volume of distribution, peripheral compartment | 686 (16.2%) | 751 (21%) |
| Q (L/h) | Inter-compartmental clearance | 85.8 (14.5%) | 91.8 (23.7%) |
| Tlag (h-1) | Absorption lag time | 0.456 (1.6%) | 0.455 (1.9%) |
| F | Relative bioavailability | 1* | 1* |
| Sex | Effect of sex on F | 0.545 (34.7) | 0.358 (56.4%) |
| IIV V2 (CV%) | IIV in the apparent volume of distribution of the central compartment | 44.3 (7.5%) | 54.0 (14.1%) |
| IIV F (CV%) | IIV in the relative bioavailability | 30.6 (14.3%) | 46.8 (20.7%) |
| PRV (%) | Proportional residual variability | 0.444 (7.5%) | 0.54 (14.1%) |
| ARV (%) | Additive residual variability | 0.001* | 0.001* |
*Parameters fixed
CV: Coefficient of Variation; IIV: Inter-Individual Variability
Table 2: Parameter estimates of the Reference and Test population pharmacokinetic models.
Using both the Test and Reference pop-PK models, NCA analyses were performed. Simulated Test/Reference ratio of PK parameters Cmax, AUC0-T and AUC0-∞ were obtained and compared to the standard NCA BE analysis originally performed (Table 3). It can be seen that all BE conclusions of the original dataset were maintained though there is a small change in values for the ratios of Test/Reference with pop-PK models.
| BE Parameters | Standard NCA Ratio (%) | Model Simulated Ratio (%) |
|---|---|---|
| Cmax | 84.36 | 84.29 |
| AUC0-T | 87.47 | 93.98 |
| AUC0-8 | 87.83 | 94.2 |
Table 3: Comparison of Test/Reference bioequivalence ratios.
These results confirmed that the Reference’s pop-PK model was indeed suitable for the Test formulation in terms of model structure such as the number of compartments, the mechanics of absorption and elimination processes, as was assumed at the beginning of this study.
Elaboration of the limited sampling scenarios
With this validated premise, reduced sampling scenarios carefully selected as explained in the Methodology. The investigated reduced sampling scenarios are presented in Table 4.
| Number of Samples | Time Points Preserved (hours post administration) |
|---|---|
| 20 (Original Sampling) | 0, 0.25, 0.5, 0.75, 1, 1.25, 1.5, 1.75, 2, 2.5, 3, 4, 6, 8, 12, 16, 24, 36, 48, 60 |
| 19 | 0, 0.5, 0.75, 1, 1.25, 1.5, 1.75, 2, 2.5, 3, 4, 6, 8, 12, 16, 24, 36, 48, 60 |
| 15 | 0, 0.5, 1, 1.25, 1.75, 2, 2.5, 3, 4, 8, 12, 16, 24, 36, 60 |
| 10 | 0, 1, 1.75, 2, 2.5, 3, 8, 16, 24, 36 |
| 8 | 0, 1, 1.75, 2, 3, 8, 16, 36 |
| 6 | 0, 1, 2, 3, 8, 36 |
| 5 | 0, 1, 2, 8, 36 |
| 4 | 0, 1, 3, 24 |
Table 4: Limited sampling scenarios.
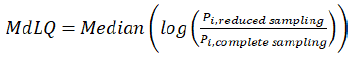
To evaluate the performance of each scenario, the Test/Reference ratios of NCA PK parameters used in BE assessments were calculated and were compared to that from the original complete samplings using the absolute relative prediction error E (Equation 1) and median logarithm accuracy ratio MdLQ (Equation 2).
The results show that the original BE conclusions were maintained for every reduced sampling scenarios in terms of all concerned parameters in BE assessment (Appendix 4) (Table 5) when the number of samples was reduced. In fact, it is natural to see an increase of the absolute relative prediction error E of the Cmax, AUC0-T and AUC0-∞ values and MdLQ because of the information loss by the reduction of sampling numbers (Table 6).
| Number of Samples | Lower 90% CI Limit (%) | Ratio Test/Reference (%) | Upper 90% CI Limit (%) | Bioequivalence Conclusion |
|---|---|---|---|---|
| Cmax | ||||
| 20 | 72.23 | 84.29 | 98.36 | - |
| 19 | 72.25 | 84.31 | 98.38 | Maintained |
| 15 | 74.51 | 86.57 | 100.59 | Maintained |
| 10 | 62.63 | 78.98 | 99.6 | Maintained |
| 8 | 66.18 | 80.96 | 99.04 | Maintained |
| 6 | 76.11 | 88.12 | 102.03 | Maintained |
| 5 | 74.85 | 87.23 | 101.67 | Maintained |
| AUC0-T | ||||
| 20 | 82.92 | 93.98 | 106.51 | - |
| 19 | 82.92 | 93.99 | 106.53 | Maintained |
| 15 | 84.51 | 95.95 | 108.95 | Maintained |
| 10 | 80.35 | 92.13 | 105.63 | Maintained |
| 8 | 80.84 | 92.78 | 106.47 | Maintained |
| 6 | 86.21 | 99.03 | 113.77 | Maintained |
| 5 | 86.3 | 98.52 | 112.47 | Maintained |
| AUC0-8 | ||||
| 20 | 83.11 | 94.2 | 106.78 | - |
| 19 | 83.11 | 94.21 | 106.79 | Maintained |
| 15 | 84.92 | 96.43 | 109.51 | Maintained |
| 10 | 82.04 | 96.79 | 114.18 | Maintained |
| 8 | 81.67 | 95.11 | 110.76 | Maintained |
| 6 | 86.18 | 99.44 | 114.74 | Maintained |
| 5 | 86.41 | 99.21 | 113.9 | Maintained |
Table 5: Comparison of bioequivalence results (Appendix 4).
| Number of Samples | PK Parameter | E (%) (Test/Reference ratio) | MdLQ (Test/Reference ratio) |
|---|---|---|---|
| 19 | Cmax | 0.02 | 0 |
| AUC0-T | 11.51 | 0 | |
| AUC0-8 | 11.77 | 0 | |
| 15 | Cmax | 2.7 | -0.02 |
| AUC0-T | 13.83 | -0.01 | |
| AUC0-8 | 14.4 | -0.01 | |
| 10 | Cmax | 6.3 | -0.01 |
| AUC0-T | 9.3 | 0.01 | |
| AUC0-8 | 14.83 | 0 | |
| 8 | Cmax | 3.95 | -0.01 |
| AUC0-T | 10.07 | 0 | |
| AUC0-8 | 12.84 | 0 | |
| 6 | Cmax | 4.54 | -0.02 |
| AUC0-T | 17.49 | -0.01 | |
| AUC0-8 | 17.97 | -0.01 | |
| 5 | Cmax | 4.54 | -0.02 |
| AUC0-T | 17.49 | -0.01 | |
| AUC0-8 | 17.97 | -0.01 |
Table 6: Comparison of BE results using the absolute relative prediction error and median log accuracy ratio.
To have a visual check of the simulated PK profiles, we simulated all scenarios and compared them to the profile of the complete sampling dataset (20 samples), and it can be observed that they are very close to the full data (Figure 3, panel A). However, it is noteworthy the highest variability between the complete sampling profile and the sparse sampling scenarios was situated around the Cmax (Figure 3, panel B). This is a local difference that may influence the comparison of Cmax. Since our BE assessment is between the same reduced scenarios of Reference and Test, this difference was almost equally changed for both and thus reduced the influence.

Figure 3: Pharmacokinetic profiles of the simulated reduced sampling scenarios (solid lines) compared to the complete sampling (dotted line).
Robustness of the reduced sampling scenarios
While reducing the number of samples as provided in Table 4, both the Reference and Test final models were able to converge, with the exception of the scenario with only four samples. This model displayed parameters estimates; however, the minimization process was terminated (convergence rate of 0%, as displayed in Table 7). Thus, the sampling scenario with five samples was selected as a conservative approach.
| Number of Samples | 20 (Original Sampling) | 19 | 15 | 10 | 8 | 6 | 5 | 4 |
|---|---|---|---|---|---|---|---|---|
| Convergence Success Rate (%) | 75 | 77 | 82 | 86 | 83 | 71 | 62 | 0 |
Table 7: Sampling scenarios and their respective convergence success rates.
To identify the optimal combination of five samples, multiple scenarios were explored and compared with their absolute relative prediction errors, MdLQ, integrity of BE verdict and convergence success rates (Table 8).
| Time Points Preserved | Cmax ratio E (%) | AUC0-T ratio E (%) | AUC0-∞ ratio E (%) | Cmax ratio MdLQ | AUC0-T ratio MdLQ | AUC0-∞ ratio MdLQ | BE Verdict Preserved | Convergence Success Rate (%) |
|---|---|---|---|---|---|---|---|---|
| 0, 0.5, 1, 3, 4 | - | - | - | - | - | - | - | 0 |
| 0, 0.5, 4, 6, 8 | - | - | - | - | - | - | - | 0 |
| 0, 1, 2, 12, 24 | 3.45 | 3.69 | 3.79 | -0.01 | 0.01 | 0.01 | No | 54 |
| 0, 1, 2, 3, 24 | 5.96 | 2.4 | 2.17 | -0.02 | -0.01 | -0.01 | Yes | 52 |
| 0, 1, 2, 3, 8 | - | - | - | - | - | - | - | 0 |
| 0, 1, 2, 8, 16 | 1.52 | 1.94 | 22.55 | 0 | -0.01 | -0.09 | No | 94 |
| 0, 1, 2, 8, 36 | 3.49 | 4.83 | 5.32 | -0.02 | -0.01 | -0.01 | Yes | 80 |
| 0, 1.5, 3, 12, 16 | 6.07 | 4.43 | 4.6 | 0.03 | 0.01 | 0.01 | No | 60 |
| 0, 2, 6, 10, 24 | 10.89 | 6.1 | 6.08 | -0.05 | 0 | 0 | No | 72 |
| 0, 2, 6, 8, 24 | 0.25 | 8.13 | 7.99 | 0 | 0.01 | 0.01 | No | 90 |
Table 8: Comparison of five samples scenarios sub-datasets.
The scenarios without any time point within the elimination phase (after 20 hours) were not able to converge successfully or maintain the BE verdict. The sampling scenario with the highest convergence success rate still preserving the conclusions was the combination of the following time points: 0, 1, 2, 8, 36, which included two time points close to the expected Cmax (1 and 2 hours) as well as points in the first (8 hours) and the second elimination slope (36 hours).
Discussion
As shown in the current study, the pop-PK modeling approach is a promising BE evaluation tool for developing new generic formulations of dabigatran, where BE clinical trials are often expensive and of low success rate. By using only a small number of samples, this model-based approach shows a great advantage compared to standard data-based evaluation method for BE trials, which can only be performed with a rich and complete sampling dataset. Not suggested to replace the current regulatory guidelines, this approach provides an economic and efficient way to help quickly pinpoint to-be-rejected or promising Test formulations as early as possible in generic drug development. It is certain that the later should further go through a more thorough standard BE test before entering market.
The pop-PK models of this study developed from the full dataset were successfully refitted for all selected reduced sampling scenarios with at least 5 samples. The BE testing demonstrated that BE conclusions could be maintained for all relevant PK parameters in these scenarios. As shown in Figure 3 and Appendix 4 (Table 5), most of the variability was observed around Cmax values, which in turn influenced the area under the curve measures obtained from the NCA analysis. Dabigatran is a highly variable drug, with intra-subject coefficient of variation above 50% for Cmax [2]. The model also reflected this variability, with relatively high residual errors observed for both volumes of distribution (both V2 and V3) and first-order absorption rate constant (ka) values. Although the AUC values were affected by the variability of the Cmax values as shown in Table 6 by considerable absolute relative prediction errors observed, these deviations were not substantial in the overall characterization of the PK profile. The only disparity was in the Cmax region, however the results were not influenced in this study, as the impact was equal on both the Test and Reference pop-PK models. Further investigation of BE conditions on this parameter is needed for the modeling approach.
The realisation of this project demonstrated how accurately the Reference data could be used to build the frame of the Test pop- PK model. Indeed, the parameters estimates of both the Reference and the Test models were similar. Thus, the assumption that future BE testing can be accomplished through pop-PK modeling of Reference data is correct. Therefore, generic industries could replicate a similar methodology for other highly variable drugs, without prior Test formulation data as a must. Moreover, as the generic development is a step-by-step process, the identified key sampling time points could be repeated for future dabigatran BE trials, thereby significantly reducing subsequent clinical costs. In our case, the preferred scenario predictably included sampling times corresponding to known critical PK elements, such as the Cmax and elimination phase.
Therefore, as long as the Reference final pop-PK model could be obtained from prior study, public information or available data of Reference product, we may propose a new paradigm of modelbased approach for future studies of new Test formulations in their developing period following the procedure outlined in Figure 4.

Figure 4: Model-based limited sampling procedure to evaluate the BE of future test formulation.
Since the key sampling time points have been identified, a pharmaceutical company may explore multiple Test formulations simultaneously. A pilot BE study can be performed using the predetermined reduced sampling scenario strategy. The reduced sampling will drastically curtail the cost of the study by reducing the number of samples to be collected, stored and analysed. Furthermore, less samples implies a lower number of visits for the participant, thus further raising the benefits for both the subject and the generic industry (Appendix 3) (Figure 5).

Figure 5: VPC of the reference final model (Appendix 3).
Conclusion
Our study shows how pop-PK modeling approach can significantly reduce the number of samples used in a BE assessment, and thus potentially lower the costs of future BE trials. However, its standardisation in application needs to be developed. First, to obtain an acceptable pop-PK model, the design of data collection must be different than the standard BE trials that was used here. In pop-PK modeling, some specialized software packages are developed for this purpose. The approval of these modeling-oriented design of protocol is to be discussed within the BE community. Moreover, the successful model refitting for a reduced scenario is not a deterministic event, but an event of probability. This is an important feature of NONMEM modeling, since the majority of general algorithms use the linear approximation approach, which does not guarantee a successful modeling convergence. Although a slight adjustment of the parameters estimates can result in a successful convergence, this methodology has yet to be standardized.
Finally, specialized trained personnel possessing knowledge of modeling, simulation techniques and its software is also a constraint to implement this approach across the generic industry. Despite the challenges mentioned above, this work shows that the blood sampling burden in the BE testing process of highly variable drugs such as dabigatran could be reduced with the assistance of a pop-PK modeling approach. Implementing modeling and simulations in all branches of drug development, including generic testing, culminates in saved expenses and time for pharmaceutical companies, regardless of the expertise required to construct such models.
REFERENCES
- https://canadiangenerics.ca/sustainable-healthcare/market-trends/
- Center for Drug Evaluation and Research, Summary Review of New Drug Application: Pradaxa (NDA 22-512). 2010.
- Mekaj A, Mekaj Y, Duci S, Miftari E. New oral anticoagulants: their advantages and disadvantages compared with vitamin K antagonists in the prevention and treatment of patients with thromboembolic events. Ther Clin Risk Manag. 2015;11:967-977.
- https://www.fda.gov/regulatory-information/search-fda-guidance-documents/statistical-approaches-establishing-bioequivalence
- Mould DR, Upton RN. Basic concepts in population modeling, simulation, and model-based drug development-part 2: introduction to pharmacokinetic modeling methods. CPT: Pharmacometrics Syst Pharmacol. 2013;2(4):e38-e38.
- Owen JS. Introduction to population pharmacokinetic/pharmacodynamic analysis with nonlinear mixed effects models, ed. J. Fiedler-Kelly. Hoboken, New Jersey: Wiley, USA. 2014.
- Chow SC. Bioavailability and bioequivalence in drug development. Wiley interdisciplinary reviews. Comput Stat. 2014;6(4):304-312.
- Yue CS, Ozdin D, Selber-Hnatiw S, Ducharme MP. Opportunities and challenges related to the implementation of model-based bioequivalence criteria. Clin Pharmacol Therapeut. 2019;105(2):350-362.
Citation: Legault C, Li J (2020) Model-Based Elaboration of a Limited Sampling Strategy in the Bioequivalence Assessment of Highly Variable Dabigatran. J Bioequiv Availab. 12:396. doi: 10.35248/0975-0851.20.12.396
Copyright: © 2020 Legault C, et al. This is an open-access article distributed under the terms of the Creative Commons Attribution License, which permits unrestricted use, distribution, and reproduction in any medium, provided the original author and source are credited.