Indexed In
- Open J Gate
- Genamics JournalSeek
- Academic Keys
- JournalTOCs
- The Global Impact Factor (GIF)
- China National Knowledge Infrastructure (CNKI)
- Ulrich's Periodicals Directory
- RefSeek
- Hamdard University
- EBSCO A-Z
- OCLC- WorldCat
- Publons
- Geneva Foundation for Medical Education and Research
- Euro Pub
- Google Scholar
Useful Links
Share This Page
Journal Flyer

Open Access Journals
- Agri and Aquaculture
- Biochemistry
- Bioinformatics & Systems Biology
- Business & Management
- Chemistry
- Clinical Sciences
- Engineering
- Food & Nutrition
- General Science
- Genetics & Molecular Biology
- Immunology & Microbiology
- Medical Sciences
- Neuroscience & Psychology
- Nursing & Health Care
- Pharmaceutical Sciences
Research Article - (2016) Volume 7, Issue 4
High Ester Pectin Based Formulation for Site Specific Delivery of 5-Fluorouracil in to Descending Colon
Abstract
This research has investigated over different parameters and combined the additional anti-cancerous properties of high ester pectin based formulation, which exhibit almost negligible degradation by colonic bacteria. In present investigation compression coated tablets were prepared using high ester pectin derived from Mangifera indica fruit peel for colon specific delivery of 5-Fluorouracil. Pectin was extracted from dried fruit peel powder of Mangifera indica using water acidified with 0.2 M citric acid and further isolated with ethanol. For optimization of drug release in to descending colon tablets were prepared using two independent variables (concentration of pectin in compression coating and concentration of Eudragit L100 in enteric coating) at three levels. Drug releases were studied using different buffers without pectinase and with pectinase. Results showed maximum drug release into the colon can be achieved with batch F8 consisting 60% pectin concentration and 12.5% Eudragit L100 in enteric coating with less deviation with predicted response. It was also found that drug release from enteric coated tablets does not changed significantly in the presence of enzyme. Thus, combination of pharmacological activities of drug and high ester pectin along with site specificity of Eudragit L-100 has focused a new light towards the area of conventional dosage forms.
Introduction
5-fluorouracil has been used for the treatment of colorectal cancer from long time [1]. Due to irregular bioavailability, it is clinically used through intravenous route [2]. Intravenous administration of this drug causes several gastrointestinal, neural, cardiac and dermatological effects [3]. Oral delivery of this drug to the colon provides less side effects and controlled release of drug. This reduces drug dose and dosing frequency of delivery system [4]. The aim of the present research was to formulate compression coated tablet; coated with Eudragit L-100 to deliver 5-fluorouracil in to the colon region. In this study high ester pectin was extracted from mango fruit peel and used as excipient for the preparation of core tablets containing drug and again used as excipient for compression coating. Further compression coated tablet were coated with Eudragit L100 to prevent drug release in to acidic medium of gastrointestinal tract.
Studies have been proved the anti-cancerous properties of pectin. Pectin influenced colon cancer by physical dilution of colon content, absorption of bile acids and carcinogens. Fermentation product of pectin produces short chain fatty acids, lowering of pH and stimulation of bacterial growth [5-8]. Consistent with the results of in vivo experiments performed with rats low-methoxylpectins were fermented in vitro more efficiently than high-methoxylpectins were fermented [9]. Therefore, Dongowski and Lorenz concluded that low-methoxyl pectins are the preferred substrates of the pectin-depolymerizing enzymes of the human microflora [10-12].
As the concentration of colonic microflora decreases in case of cancer, resulting in slower degradation of pectin based formulation in the colon. It was also studied that high ester pectin is less susceptible to colonic bacteria, so in the research high ester pectin was used to formulate compression coated tablets to simulate colonic environment in case of cancer. Using this formulation, one can easily estimate in vivo behavior of drug release from in vitro release profile. When pectin is used in colon targeted delivery system, it forms gel layer on the gastrointestinal mucosa and further reduces adverse effect of acidic environment of gastrointestinal tract on the mucosa. This barrier effect of pectin provides synergistic effect for the treatment on colorectal cancer.
Materials and Methods
Drug 5-Fluorouracil and EudragitL 100 were procured from Sigma Aldrich Inc. Spruce Street, St. Louis USA. Sodium starch glycolate, polyvinyl pyrrolidone K30, lactose, isopropyl alcohol, triethyl citrate, magnesium stearate and ethanol were procured from central drug house, New Delhi. All materials were analytical grade and supplied as “Required No Purification before Use”.
Collection of plant material
Ripe mango peel was obtained as a waste from local market and authenticated by CSIR, Pusa Campus New Delhi. Peel was carefully washed and dried under shade for 24 h, further dried at 30-40°C until constant weight was obtained. Dried fruit peel was cut into pieces and powdered. Powdered peel was further passed through sieve 20# and stored in air tight container until used. Pectin was extracted under reflux in a condensation system using water acidified with citric acid (0.5 molar) to pH 2. Extraction was carried out for 120 min at 60ºC. The extractor thimble was a Whatman cellulose thimble with 33 mm internal diameter and 80 mm length. Accurately weighted peel powder (10 gm) was added to 1 L of acidified water. Hot acid extract was pressed in cheese cloth bag and the concentrated juice was cooled to 4°C. Pectin was precipitated by alcohol-juice treatment [ratio 2:1 v/v] followed by continuous stirring for 15 min. This mixture was further allowed to stand for 2 h to allow pectin floatation. Using this procedure, it was easier to filter these substances because pectin remains float on the surface of alcohol–water mixture. Floating pectin coagulate was filtered through cheesecloth, washed with 95% alcohol and pressed. Pressed pectin was further dried to constant weight at 35-45°C. Hard pectin cake was grounded and sieved through sieve # 20. It was stored in desiccator till further use.
Determination of purity of Pectin
Isolated pectin was characterized for the presence or absence of gums, mucilages, protein and carbohydrate [13,14].
Determination of degree of esterification
The degree of esterification of extracted pectin was determined by simple titrimetric method based on Food Chemical Codex (FCC, 1981) [15] and USP 26NF 21(2003) [16] with slight modification. For this study, 500 mg of dried pectin was taken into a 250 ml of conical flask, moistened with 2 ml of ethanol and dissolved in 100 ml of distilled water. The resulting solution was titrated with 0.5 N NaOH in presence of phenolphthalein and result was recorded as the initial titer. Further, 10 ml of 0.5 N NaOH was added, shaken vigorously, and allowed toS stand for 15 min to neutralize polygalcturonic acid after determination of free carboxyl group. Then 0.5 N HCl was added, and excess HCl was titrated with 0.5 N NaOH using phenolphthalein as indicator, this value was recorded as saponificaton titer (final titer). Degree of esterification (DE) was calculated by using equation 1.
% DE= {final titer / (initial titer + final titer)} * 100 (1)
Assay for free methoxy group
Each ml of 0.5 N NaOH used in the saponifcation titer was found to be equivalent to 15.52 mg of methoxy group (–OCH3).
Assay for galacturonic acid
Each ml of 0.5 N NaOH used in total titration (initial titer+saponification titer) in the “determination of degree of esterification” was equivalent to 97.07 mg of galacturonic acid.
Preparation of core tablet
Core tablets were prepared according to Table 1. Drug and pectin were mixed uniformly using mortar and pestle. Sodium starch glycolate, polyvinyl pyrrolidone K30 and magnesium stearate were added one by one and mixed to get uniform powder mixture. Water was used as granulating agent to produce granules of uniform size. Granules were dried at 40ºC for 4 h. Talc was added and mixed with previously obtained granules to improve flow properties.
| Ingredients | Quantity (mg) |
|---|---|
| Drug | 25 |
| Pectin | 20 |
| Sodium starch glycolate | 10 |
| Polyvinylpyrrolidone K-30 | 3 |
| Magnesium stearate | 1 |
| Talc | 1 |
Table 1: Formula for core tablets.
Equivalent to 25 mg of drug, granules were accurately weighed and tablets were prepared using 4 mm punch at 6 ton hydraulic pressure (Cadmach punching machine 27 stations).
Evaluation of core tablets
Prepared tablets were evaluated for weight variation, friability, hardness and drug content and characterized in terms of diameter and thickness.
Swelling behavior of sustained release matrix tablets
The extent of swelling was measured in terms of percentage weight gain by the tablet. Percentage weight gain by the tablet was calculated using formula (equation 2);
S.I = {(Mt - Mo) / Mo} × 100 (2)
Where, S.I=Swelling Index, Mt=Weight of tablet at time t (h) and Mo=Weight of tablet at zero time [17].
In vitro drug release study
In vitro drug release was studied using Lab India Dissolution Apparatus, with 600 ml of dissolution medium (phosphate buffer pH 7.4 and phosphate buffer pH 6.8) maintained at 37 ± 1°C for 3 h, at 50 rpm. 5ml of sample was withdrawn after specific interval, and was replaced by an equal volume of fresh dissolution medium of same pH (phosphate buffer pH 7.4 or phosphate buffer pH 6.8). Collected samples were analyzed spectrophotometrically at measured wavelength (λmax 266.5 nm) and cumulative percent drug release was calculated [18].
Study of release kinetics from core tablet
To study the kinetics of drug release from core tablets, in vitro drug release data were fitted to various release kinetic models viz. zero order, first order, Higuchi kinetics and Korsemeyer–Peppas model. The release kinetics of 5-fluorouracil from various formulations was determined by comparing their respective correlation coefficients.
Formulation of compression coated tablet
Compression coated tablets were prepared according to Table 2. Granules were prepared using water as granulating agent. In this formulation lactose was used as filler to maintain total weight of compression coated part to 500 mg. 1% talc was added to improve flow behavior of prepared granules. Tablets were punched using 12 mm die.
| Formulations | Independent variables | |
|---|---|---|
| Concentration of Pectin (X1) | Concentration of Eudragit™L100 (X2) | |
| F1 | -1 | -1 |
| F2 | 0 | -1 |
| F3 | +1 | -1 |
| F4 | -1 | 0 |
| F5 | 0 | 0 |
| F6 | +1 | 0 |
| F7 | -1 | +1 |
| F8 | 0 | +1 |
| F9 | +1 | +1 |
X1: Concentration of pectin in compression coating (%), Level: -1 (30), 0 (60), +1 (90)
X2: Concentration of Eudragit™ L100 in coating solution (%), Level: -1 (3.5), 0 (8),+1 (12.5)
Table 2: Experimental design using two independent variables with three levels.
Factorial design
A 32 randomized full factorial design was used in the present study. In this design 2 factors are evaluated, each at 3 levels, and experimental trials are performed at all 9 possible combinations. Concentration of pectin in compression coating and concentration of Eudragit™ in enteric coated were selected as two independent variables.
Enteric coating of compression coated tablets
Weighed quantity of Eudragit™ L100 was dissolved in isopropyl alcohol by keeping it on magnetic stirrer at 100 rpm, in which polymer has good solubility. After the complete solubilization of polymer, triethyl citrate (10% of solution) was added (used as the plasticizer). Coating process was done at a constant spray rate with a nozzle to bed distance of 15 cm and a drying temp of 40ºC [19,20].
Evaluation of coated tablet
Eudragit™ L100 coated tablets were evaluated for different post coating parameters. Weight variation of both compression coated tablet and Eudragit™ coated tablet were compared. Change in diameter and thickness of tablets after enteric coating were calculated with an aim to calculate % change in both parameters after coating of different concentration based on polymer solution. Effect of enteric coating on friability and hardness of tablets were also measured and compared.
Swelling or water uptake studies of enteric coated tablets
The experiment was carried out with slight modifications using dissolution test apparatus (Electrolab Dissolution Test Apparatus, India).The rate of test medium uptake by the enteric coated pectin matrix was determined by equilibrium weight gain method. Dried tablet was accurately weighed (W0), placed in the closed basket with blocked mesh (basket mesh was blocked with triple layered butter paper) underneath the tablets, rotating at 150 rpm using Electrolab Dissolution Test Apparatus, with the dissolution medium of hydrochloric acid pH 1.2 (for 2 h) and USP phosphate buffer pH 6.8 (for 4 h) and further phosphate buffer pH 7.4 (for 7 h) at 37 ± 0.5°C. After specific time interval (as described), each container was removed from the dissolution apparatus, the pre-weighted tablet was withdrawn from the medium and lightly blotted with tissue paper to remove excess test media and then reweighed (W1) on an analytical balance. The experiment was performed in triplicate for each time point. Percentage increase in weight due to absorbed liquid or water uptake was calculated at each time point using equation 3:
% weight change = (W1 - W0 / W0) * 100 (3)
Matrix erosion study of tablets
Matrix erosion studies were performed by a method similar to those of Roy and Rohera [21] with slight modification. After the swelling studies, the wet samples were then further dried in an oven at 80°C for 24 h time period, followed by placing in desiccator for drying and finally weighed until constant weight was achieved (final dry weight, W2). The experiment was performed in triplicate for each time point.
The percent tablet erosion (ES) at different times was estimated from the following equation 4:
ES = (W0 - W2) / W0 * 100 (4)
After erosion, percentage weight remaining of the tablets was calculated from the following equation 5:
% remaining = 100 - ES (5)
In vitro dissolution study of Eudragit™ coated tablets
Dissolution studies were performed using USP dissolution apparatus ? at 50 rpm and 37°C. Eudragit™ L100 coated tablet were placed in vessels containing 500 ml of pH 1.2 hydrochloric acid buffers for 2 h. Furthermore, dissolution medium was replaced by USP pH 6.8 phosphate buffer and samples were collected for further 4 h and were continued for remaining 10 h in phosphate buffer pH 7.4. At specified time intervals 5 ml sample was withdrawn and replaced with equal volume of fresh medium.
To evaluate the effect of pectinase on drug release 3 ml pectinex ULTRA SP-L was added to the dissolution vessels after 2 h study in pH 1.2 hydrochloric acid buffer as above and the test was continued for 8 h [18,22].
Factorial design
In present investigation two independent variables (concentration of pectin and concentration of enteric polymer), at three levels (-1, 0 and +1) were selected to study, the effect of these variables on drug release (dependent variables); according to Table 1. The response of experiment was measured as drug release from enteric coated matrix tablet. Reduced equation having statistical significant value for (3)2 factorial design was shown as following equation 6.
Y = b0 + b1X1 + b2X2 + b12X1X2 + b11X12 + b22X22 (6)
Where, Y is the response of variables (dependent variable), b0 arithmetic mean response of nine batches and b1 estimated coefficient for factor X1. The coefficients corresponding linear effects (b1 and b2), interaction (b12) and the quadratic effects (b11and b22) were determined from the results of the experiment. Deviation from predicted response was calculated using equation 7.
% deviation = {(predicted response - experimental response) / predicted response} * 100 (7)
Formulations were optimized on the basis of amount of drug released in stomach (USP phosphate buffer pH 1.2) and amount of drug released in colon (USP phosphate buffer pH 6.8).“minitab15” software was also used to sketch a graph between predicted response and experimental response.
Accelerated stability testing
Prepared enteric coated tablets were evaluated for their stability in controlled medium. The tablets were sealed in double aluminium foil and placed in a stability chamber (MAC® Environmental Test Chamber, CAT No: MSW -127) maintained at 40°C and 75% RH. After 15, 30, 45 and 60 days, the samples were collected and evaluated [23-26].
Results and Discussion
Results easily predict the fact that extraction method may be an important tool for the isolation of pectin from mango fruit peel. The isolated sample was further shown presence of carbohydrates. Confirmation of pectin was further done by negative test for mucilages, gums, tannins, alkaloids and proteins. Other phyto constituents were absent in the isolated powder. Powdered pectin was brown in color with rough fracture and has characteristic taste. Solubility studies of pectin showed that pectin was only soluble in water and completely insoluble in organic solvent. The pH values of 1% solution of the pectin was found to be slightly acidic, which indicated that it shall not release significant amount of drug in gastric pH, when used as excipient and is suitable candidate for intestinal targeting. Methoxy group of extracted pectin was found 32.59 mg with galactorunic acid content 320.33 mg and Degree of esterification 63.64%.
Evaluation parameters of core tablets
All tablets complied with pharmaceutical standards of weight variation, friability, hardness and drug content. Weight variation of core tablets was found 60.05 mg ± 0.51 with 0.128% ± 0.01 friability, 11.06 N ± 0.15 hardness, 4.07 mm ± 0.07 diameter, 2.3 mm ± 0.01 thickness and 25.02 mg ± 0.08 drug content. Friability and hardness are two parameters that are important in consideration for drug transportation and storage. Both of these parameters are within official limit and in accordance with industrial requirement. Drug content of formulations were found quite well with low standard deviation (0.08), easily strengthen the fact that these procedures are reproducible and can be used to formulate oral solid formulations.
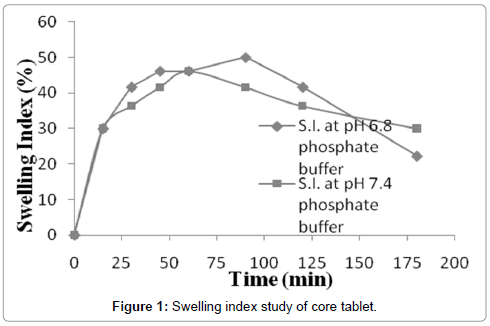
Swelling study was carried out in USP phosphate buffer pH 6.8 and 7.4. Graph was plotted in terms of percentage swelling index and time (Figure 1). It’s shown that erosion rate of pectin core tablets were more in phosphate buffer pH 7.4, so swelling index was more in case of pH 6.8. Pectin is an acidic polymer so it will be relatively more soluble in higher pH, due to this reason pectin based core tablets showed more erosion in phosphate buffer pH 7.4 as compared to 6.8. Swelling studies of core tablets were carried out in these two buffers because after removal of enteric coating core tablet comes in contact of these medium. It was also found swelling index significantly depends upon these mediums, so further release studies of tablets were carried out in these two buffers.
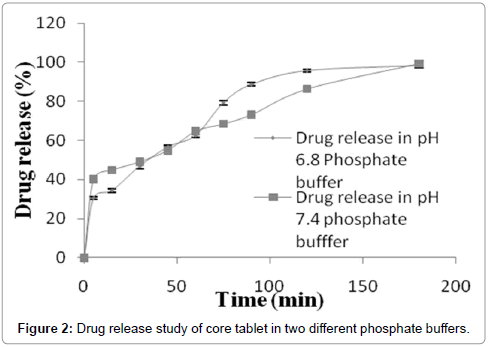
Drug release study of 5-fluorouracil core tablets were carried out in phosphate buffers pH 6.8 and 7.4. Release data was shown in the form of graph between percentage drug release and time (Figure 2). Graph showed that drug release was about same in case of both buffers. Hydration of polymer and solubility in the buffers significantly modify the release behavior. Upto 30 min relatively higher drug release was found in phosphate buffer pH 7.4 as compared to phosphate buffer pH 6.8. Same amount of drug release (about 62%) was found in both phosphate buffers between 30 min to 60 min. so drug release was not dependent on pH of the medium in this time range. After 60 min amount of drug release was found to be greater in USP phosphate buffer pH 6.8 as compared to phosphate buffer pH 7.4. It was concluded from the graph 9.2, that about 100% drug releases was achieved in the same time (180 min) when release study were performed in both medium separately.
Kinetic assessment of drug release was done according to most fit regression value (closer to 1). Regression coefficient of model fitting on drug release at phosphate buffer pH 6.8 was easily predict the fact that drug release follows first-order kinetics, so the release process involves erosion/diffusion and an alteration in the surface area and diameter of the matrix system as well as in the diffusion path length from the matrix drug load during the dissolution process. Erosion of polymer (pectin) and/or diffusion of drug from the tablet are the reason behind the drug release from core. The value of regression coefficient for both first order and Higuchi kinetics are close to each other (0.968 and 0.958 respectively). Higuchi kinetics describe that release rate is time dependent process and release of drug based on porous structure of polymeric matrix. So it reveals the fact that in pH 6.8 phosphate buffer, drug release was based on erosion/diffusion of drug from pectinsodium starch glycolate based polymeric system.
Data of drug release from core tablet in phosphate buffer pH 7.4 predict the fact that mango peel derived pectin and sodium starch glycolate forms a compact mass when used together in a formulation and drug release based on diffusion of drug from tablet via pore formed due to water solubility of pectin. Regression value (0.945) strengthens the fact as it is closest to one in case of Higuchi model fitting.
Kinetic assessment of drug release in pH 7.4 phosphate buffer easily predict the fact that drug molecules released from the matrix due to formation of internal pores in the tablet matrix, which is due to the relatively higher solubility of sodium starch glycolate.
Physical properties of enteric coated tablets
Appearance of tablets of different batches was entirely different due to their pectin content and Eudragit™ coating. Weight variation, hardness, thickness, diameter and drug content uniformity values of all tablets were found within the official limits (Table 3). Percentage weight variations of all tablets before enteric coating and after enteric coating were studied. It was found that percentage variation in weight of tablets before enteric coating were less in comparison to enteric coated tablets. This is due to the fact that enteric coating of tablets was relatively not easy to control and compression coating of tablets were not so difficult. Friability of tablets was also changed in the same manner (tablets without enteric coating were more friable as compared to enteric coated tablets). Friability of all tablets was found to be decreased after enteric coating, due to formation of smooth film on the tablet surface. Hardness of all compression coated tablets was found to be close to each other. It was also observed that after enteric coating, hardness was slightly increased. Diameter and thickness were two important parameters which were increased significantly due to variations in concentration of coating solutions. Coating solutions (3.5, 8, and 12.5%) were applied based on increased in tablet weight. It was also found that standard deviations in diameter of tablets after Eudragit™ L100 coating were found to be more than without enteric coating. This also strengthens the fact that spray coating of Eudragit™ solution is difficult, but values of standard deviation were within limit so this process provides reproducible results.
| Physical parametersformulations | Weight variation (%) | Friability(%) | Hardness(N) | Diameter(mm) | Thickness (mm) | |||||
|---|---|---|---|---|---|---|---|---|---|---|
| C* | C | C* | C | C* | C | C* | C | C* | C | |
| F1 | 0.018 | 0.038 | 0.09±.034 | 0 | 21.08±0.305 | 21.18±0.469 | 12.032±0.006 | 12.140±0.01 | 4.049±0.007 | 4.159±0.009 |
| F2 | 0.02 | 0.026 | 0.117±0.062 | 0 | 21.10±0.261 | 21.22±0.828 | 12.045±0.005 | 12.183±0.01 | 4.046±0.005 | 4.218±0.010 |
| F3 | 0.021 | 0.035 | 0.143±0.071 | 0 | 20.38±0.286 | 20.59±0.536 | 12.041±0.005 | 12.244±0.012 | 4.052±0.006 | 4.321±0.012 |
| F4 | 0.084 | 0.026 | 0.042 ± 0.091 | 0 | 20.19 ± 0.176 | 20.49 ± 0.260 |
12.038 ± 0.005 | 12.389 ± 0.012 | 4.054 ± 0.005 | 4.345 ± 0.005 |
| F5 | 0.027 | 0.097 | 0.125 ± 0.101 | 0 | 21.03 ± 0.433 | 21.36 ± 0.743 | 12.045 ± 0.006 | 12.311 ± 0.018 | 4.048 ± 0.004 | 4.358 ± 0.008 |
| F6 | 0.023 | 0.117 | 0.126 ± 0.098 | 0 | 20.53 ± 0.419 | 20.9 ± 0.510 | 12.041 ± 0.005 | 12.440 ± 0.008 | 4.05 ± 0.008 | 4.358 ± 0.009 |
| F7 | 0.023 | 0.023 | 0.165 ± 0.102 | 0 | 21.14 ± 0.508 | 21.35 ± 0.638 | 12.041 ± 0.005 | 12.622 ± 0.016 | 4.043 ± 0.008 | 4.371 ± 0.007 |
| F8 | 0.02 | 0.078 | 0.132 ± 0.094 | 0 | 21.28 ± 0.192 | 21.55 ± 0.331 | 12.047 ± 0.004 | 12.678 ± 0.01 | 4.056 ± 0.007 | 4.382 ± 0.006 |
| F9 | 0.021 | 0.188 | 0.068 ± 0.18 | 0 | 21.09 ± 0.428 | 21.47 ± 0.802 | 12.047 ± 0.004 | 12.629 ± 0.019 | 4.058 ± 0.006 | 4.633 ± 0.011 |
# Value with “±” showed standard deviation
C*, Uncoated tablet; C, Coated tablet
Table 3: Effect of Eudragit™ L100 coating on physical parameters of prepared tablets#.
Swelling and erosion study of tablets
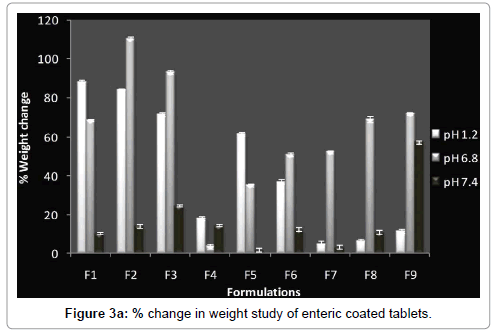
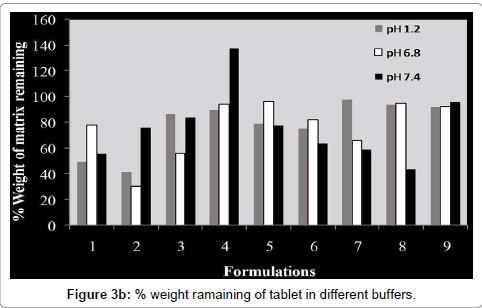
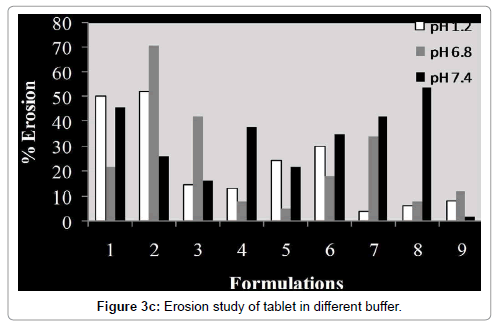
Swelling and erosion study was carried out for all batches in USP phosphate buffer pH 6.8 and 7.4. The results of these tests are provided as the percentage weight change (Figure 3a) and percentage remaining of initial tablet mass (Figure 3b).The percentage remaining of the matrices reflects the amount of polymer that is dissolved in the buffer and the erosion of tablet matrix in different media during the dissolution process (Figure 3c). Weight loss from the tablets increased progressively with the swelling time because tablet contact time with buffer increases.
The swelling behaviour is the indication of the rate at which tablet absorbed water from dissolution media and swelled. Visual observation of swelling study indicated that the matrices appeared to swell almost from the beginning and a viscous gel mass was created when they came into contact with the medium. Hydration of matrix layer results in the formation of gel structure around the tablet matrix. Up to certain limit this gel structure retards the penetration of water into the core matrix. The changes in tablet weight, characteristic of water uptake and swelling, started from the beginning of the study and continued for desired time period.
The extent of erosion in media also increased progressively, as the percentage remaining of tablet mass decreased, with the increased swelling time (Figure 3c). So matrix erosion measured the weightloss from matrix tablets immersed in dissolution media as a function of time. Amount of pectin in compression coated part controlled water penetration, modified rheological properties and gel layer integrity. Concentration of Eudragit™ L100 in enteric coating is an important factor for water penetration. As the thickness of enteric coating increases, rate of water penetration decreases in a same manner. So both concentration of pectin in compression coated part and concentration and thickness of Eudragit™ L100 in enteric coating significantly affect the water penetration and further drug release from matrix.
Release study of tablets
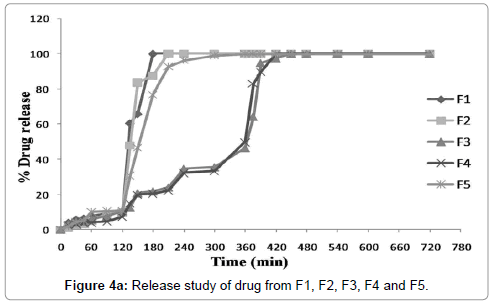
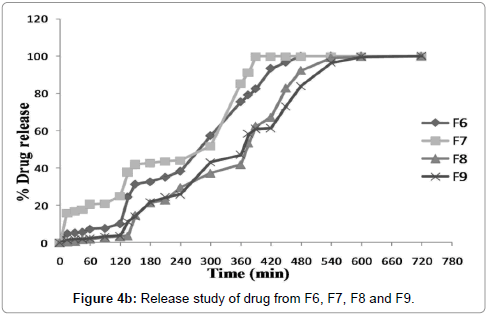
(3)2 factorial designs were used to study the effect of pectin and Eudragit™ L100 concentrations on drug release. Data illustrate the fact that both parameters significantly affect the release behavior from enteric coated tablets. Greater the pectin concentration in compression coated part and higher Eudragit™ coating level longer the lag time of 5FU release from the coated tablets. However, once the Eudragit™ layer was broken up, drug release pattern were entirely based on concentration of pectin in compression coated layer. Obtained data showed that pH of dissolution media significantly affect the release behavior of enteric coated tablets. Coating of compression coated tablets with Eudragit™ L100 prevents drug release in upper G.I.T. (stomach, pH 1.2). It was dependent on concentration of Eudragit™ in coating solution. Figures 4a and 4b easily predict the fact that as the concentration of Eudragit™ increases, drug release in stomach decreases significantly. So Eudragit coating was sufficient to prevent 5FU release in acidic pH of stomach that can degrade the drug. It was found from the obtained results that Eudragit™L100 coating at +1 level (12.5%) was sufficient to prevent drug release (batch F8 and batch F9) and less than 4% drug was released at this level. At the level of -1 (3.5%), Eudragit™ coating releases drug upto 10% (batch F1, batch F2 and batch F3). In medium level 0 (8%) of Eudragit™ coating prevent drug release more than 3.5% and less than 12.5%. It can be concluded from the findings of the results that as the coating level and thickness of coating layer increased the acid resistant property of coating layer was enhanced. Moreover, it was examined that when 3.5% concentration of Eudragit™ L100 was used it minimizes drug release upto 10% (batch F1 10.09%, batch F2 9.69% and batch F3 10.48%). Further tablets reaches to duodenum and Eudragit™ layer dissolve (Eudragit™ L100 is soluble in this pH range). After dissolution of Eudragit™ layer drug release was entirely controlled by concentration of pectin in compression coated layer. It was also observed that as concentration of pectin increases, drug releases decreases significantly. Batch F1 contain 30% pectin and subsequently releases about 100% drug within 60 min in duodenum (total 180 min), while batch F2 contain 60% pectin and drug release was found about 100% within 90 min in duodenum (total 210 min), same thing was found with highest concentration of pectin for lowest Eudragit™ coating and upto 100% drug release was found after 3 h and 50 min in intestine (total 350 min). This strengthens the fact that as the concentration of pectin increases around core tablets it controlled the drug release significantly. Kinetics of drug release also depends upon concentration of pectin as shown in Table 4. It was found that drug release follows Higuchi kinetics (porosity and tortousity) at the level of -1 (30%) and 0 (60%), while drug release follows Koresmeyer-Peppas model at highest pectin level (90%) when lowest level (3.5%) of Eudragit™ coating was chosen (formulations F1, F2 and F3). Same pattern of drug release was found with batch F4, F5 and F6. Batch F4 releases about 100% drug within 420 min of initial reading and F5 after 300 min. Batch F6 showed maximum drug release 100.01% within 480 min. Drug release pattern from batch F4 and F5 follows Koresmeyer-Peppas model (R=0.896 and R=0.909 respectively) while F6 follows zero order kinetics (R=0.926) of drug release from enteric coated tablets. It can be concluded from the findings of results that at higher concentration of Eudragit™ coating release of 5-FU retarded specifically. Batch F7 and F8 follows Koresmeyer-Peppas kinetic model for drug release and batch F9 follows zero order kinetics for drug release.
| Formulations | Release Kinetics (R2value) | |||
|---|---|---|---|---|
| Zero Order | First Order | Higuchi Model | Korsmeyer-Peppas Model | |
| F1 | 0.641 | 0.649 | 0.768 | 0.005 |
| F2 | 0.647 | 0.717 | 0.772 | 0.025 |
| F3 | 0.892 | 0.793 | 0.831 | 0.917 |
| F4 | 0.888 | 0.792 | 0.829 | 0.896 |
| F5 | 0.724 | 0.782 | 0.824 | 0.909 |
| F6 | 0.927 | 0.855 | 0.906 | 0.923 |
| F7 | 0.886 | 0.818 | 0.902 | 0.903 |
| F8 | 0.947 | 0.719 | 0.893 | 0.954 |
| F9 | 0.967 | 0.657 | 0.854 | 0.931 |
Table 4: Regression value of different models.
Kinetics of drug release from enteric coated tablets
Kinetics of drug release from enteric coated tablets were studied and shown in Table 4.
Study of drug release in presence of pectinex
Effect on drug release in the presence of pectinex were studied and shown in Figure 5.
Release study carried out in the presence of pectinex enzyme showed that presence of enzyme dose not altered the release profile of drug from the enteric coated tablets. So it can be easily predicted that degradation of high ester pectin was negligible in the presence of colonic bacteria. This fact was also supported by different literatures.
Analysis of drug in residue
Evaluation of residue remaining in the basket mesh was carried out with an aim to calculate amount of drug remaining in the mass. Results showed that “no” or negligible amount of drug was present in the residual mass. So polymer entrapment efficiency of drug was very poor.
Optimization and designs of formulations
The amount of pectin (X1) and the concentration of Eudragit™ L100 (X2) were chosen as independent variables in a 32 full factorial design. A statistical model incorporating interactive and polynomial terms was used to evaluate the responses of these two independent variables (Equation 8).
Y= B0 + B1X1 + B11 (X1 2 - 2/3) + B2X2 + B22 (X2 2 - 2/3) + B12X1X2 +…… …… (8)
Where Y is the dependent variable, B0 is the arithmetic mean response of the 9 experiments, and B1 is the estimated coefficient for the factor X1. The main effects (X1and X2) represent the average result of changing 1 factor at a time from its low to high value. The interaction terms (X1X2) show how the response changes when 2 variables (independent) are simultaneously changed. The polynomial terms (X12 and X22) are included to investigate nonlinearity. The data (dependent variable) clearly indicate that the values obtained are strongly dependent on the selected independent variables (X1 and X2).
Data assessment for optimization of formulations (drug release within 2 h)
Polynomial terms (X12 and X12 ) were used to investigate effect of non-linearity in obtained response dependent variables). Negative value of B1 (-3.15) showed that factor X1 have negative effects on drug release. As the value of this factor increases, proportionally decrease in the drug release in phosphate buffer 1.2 pH was found. Same thing was found with X2, value of factor B2 have significant effect (negative effect) on drug release. Value for B0 was found to be 10 for drug release optimization within 2 h.
Mathematically response (dependent variable) for drug release in USP phosphate buffer pH 1.2 can be shown as (equation 9):
(amount of drug released in pH 1.2) = 10 + (-3.15) X1 + 0.71 (X1 2 -2/3) + (-0.14) X2 + 0.197 (X22 - 2/3) + (-2.44) X1X2 (9)
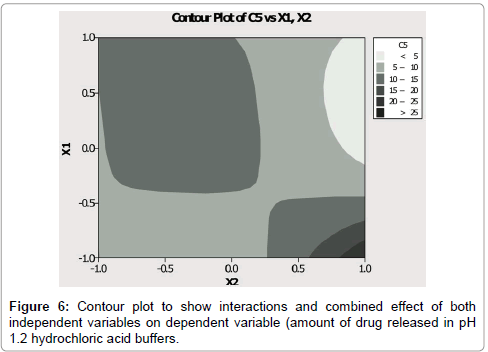
Interactions plot (Figure 6) showed interactions of two independent variables (concentration of pectin and concentration of Eudragit L100) on X axis and their effect (% amount of drug released in stomach) on Y axis. Graph easily predicts the fact that both of independent variables have significant effect on drug release.
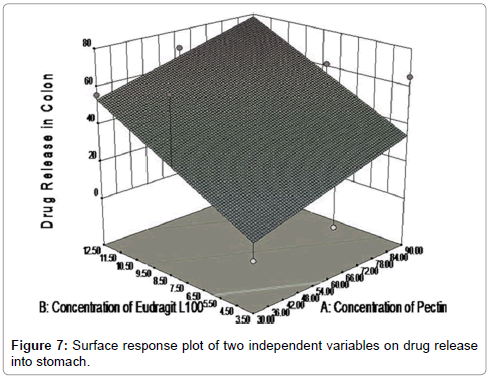
Using contour plot (Figure 6) it can be easily predicted that, what should be release behavior with specific sets of different levels for both factors? Different colors showed particular amount of drug released with particular sets of both variables. Response surface plot between dependent variables and independent variable was showed in Figure 7.
Study showed that formulations F8 and F9 have 3.04% and 3.44% drug release respectively in the acidic pH of stomach. Deviations of obtained results were found very less for both batches (batch F8 and F9) and batch F9 showed minimum deviations (0.58%) from predicted response as shown in Table 5.
| Formulations | Predicted response (Drug release in pH 1.2 phosphate buffer) | Experimental response (Drug release in pH 1.2 phosphate buffer) | Deviations (%) |
|---|---|---|---|
| F1 | 9.57 | 10.09 | 5.43 |
| F2 | 9.46 | 9.69 | 2.43 |
| F3 | 9.46 | 10.48 | 10.83 |
| F4 | 6.79 | 7.26 | 6.99 |
| F5 | 10 | 10.91 | 9.1 |
| F6 | 6.79 | 10.08 | 48.54 |
| F7 | 10.89 | 25.01 | 129.62 |
| F8 | 3.56 | 3.04 | 14.61 |
| F9 | 3.46 | 3.44 | 0.58 |
Table 5: Values of predicted and experimental responses (drug release within 2 h) with deviation.
Data for optimization of formulation (for drug release within colon)
It is important to calculate amount of drug release in colon for colon targeted drug delivery systems. Percentage amount of drug released in colon can be calculated by using equation 10:
Ac = Ac * - Ab (10)
Where, Ac=Amount of drug released in colon; Ac *=Cumulative amount of drug released in colon; Ab=Amount of drug released before entering in colon.
Formulations F8 and F9 showed maximum drug release in colon (70.31 and 72.01%). Three formulations F1, F2 and F5 releases drug less than 50% of total amount. Data showed that formulations F1 and F2 showed maximum deviations from predicted response (100%). While formulations F7, F8 and F9 showed 3.86%, 8.61% and 11.32% deviations from predicted response.
Mathematically response (dependent variable) for drug release in colon can be shown using Equation 11:
Y (amount of drug released in colon) = 44.16 + (8.59) X1 + 6.583 (X12 - 2/3) + 14.97 X2+ 0.043 (X22 - 2/3) + (-5.22) X1X2 (11)
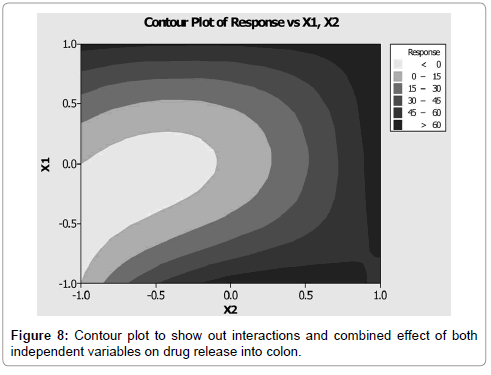
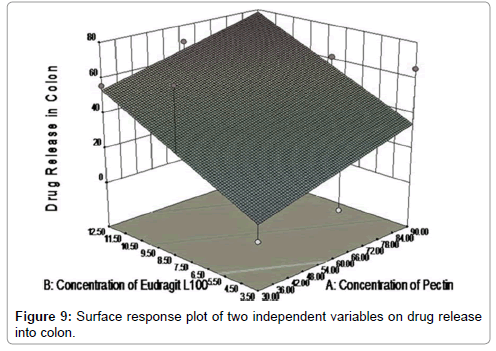
Figure 8 showed contour plot, in which the values for two variables (independent variables) are represented on the x- and y-axes, while the values for dependent variables (response) are represented by shaded regions, called contours. Counter plot showed effect of pectin concentrations and Eudragit L100 concentrations on the drug release in to colon. Different colour zone showed in the graph have specific meanings in terms of drug release. It can be easily predict using contour plot that what will be the value of responses when some other levels of two factors would use. Response surface plot between dependant variables and independent variable was showed in Figure 9 and Table 6.
| Formulations | Predicted response (% drug release in colon) | Experimental response (% drug release in colon) | Deviations (%) |
|---|---|---|---|
| F1 | 18.304 | 0 | 100 |
| F2 | 24.8 | 0 | 100 |
| F3 | 48.75 | 65.28 | 33.91 |
| F4 | 59.764 | 67.7 | 13.28 |
| F5 | 44.16 | 2.91 | 93.41 |
| F6 | 52.75 | 61.47 | 16.53 |
| F7 | 57.954 | 55.72 | 3.86 |
| F8 | 64.74 | 70.31 | 8.61 |
| F9 | 64.69 | 72.01 | 11.32 |
Table 6: Values of predicted and experimental responses (% drug release in colon) with deviation.
Stability study of fabricated tablets
Data obtained during stability study demonstrate that these tablets were stable during the period of stability study (Table 7). Drug release study was carried out and found that data does not change significantly after specific time duration. Properties of tablets did not change significantly during the study. So these types of tablets can be stored in this type of condition (temperature 40°C, relative humidity 75%). Physical appearances of tablets were also evaluated time to time and no changes were observed. Table 7 shows that no significant (P>0.05) difference occurred in the drug released, in stomach and in colon, from the formulations during the storage period of 60 days, when compared with that released from the same formulations before storage. Additionally, no changes in drug content and mechanical strength of all the tablet formulations were observed during the storage period.
| Attributes | 0 months | 30 days | 45 days | 60 days |
|---|---|---|---|---|
| BatchF1 | ||||
| Drug released in stomach (%) | 10.09 ± 0.25 | 10.13 ± 0.25 | 10.11 ± 0.25 | 10.13 ± 0.25 |
| Drug released in colon (%) | 0 | 0 | 0 | 0 |
| BatchF3 | ||||
| Drug released in stomach (%) | 10.48 ± 0.25 | 10.50 ± 0.25 | 10.49 ± 0.25 | 10.52 ± 0.25 |
| Drug released in colon (%) | 65.28 ± 0.25 | 65.31 ± 0.26 | 65.29 ± 0.26 | 65.33 ± 0.23 |
| BatchF5 | ||||
| Drug released in stomach (%) | 10.91 ± 0.25 | 10.93 ± 0.27 | 10.90 ± 0.26 | 10.94 ± 0.23 |
| Drug released in colon (%) | 2.91 ± 0.24 | 2.93 ± 0.22 | 2.94 ± 0.26 | 2.90 ± 0.24 |
| Batch F7 | ||||
| Drug released in stomach (%) | 25.01 ± 0.27 | 25.09 ± 0.26 | 25.11 ± 0.23 | 25.08 ± 0.25 |
| Drug released in colon (%) | 55.72 ± 0.27 | 55.78 ± 0.24 | 55.81 ± 0.25 | 55.76 ± 0.21 |
| Batch F9 | ||||
| Drug released in stomach (%) | 3.44 ± 0.21 | 3.45 ± 0.26 | 3.42 ± 0.23 | 3.47 ± 0.25 |
| Drug released in colon (%) | 72.01 ± 0.24 | 72.12 ± 0.21 | 72.10 ± 0.27 | 72.13 ± 0.24 |
Table 7: Stability studies of tablets after 0, 30, 45 and 60 months storage at room temperature and 60% relative humidity†.
Conclusion
From the whole investigation conclusion was drawn that highlights the combined efficiency of drug and high ester pectin in the treatment of colorectal cancer as high ester pectin are almost negligibly degraded by colonic bacteria. Moreover, when studied in presence or absence of pectinase enzyme no significant change in drug release from enteric coated tablets was found. Thus, combining the pharmacological activities of drug and high ester pectin along with site specificity of Eudragit L-100, a new era of research has evolved in the formulation of conventional dosage forms in therapy of colonic cancer.
Conflict of Interest
Authors have no conflict of interest.
References
- Hardman JG (1996) Goodman and Gilman’s the Pharmacological Basis of Therapeutics (9th edN) McGraw-Hill, New Delhi, 1225-1232.
- Hahn RG, Moertel CG, Schutt AJ, Bruckner HW (1975) A double-blind comparison of intensive course 5-flourouracil by oral vs. intravenous rou te in the treatment of colorectal carcinoma.Cancer 35: 1031-1035.
- Diasio RB, Harris BE (1989) Clinical pharmacology of 5-fluorouracil.ClinPharmacokinet 16: 215-237.
- Zambito Y, Baggiani A, Carelli V, Serafini MF, Di Colo G (2005) Matrices for site-specific controlled-delivery of 5-fluorouracil to descending colon.J Control Release 102: 669-677.
- Malviya R, Kulkarni GT, Malaviya T (2015) Extraction, characterization and optimization of high ester pectin from mango fruit (Mangiferaindica) waste using (3) factorial design. Current Nutrition and Food Science 11: 86-92.
- Silalahi J (2002) Anticancer and health protective properties of citrus fruit components.Asia Pac J ClinNutr 11: 79-84.
- Negri E, La Vecchia C, Franceschi S, D'Avanzo B, Parazzini F (1991) Vegetable and fruit consumption and cancer risk.Int J Cancer 48: 350-354.
- Austok J (199) Cancer Prevention in Primary Care: Diet and Cancer. BMJ 308: 1610-1614.
- Nyman M, Asp NG (1982) Fermentation of dietary fibre components in the rat intestinal tract.Br J Nutr 47: 357-366.
- Dongowski G, Lorenz A (1998) Unsaturated oligogalacturonic acids are generated by in vitro treatment of pectin with human faecal flora.Carbohydr Res 314: 237-244.
- Dongowski G, Lorenz A, Anger H (2000) Degradation of pectins with different degrees of esterification by Bacteroidesthetaiotaomicron isolated from human gut flora.Appl Environ Microbiol 66: 1321-1327.
- Hill MJ (1995) Bacterial fermentation of complex carbohydrate in the human colon.Eur J Cancer Prev 4: 353-358.
- Lala PK (1981) Practical Pharmacognosy, Calcutta: Lina Guha, IndiA, 135.
- Kokate CK (1991) Practical PharmacognosY (3rd edn)New Delhi, India, VallabhPrakashan.
- Food Chemical Codex (2003) National Academy of Sciences, Washington, DC. In: USP 26 NF 21, 283-286.
- The United States Pharmacopeia-The National Formulary, Unites States Pharmacopeia Convention, Rockville, MD, 1401-1402.
- Malviya R, Srivastava P, Bansal M, Sharma PK (2010) Formulation and Optimization of Sustained Release Matrix Tablets of Diclofenac Sodium Using Pectin as Release Modifier. Int J Drug Devand Res 2: 330-335.
- Ugurlu T, Turkoglu M, Gurer US, Akarsu BG (2007) Colonic delivery of compression coated nisin tablets using pectin/HPMC polymer mixture.Eur J Pharm Biopharm 67: 202-210.
- Buri P, Docler E, Gurny R, Korsmeyer RW, Peppas NA (1983) Mechanism of Solute Release from Porous Hydrophilic Polymers. Int J Pharm 15: 25-35.
- Levi M, Cevhher E, Sahin NO, Araman A (2000) Investigation on Enteric Coated Tenoxicam Tablets. ActaPharmaceuticaTurica XLII 42: 72-78.
- Sinha Roy D, Rohera BD (2002) Comparative evaluation of rate of hydration and matrix erosion of HEC and HPC and study of drug release from their matrices.Eur J Pharm Sci 16: 193-199.
- Yang L (2008) Biorelevant Dissolution testing of colon specific delivery systems activated by colonic microflora. J. Controll Release 125: 77-86.
- ICH guidelines Q1A (R2), Guidance for industry, stability testing of new drug substance and products.
- Ghosh S, Barik BB (2009) Preparation and Evaluation of aceclofenac sustained release formulation and comparison of formulated and marketed product. Int J Med MedSci 1: 375-382.
- Porwal PK (2009) Long term stability studies and shelf-life prediction of sertraline hydrochloride in 100 mg tablets. Archives of Pharmaceutical Science and Research 1: 123-126.
- Kibria G, Islam KM, Jalil RU (2009) Stability study of ambroxol hydrochloride sustained release pellets coated with acrylic polymer.Pak J Pharm Sci 22: 36-43.
Copyright: © 2015 Ayuka F, et al. This is an open-access article distributed under the terms of the Creative Commons Attribution License, which permits unrestricted use, distribution, and reproduction in any medium, provided the original author and source are credited.


