Indexed In
- Open J Gate
- Genamics JournalSeek
- Academic Keys
- JournalTOCs
- ResearchBible
- Electronic Journals Library
- RefSeek
- Hamdard University
- EBSCO A-Z
- OCLC- WorldCat
- Proquest Summons
- SWB online catalog
- Virtual Library of Biology (vifabio)
- Publons
- MIAR
- Euro Pub
- Google Scholar
Useful Links
Share This Page
Journal Flyer

Open Access Journals
- Agri and Aquaculture
- Biochemistry
- Bioinformatics & Systems Biology
- Business & Management
- Chemistry
- Clinical Sciences
- Engineering
- Food & Nutrition
- General Science
- Genetics & Molecular Biology
- Immunology & Microbiology
- Medical Sciences
- Neuroscience & Psychology
- Nursing & Health Care
- Pharmaceutical Sciences
Research Article - (2025) Volume 16, Issue 2
Genetic Diversity and Population Structure Analysis of Vernonia (Vernonia galamensis (Cass.) Less L.) Germplasm in Ethiopia using ISSR Markers
Gete Eshetua1*, Alemineh Mideksa1, Tilahun Mekonnen2 and Kassahun Tesfaye22Department of Biotechnology, Addis Ababa University, Addis Ababa, Ethiopia
Received: 12-Oct-2023, Manuscript No. JPP-23-23571; Editor assigned: 17-Oct-2023, Pre QC No. JPP-23-23571 (PQ); Reviewed: 31-Oct-2023, QC No. JPP-23-23571; Revised: 11-Jan-2025, Manuscript No. JPP-23-23571 (R); Published: 18-Jan-2025, DOI: 10.35248/2153-0645.25.16.133
Abstract
Vernonia (Vernonia galamensis (Cass.) Less.) is a new potential industrial oil crop with high content of vernolic acid in the seed oil. Ethiopia is one of the few Vernonia rich African countries. Knowledge of the genetic structure of the crop is very important for its improvement and sustainable management. The present study was targeted to investigate genetic diversity and population structure of 60 Vernonia genotypes in Ethiopia representing 8 populations using ISSR markers. A wide range of genetic diversity indices were computed to determine the extents and patterns of genetic variation within the eight populations. All the used markers were highly informative with polymorphic information content ranging from 0.5 to 0.71 with overall mean of 0.51, indicating that they are useful genetic tools for genetic structure analyses. The within-populations Nei’s gene diversity ranged from 0.28 to 0.43 with an overall mean of 0.36, indicating existence of promising genetic variation to exploit through breeding to improve desired traits. Clustering, and Principal coordinate analysis did not sharply grouped the genotypes following their geographical areas of sampling. Population structure analysis revealed the presence of two sub-populations with lower degree of genetic admixture. In conclusion, the used ISSR markers were very valuable and highly informative to determine the extent and patterns of genetic diversity and population structures of Vernonia. Among the studied populations, East Shoa and East Hararghe Vernonia populations showed relatively higher gene diversity indicating that these area could be targeted for identifying super performing Vernonia genotypes for breeding program and conservation purposes.
Keywords
Clustering; Conservation; Gene diversity; ISSR marker; Polymorphism; Vernonia galamensis
Abbreviations
AMOVA: Analysis of Molecular Variance; CTAB: Cetyl-trimethyl Ammonium Bromide; DNA: Deoxyribonucleic Acid; DNTPS; Deoxyribonucleotide Triphosphate; Fst Genetic Differentiation Among Populations; I: Shannon Information Index; ISSR: INTER Simple Sequence Repeat; Na: Number of Allele; Ne: Number of effective allele; NJ: Neighbor Joining; PCoA: Principal Coordinates Analysis; PCR: Polymerase Chain Reaction; UPGMA: Unweighted Pair Group with Arithmetic Mean
Introduction
Vernonia (Vernonia galamensis (Cass.) Less.) (2n=18) is an annual herb, about 13-500 cm tall, erect plant in the sunflower family, known for its use as an oilseed. It is often called ironweed, and it is the largest source of vernonia oil, which is rich in a useful epoxy fatty acid known as vernolic acid which is used to make plastics, rubbery coatings, and drying agents. The polymerizing characteristics and low viscosity of vernonia oil make it very important as a solvent in paints and industrial coatings replacing the traditional additives that are complained to be hazardous and less ecofriendly. The oil extract from Vernonia is useful for the production of degradable lubricants/additives, epoxy resins, insecticides or insect repellants, crop oil concentrates, and the formulation of carriers for slow release pesticides [1].
Vernonia is native to Africa, and over 300 species occurred in countries such as Ethiopia, Madagascar, Cape Verde, Eritrea, Mozambique, Kenya and northern Tanzania. Nowadays, vernonia grows across the world in North America, South America, Africa, and Southeast Asia. But, its highest diversity occurs in Ethiopia and Kenya. In Ethiopia, V. galamensis was first reported by Perdue in 1964 at 7 km Southeast of Harar town, 9°14' N and 42° 35' E. It is frequently found in Eastern and Southeastern part of the country in farmlands, in the forests, and in the compounds of mosques and churches. It grows well in areas with well-drained soil, relatively warm climate, and annual rainfall of as low as 250 mm [2].
Plant oils need chemical modification like adding epoxy group before used in the synthesis of oleochemicals such as plasticizers, adhesives, soaps, coatings, paints, lubricants and polymers. However, the chemically artificial production of epoxy group from soybean and linseed oils is considered to be expensive, accompanied by emission of volatile organic compounds, which causes secondary pollution. In this regard, natural epoxy oils extracted from plants represent economical, environmentalfriendly and renewable feedstocks that could replace petrochemicals. Vernonia galamensis is one of the major source of natural epoxy oil used for the manufacturing of Polyvinylchloride (PVC plastic), paints, adhesives, insecticides, and structural polymers [8,9]. Vernonia seeds contain up to 40% epoxy oil and this oil has up to 80% vernolic acid (cis-12, 13- epoxyoleic acid) [3].
Vernonia oil is rich in important fatty acids including vernolic acid (above 74%), linoleic acid (13.02-14.05%), oleic acid (3.77-5.28%), palmitic acid (2.48-2.98%) and stearic acid (2.26-2.75%). The oil extracted from Vernonia seed has unique physical and chemical properties that will permit its use in the formulation of reactive diluents, products to serve as solvents that become part of the dry paint surface and do not evaporate to pollute the air. These days, due to the high oil and vernolic acid content and its relatively low shattering nature, var. ethiopica has been the focus of research and at present its production in some parts of the world reaches semi-commercial scale. Some Vernonia species like V. amygdalina (Bitterleaf) are also useful as traditional herbal medicine to treat fevers, diarrhea, malaria, hepatitis, regular coughs, scabies, stomachaches, headaches, and gastrointestinal problems. Moreover, Veronial leaves also serve as good source of food in western Africa particularly in Nigeria and Cameroon [4].
In spite of its potential economic significances, V. galamensis is a research neglected crop, and limited information is available in Ethiopia. The potential of Vernonia species in Ethiopia has not been well studied. It is only considered as a wild weed and colonizing disturbed areas with bare agricultural lands. Even its production and management system is restricted; its potential value for industries has been underutilized and under exploited. Limited attempts to study the naturally existing variability in Ethiopian V. galamensis have been made since 1990. Angelini et al. and Thompson et al. reported Vernonia seed yields of up to 4,000 kg/ha and an oil content of 40% in unimproved local materials, which was higher than found elsewhere. Lack of improved genotypes, limited awareness about the significance of the crop, biotic and abiotic factors are the major factors affecting the production and productivity of the crop.
Genetic variability offers opportunity for breeders to develop new and improved cultivars with desirable characteristics, including both farmer-preferred traits (large seed and yield potential, etc.) and breeders preferred traits such as pest and disease resistance and photosensitivity. In this regard, Baye and Becker confirmed existence of considerable genetic variability among Ethiopian vernonia accessions collected from various parts of the country. The studied accession showed significant differences in terms of maturity time, plant structure, flower color, and branching patterns as well as fatty acid composition. The vernolic acid content of the seed oil of the accessions ranged from 34-87% with overall mean of 74%, indicating presence of promising possibility to improve the seed oil composition by exploiting the available genetic variations through breeding. Assessing the extent and patterns of genetic diversity of crops is a preliminary and most important step for its improvement and conservation [5].
Studying genetic variability is vital in plant genetic resource management programs as the information it provides make possible to identify genotypes of interest and use them in the establishment of effective conservation strategies. Various approaches such as morphological, protein and DNA markers are sued to explore the extent and patterns of genetic variation between individuals in a population or between populations in a species. However, morphological markers such as seed shape, colour, length, tast etc. are considered to be less powerful to explain the true genetic variability in populations. Moreover, protein markers are highly environmental influenced, developmental stage dependent and tissue specific, and hence, provide limited insight into the actual genetic diversity among study population. In this regard, DNA marker systems, which were introduced to genetic analysis in the 1980’s, have many advantages over the traditional morphological and protein markers based genetic and ecological analyses of plant populations. So far, various DNA marker systems such as Restriction Fragment Length Polymorphism (RFLP), Random Amplified Polymorphic DNA (RAPD), Amplified Fragment Length Polymorphism (AFLP), microsatellite, Diversity Arrays Technology, (DArT), Inter Simple Sequence Repeats (ISSR), Simple sequence repeats, and Single Nucleotide Polymorphism (SNP) have been used to investigate the extent and patters of genetic diversity various crops. ISSRs are found to be useful to elucidate the genetic diversity and population structure of various crops.
However, in Ethiopia, information on the extent and patterns of genetic diversity and population structure of V. galamensis to generate useful information for its improvement and sustainable conservation is greatly limited. Moreover, information on the production and utilization is greatly missing. Therefore, the present study was targeted to investigate genetic diversity and population structure of 60 Vernonia genotypes in Ethiopia representing 8 populations using ISSR markers to generate baseline information for its sustainable utilization, conservation and breeding program [6].
Materials and Methods
Plant materials and sampling strategy
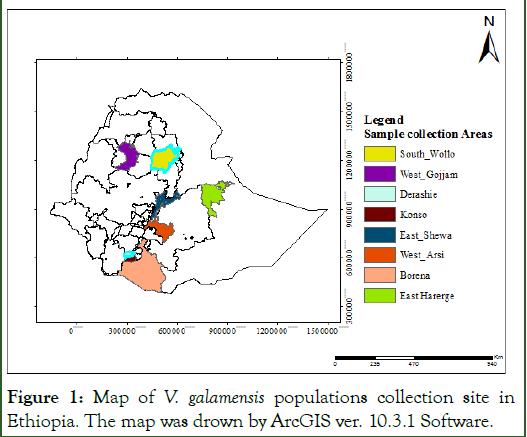
The study involved a total of 60 V. galamensis germplasm representing eight populations (Table 1) that were collected from major growing regions of Ethiopia (Appendix 1). Seed of the study material were mainly collected from Oromia, Amhara and, Southern Nations, Nationalities and Peoples Regional State (Figure 1, Appendix 1). The study area map was constructed using geographic coordinates and elevation data recorded for each sample site using the Global Positioning System (GPS). For use in genomic DNA extraction, healthy young leaves were collected from six weeks old seedlings that were grown at Adama Science and Technology University (ASTU), Ethiopia. The collected leaf samples were dried with silica gel in zip locked plastic bag, dried on benches at room temperature and then transported to Addis Ababa university, institute of biotechnology for DNA extraction and genotyping [7].
| No. | Populations | Region | No. of genotypes | |
|---|---|---|---|---|
| 1 | Borena | Oromia | 8 | |
| 2 | Derashie | SNNPs | 7 | |
| 3 | East Shoa | Oromia | 7 | |
| 4 | East Hararghe | Oromia | 8 | |
| 5 | Konso | SNNPs | 7 | |
| 6 | South Wollo | Amhara | 8 | |
| 7 | West Arsi | Oromia | 7 | |
| 8 | West Gojjam | Amhara | 8 | |
| Total | 60 | |||
| Note: SNNPs: Southern Nations, Nationalities and Peoples Regional State. | ||||
Table 1: The eight V. galamensis populations used for molecular diversity analysis.
Figure 1: Map of V. galamensis populations collection site in Ethiopia. The map was drown by ArcGIS ver. 10.3.1 Software.
Genomic DNA extraction
Genomic DNA extraction was conducted using CTAB protocol with some modifications. The extracted DNA quality was determined by loading 5 µl of DNA and 2 µl of 6x loading dye with gel red on 1% agarose gel at 100 V for 40 minutes. The DNA quantity was confirmed using Nano Drop (NanoDrop™) spectrophotometer (ND-2000, Termo Scientific™ USA). Then, the final concentration of each genomic DNA samples was adjusted to 100 ng/µL-1 and stored at -20°C until use for genotyping [8].
Genotyping
A total of thirteen ISSR primers were screened (Table 2) for their polymorphism and reproducibility on eight randomly selected samples. The primers annealing temperatures were gradient optimized. Among 13 screened ISSR primers, eight were found to be polymorphic and reproducible, and hence, used for genetic diversity analysis of the 60 Vernonia samples. The Polymerase Chain Reaction (PCR) was conducted using Biometra 2003 Thermo cycler machine in 20 µL-1 final reaction volume containing 2 µL-1 template DNA (100 ng µL-1), 11.7 µL-1 dd H20 (ultra-pure), 0.5 µL-1 dNTPS, 2.5 µL-1 PCR buffer (10x), 2.5 µL-1 MgCl2 (25 mM), 0.5 µL-1 primer (20 pmol/µl), and 0.3 µL-1 Taq polymerase. The PCR program involved an initial denaturation at 94°C for 4 minutes followed by 40 cycles of 1 minute denaturation at 94°C, primers annealing at 45/48°C (depending on the primers) for 30 s and primer extension at 72°C for 1 minute 30 s, and final extension at 72°C for 7 minutes followed with holding temperature at 4°C. The PCR product was stored at 4°C until loaded on the gel for electrophoresis. The products were fractionated in 2% agarose gel using 1 X TBE buffer at 100 V for 2 hrs.
The gel was stained in Etidium bromide (2 µl), visualized under UV light and subsequently photographed using a BIO-RAD Gel Doc TM EZ Imaging System. A 100 bp size marker was used to estimate the size of the amplified products [9].
| Primers code | Sequence (5' - 3’) | Amplification quantity | Repeat Motifs | Ta | Remark | |
| UBC-812 | (GA) 8A | Reproducible and polymorphic | di- | 450C | Selected | |
| UBC-818 | (CA) 8G | Reproducible and polymorphic | di- | 480C | Selected | |
| UBC-835 | (AG) 8 CC | Reproducible and polymorphic | di- | 480C | Selected | |
| UBC-841 | (GA) 8 TC | Reproducible and polymorphic | di- | 480C | Selected | |
| UBC-844 | (CT) 8 GC | Reproducible and polymorphic | di- | 480C | Selected | |
| UBC-845 | (CT) 8 GG | Reproducible and polymorphic | di- | 480C | Selected | |
| UBC-848 | (CA) 8 AG | Reproducible and polymorphic | di- | 480C | Selected | |
| UBC-881 | (GGGTG)3 | Reproducible and polymorphic | penta- | 480C | Selected | |
| UBC-826 | (AC) 8 CC | No banding | di- | 450C | Not selected | |
| UBC-814 | (CT) TA | No banding | di- | 480C | Not selected | |
| UBC-809 | (AG) GG | No banding | di- | 500C | Not selected | |
| UBC-824 | (TC) G | No Banding | di- | 500C | Not selected | |
| UBC-860 | (TG) GA | No banding | di- | 450C | Not selected | |
| Total | 13 | Selected | 8 | |||
| Note: Ta=annealing temperature in degree Celsius | ||||||
Table 2: List of the 13 primers sequence, amplification pattern, repeat motifs and annealing temperature used for optimization and screening.
Data scoring and analysis
The sizes of all PCR-amplified ISSR regions were estimated in relation to the 100 bp size marker. Each ISSR band was treated as a unit character and clear bands were recorded manually after taking gel image with gel documentation system and scored as binary data; '1' for band present, '0' for band absent, and '?' for missing data. The resulted binary data matrix was subjected to different molecular software to execute the various genetic diversity parameters. Number of Alleles (Na), number of effective alleles (Ne), Shannon's information index (I) gene diversity (h), genetic identity and Genetic Distance (GD), Analysis of Molecular Variance (AMOVA), Percentage of Polymorphic Loci (PPL) and Principal Coordinate Analysis (PCoA) were calculated using GenAlex version 6.5 software. Locus based diversity indices including Major Allele Frequency (MAF) and Polymorphic Information Contents (PIC) were analyzed using power marker version 3.25 software. Population differentiation (Fst) and gene flow (Nm) were determined using POPGENE version 1.32.
A genetic dissimilarity matrix was computed based on the continuous Euclidian dissimilarity index and Neighbor-Joining (NJ) and Nei's standard genetic distance (DST, corrected) based Unweighted Pair Group Method with Arithmetic Mean (UPGMA) trees were generated using DARwin ver. 6.0.14 and PowerMarker v3.25 respectively; based on 1000 bootstrap replications. Population structure and admixture patterns were determined using the admixture model based on the Bayesian algorithm implemented in STRUCTURE software version 2.3.3. The admixture model with correlated allele frequencies was used, assuming that the genome of each individual resulted from the mixture of K ancestral populations. To estimate the true number of population cluster (K), a burn-in period of 30,000 was used in each run, and data were collected over 50,000 Markov Chain Monte Carlo (MCMC) replications for K=1 to K=8 using 20 iterations for each K. The optimum K value was predicted following the simulation method of Evanno et al. using the web-based structure harvester version 0.6.92. A bar plot for the optimum K was determined using Clumpak beta version [10].
Results
ISSR primers variation and level of polymorphism
In this study, eight polymorphic markers (seven di-, and one penta-nucleotide repeats) were used for molecular profiling of the 60 V. galamensis genotypes. Accordingly, the eight ISSR primers generated a total of 83 clear and scorable bands with an average of 10.4 bands per marker (Figure 2). Table 3 presentssummary of genetic diversity indices for the 8 ISSR loci across populations. The highest number of bands was recorded for the ISSR primer UBC-881 while the lowest number of bands was generated by primer UBC-845 (Table 2). The effective number of alleles per marker ranged from 3.41 (UBC-881) to 7.22 (UBC-841) with an average of 5.6 per locus. The highest Major Allele Frequency (MAF=0.57) was recorded for the primer UBC-881, while the lowest (0.20) was obtained for the primer UBC-848 with the overall mean of 0.35. The PIC values ranged from 0.50 (UBC-835) to 0.71 for the marker 881, with an overall mean value of 0.51. The locus Nei’s gene diversity (h) across populations ranged from 0.27 (UBC-812 and UBC-818) to 0.63 for the marker UBC-881 with an overall mean of 0.39 per locus. The locus Shannon information index ranged from 0.24 (UBC-812) to 0.61 (UBC-881) with an average of 0.40. The lowest genetic differentiation (Fst=0.04) and the highest gene flow (Nm=3.71) were scored for primer UBC-835. Conversely, the highest genetic differentiation (Fst=0.27) and the lowest gene flow (Nm=0.98) were recorded for the primer UBC-848. The locus based analyze confirmed existence of significant deviation from Hardy Weinberg equilibrium [11].
| Primer Code | Na | Ne | MAF | h | I | PIC | Fst | Nm | p-value | PHWE |
|---|---|---|---|---|---|---|---|---|---|---|
| UBC-812 | 9 | 4.81 | 0.24 | 0.27 | 0.24 | 0.56 | 0.18 | 2.66 | <0.001 | <0.001 |
| UBC-818 | 12 | 5.77 | 0.21 | 0.27 | 0.43 | 0.59 | 0.15 | 1.97 | <0.01 | <0.001 |
| UBC-835 | 10 | 6.8 | 0.45 | 0.42 | 0.33 | 0.5 | 0.04 | 3.71 | <0.01 | <0.001 |
| UBC-841 | 11 | 7.04 | 0.53 | 0.37 | 0.54 | 0.53 | 0.11 | 1.53 | <0.001 | <0.001 |
| UBC-844 | 11 | 4.63 | 0.33 | 0.31 | 0.44 | 0.51 | 0.24 | 2.09 | <0.01 | <0.001 |
| UBC-845 | 8 | 5.34 | 0.24 | 0.44 | 0.3 | 0.51 | 0.18 | 1.45 | <0.001 | <0.001 |
| UBC-848 | 9 | 7.22 | 0.2 | 0.5 | 0.34 | 0.65 | 0.27 | 0.98 | <0.01 | <0.001 |
| UBC-881 | 13 | 3.41 | 0.57 | 0.63 | 0.61 | 0.71 | 0.09 | 1.07 | <0.01 | <0.001 |
| Mean | 10.4 | 5.6 | 0.35 | 0.39 | 0.4 | 0.51 | 0.16 | 1.93 | ||
| Note: Na: Number of allele; Ne: Number of effective allele; MAF: Major Allelic Frequency; h: gene diversity; I: Shannon information index; Nm: Estimate of the number of migrants (gene flow) from Fst where Nm=((1/Fst)-1)/4, Fst=inbreeding coefficient within subpopulations relative to total, PIC: Polymorphic Information Content; P-value and PHWE for deviation from Hardy Weinberg equilibrium=highly significant at (p<0.001), highly significant at (p<0.01) and significant at (p<0.05). | ||||||||||
Table 3: Summary of genetic diversity indices for the 8 ISSR loci across the sixty V. galamensis germplasm in Ethiopia.
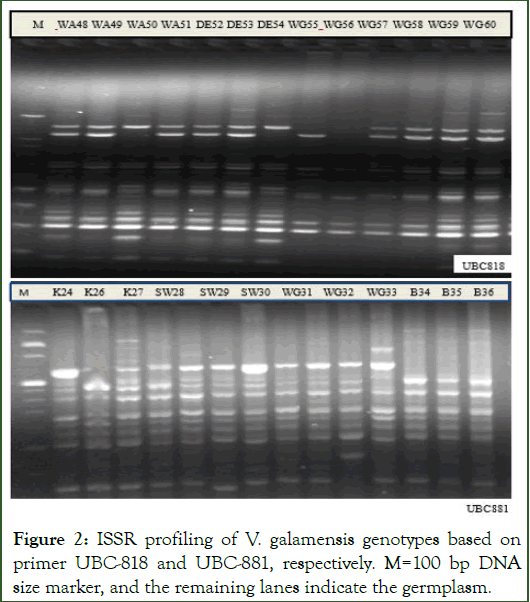
Figure 2: ISSR profiling of V. galamensis genotypes based on primer UBC-818 and UBC-881, respectively. M=100 bp DNA size marker, and the remaining lanes indicate the germplasm.
Genetic diversity within and among the populations
Table 4 presents a summary of the different genetic diversity estimates over all the loci across each populations. The overall diversity estimates within the populations revealed an effective number of alleles, Shannon’s Information index and gene diversity value ranging from 1.30-1.50, 0.28-0.43, and 0.19-0.29, with overall mean of 1.41, 0.36 and 0.24, respectively (Table 4). Among the eight V. galamensis populations, East Shoa population exhibited relatively the highest gene diversity (h=0.29) and Shannon diversity index (I=0.43), followed by the population of East Hararghe that resulted gene diversity value of 0.28 and Shannon’s Information index of 0.41 (Table 4). Nei’s unbiased measure of genetic diversity (Uh) ranged from 0.22 (South Wollo) to 0.34 (East Shoa) with an overall mean of 0.28. The within populations percentage of polymorphic loci across all loci ranged from 50.60 (South Wollo) to 75.90 (East Shoa) with overall mean value of 64.01% [12].
| Population | N | Na | Ne | I | H | Uh | PPL |
|
Rena |
8 |
1.31 |
1.35 |
0.31 |
0.21 |
0.24 |
56.63 |
|
East Shoa |
7 |
1.6 |
1.5 |
0.43 |
0.29 |
0.34 |
75.9 |
|
East Hararghe |
8 |
1.57 |
1.48 |
0.41 |
0.28 |
0.32 |
73.49 |
|
Konso |
7 |
1.3 |
1.45 |
0.4 |
0.26 |
0.3 |
71.08 |
|
Derashie |
7 |
1.39 |
1.38 |
0.33 |
0.23 |
0.26 |
60.24 |
|
South Wollo |
8 |
1.22 |
1.33 |
0.28 |
0.19 |
0.22 |
50.6 |
|
West Arsi |
7 |
1.3 |
1.3 |
0.29 |
0.2 |
0.22 |
53.01 |
|
West Gojjam |
8 |
1.53 |
1.45 |
0.39 |
0.25 |
0.3 |
71.08 |
|
Average |
7.5 |
1.4 |
1.41 |
0.36 |
0.24 |
0.28 |
64.01 |
Table 4: Summary of allelic patterns and diversity indices within populations across the eight ISSR loci.
Genetic relationships among the V. galamensis populations
To analyze the relationship between individuals or populations, we used genetic distance measures, which calculate the "distance" between samples based on their genetic profiles. Table 5 presents a summary of pairwise population measures of Nei's genetic distance (below diagonal) and gene flow (Nm) (above diagonal). The pairwise Nei’s standard genetic distance of each population from the other populations ranged from 0.10 to 0.49. The largest (h=0.49) pairwise genetic distance with relatively lowest gene flow of 0.29 was observed between the populations of West Arsi and West Gojam, and hence, they were the most distantly related populations. While, populations of Borena and Konso were the most closely related once. These populations showed a statistically significant (p<0.05) highest genetic differentiation (0.91). The second highest genetic distance (0.43) with a gene flow value of 0.31 was observed between the populations of Derashe and West Gojam. Conversely, smallest pairwise distance (0.10) with highest gene flow (Nm=0.57) was recorded between the populations of Borana and Konso populations [13].
|
|
BOR |
KON |
DER |
WA |
ESH |
EHG |
SW |
WG |
|---|---|---|---|---|---|---|---|---|
|
BOR |
**** |
0.57 |
0.38 |
0.33 |
0.47 |
0.3 |
0.36 |
0.43 |
|
KON |
0.1 |
**** |
0.51 |
0.35 |
0.39 |
0.5 |
0.43 |
0.41 |
|
DER |
0.23 |
0.22 |
**** |
0.38 |
0.42 |
0.37 |
0. 53 |
0.31 |
|
WA |
0.25 |
0.22 |
0.19 |
**** |
0.44 |
0.46 |
0.36 |
0.29 |
|
ESH |
0.37 |
0.38 |
0.33 |
0.29 |
**** |
0.34 |
0.52 |
0.44 |
|
EHG |
0.39 |
0.32 |
0.29 |
0.35 |
0.18 |
**** |
0.54 |
0.46 |
|
SW |
0.31 |
0.33 |
0.37 |
0.35 |
0.31 |
0.19 |
**** |
0.35 |
|
WG |
0.29 |
0.24 |
0.43 |
0.49 |
0.36 |
0.29 |
0.13 |
* *** |
|
Note: BOR: Borena; ESH: East Shoa; WA: West Arsi; EHG: East Hararghe; WG: West Gojjam; SW: South Wollo; KON: Konso; DER: Derashie |
||||||||
Table 5: Pairwise population matrix of Nei’s genetic distance (below diagonal) and gene flow (Nm) values (above diagonal) among eight V. galamensis populations.
Analysis of Molecular Variance (AMOVA)
Analysis of Molecular Variance (AMOVA) revealed presence of statistically significant (p=0.001) and higher genetic differentiation (Fst=0.16) with high gene flow (Nm=1.9). The analysis revealed that most (65%) of the total genetic variation (17.82) resides within populations leaving only 35% for the among populations genetic variation (Table 6).
| Source of variation | Df | SS | MS | Est. Var. | % Variation | F- Statistics | P-value | |
| Among pops | 7 | 407.84 | 58.26 | 6.23 | 0.35% | 0.16 | 0.001 | |
| Within pops | 52 | 602.96 | 11.6 | 0.6 | 0.65% | |||
| Total | 59 | 1010.8 | 17.82 | 100% | ||||
| Nm | 1.93 | |||||||
| Note: Df: Degrees of freedom; SS: Sum of Squares; MS: Mean Square; Est. Var.: Estimated Variability; Nm: gene flow. | ||||||||
Table 6: Analysis of Molecular Variance (AMOVA) showing distribution of genetic variation within and among populations of 60 V. galamensis genotypes using eight ISSR markers.
Cluster analysis, PCoA and population structure
The neighbor-joining-cluster analysis grouped the 60 individuals into three main clusters (Cluster C1, C2 and C3) (Figure 3). The first cluster (C1) consisted of 15 (25%) genotypes, and most of the samples were from West Arsi and West Gojjam. The second cluster (C2) consisted of 33 (55%) genotypes. The group composed of individuals collected from Konso, Derashie and South Wollo. The third cluster (C3) consisted of the smallest (12 or 20%) number of genotypes, and it contains individuals collected from Borena and East Shoa. The clustering analysis confirmed the presence of intermixing of the individuals of the various populations except the Vernonia populations from Borena and West Gojjam populations which formed their own groups without any intermixing with other populations at the sub-cluster levels. Some of the individual accessions collected from the same region tend to spread all over the tree without forming their own group, likely due to the presence of considerable gene flow among population (Nm=1.93).
UPGMA analysis based on the eight populations of V. galamensis revealed the presence of two major clusters (Cluster I and II). The first major cluster consisted of the Vernonia populations of East Shoa, East Hararghe, Borena and Konso, while the second clusters contained the populations of Derashie, South Wollo, West Arsi and West Gojjam (Figure 4). The analysis revealed existence of low to moderate population clustering following their geographical areas of collection.
Principal coordinate analysis (PCoA) is a technique commonly used in multivariate statistics to visualize the pattern of genetic structure and determines the amounts of variance explained per component and cumulatively. The Principal Coordinate Analysis (PCoA) conducted using the 60 V. galamensis samples roughly grouped the populations into four groups (Figure 5). None of the clusters composed of exclusively individual of a single population. The first three principal coordinates accounted for 35.24% of the total variation; with each of the dimensions (1, 2 and 3) contributing about 14.42%, 12.78% and 8.04%, respectively. The analysis revealed that the Vernonia genotypes did not cluster following their geographic areas of clustering, indicating the presence of intermixing due to thigh gene flow [14].
The Bayesian model-based population structure of the 60 V. galamensis was inferred using structure software version 2.3.4, and the K value was used to estimate the number of clusters of the accessions. The output of the Structure Harvester revealed that the delta K (ΔK) values reached a sharp peak at K=2 (Figure 5A), confirming that the studied V. galamensis genotypes can be clustered into two sub-populations. Based on this value, Clumpak result (bar plot) detected high level of genetic admixture and hence, there was low to moderate degree of geographic origin-based structuring of populations (Figure 6).
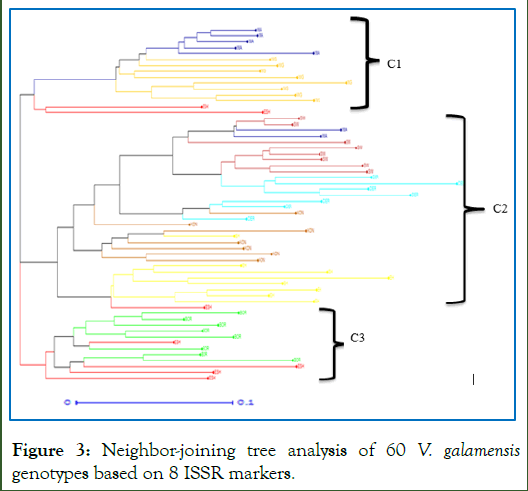
Figure 3: Neighbor-joining tree analysis of 60 V. galamensis genotypes based on 8 ISSR markers.
Note: BOR: Borena (green); EH: East Hararghe (yellow); ESH: East Shoa (red); DER: Derashie (Aqua); KON: Konso (Dark red); SW: South Wollo (deep red); WA: West Arsi (blue); WG: West Gojjam (orange).
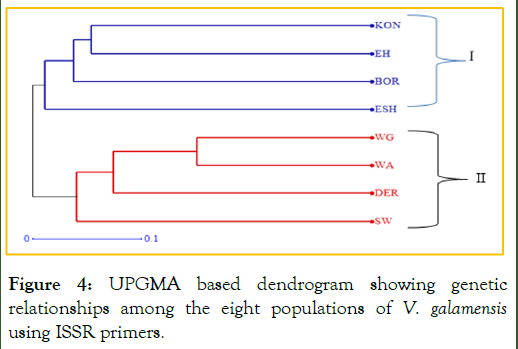
Figure 4: UPGMA based dendrogram showing genetic relationships among the eight populations of V. galamensis using ISSR primers.
Note: ESH: East Shoa; EH: East Hararghe; BOR: Borena; KON: Konso; SW: South Wollo; DER: Derashie; WA: West Arsi; WG: West Gojjam.
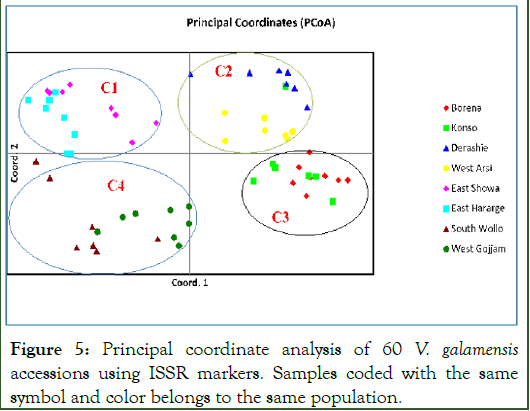
Figure 5: Principal coordinate analysis of 60 V. galamensis accessions using ISSR markers. Samples coded with the same symbol and color belongs to the same population.
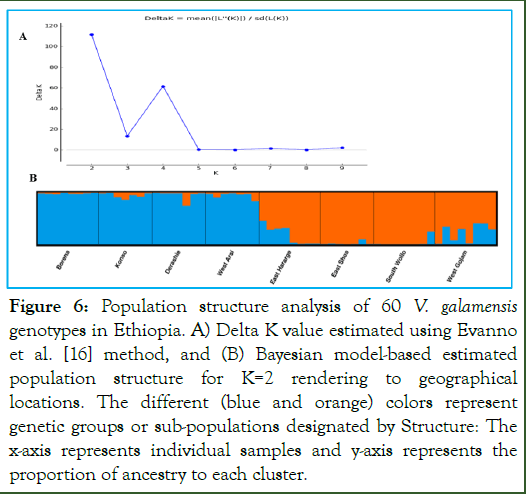
Figure 6: Population structure analysis of 60 V. galamensis genotypes in Ethiopia. A) Delta K value estimated using Evanno et al. [16] method, and (B) Bayesian model-based estimated population structure for K=2 rendering to geographical locations. The different (blue and orange) colors represent genetic groups or sub-populations designated by Structure: The x-axis represents individual samples and y-axis represents the proportion of ancestry to each cluster.
Discussion
The presence of genetic variation in plant populations is useful for conservation and breeding programs. It offers opportunity for crop researchers to develop new improved varieties with desirable traits, which accommodates both farmers and breeders preferred traits. The present study reports the genetic structure of 60 Vernonia genotypes collected from various regions of Ethiopia representing eight populations using nine ISSR marker. To the best of our knowledge, this study is the first in its kind to use ISSR markers to document the genetic structure of such industrial important crop [15,16].
Polymorphism level of the microsatellite markers
In the present study, eight ISSR markers amplified a total of 83 alleles, indicating that ISSR DNA fnger-printing technique was successful for unfolding the genetic diversity among individuals and populations of vernonia. The number of alleles per locus ranged from eight for primer UBC-845 to thirteen for primer UBC-881 with a mean value of 10.4 alleles per locus. The result is higher than the report of Aikpokpodion et al. who observed a total of 29 alleles with a mean of 5.8 per locus using 5 RAPD markers for Vernonia amygdalina. The high observed number of allele in the present study indicates that Ethiopian Vernonia genotypes are highly diverse, and hence, they are potential source of valuable alleles for use in Vernonia traits improvement. The considerable variations could be due to the difference in marker types, number of genotypes used and reproducibility of the markers. However, the total and average number of bands per locus observed in the present study was considerably lower than the level reported by Hailu et al. who observed a total of 109 bands with overall mean of 12.11 bands per primer for korarima Aframomum corrorima (Braun) accession of Ethiopia using nine ISSR markers. The variation could be due to difference in genotype and also sample size. They reported the highest scorable bands for the UBC-841, while the lowest bands for the ISSR markers UBC-822 and UBC-826 [17].
The locus based gene diversity (h) and Shannon’s information index (I) across populations of the ISSR markers used in this study ranged from 0.27-0.63 and 0.24-0.61 with overall mean of 0.39 and 0.40, respectively which are considerably lower than the level reported by Nwakanma et al. (0.76) for 50 vernonia species in Nigeria using RAPD Markers, likely due to genotype and marker difference. The PIC of the loci ranged from 0.50-0.71 with overall mean of 0.51, indicating that all the used ISSR markers were highly informative and useful genetic tools to dissect the genetic diversity and population structure analysis of Vernonia populations. Marker with PIC values below (0.25) are considered to be informative, moderately informative with PIC values between 0.25 and 0.5, and highly informative when PIC is >0.5. The same authors also reported that the maximal PIC value for dominant markers is 0.5. The average PIC observed in the present study is greater than 0.50, and hence, considered to be highly informative genetic marker to profile the genetic structure of the crop.
The level of polymorphism observed across all 8 primers used is approving the genetic variation within V. galamensis collection. Shannon diversity index value observed in the present study was lower than the level reported by Nwakanma et al. (0.76) for 50 vernonia species in Nigeria using RAPD Markers, likely due to genotype and marker difference. The average percent of polymorphism per population in the present study (64%) was considerably higher than the level (40%) reported by Ramalema et al. This implies that Ethiopian V. galamensis populations exhibit higher genetic diversity. The values of Nei’s genec diversity (H=0.24) obtained in the present study was also in line with the level reported for native plants of Ethiopia such as enset (H=0.27), tef (H=0.27) and sorghum (h=0.21) using ISSR markers in the previous studies [18].
Population genetic diversity
The success of a crop improvement program highly depends on the availability and knowledge of the genetic resources in a germplasm collection. Since areas of high genetic diversity mostly contribute more accessions than those of low diversity for further and future collection, breeding and conservation activities should be based in areas with high genetic diversity. The eight populations showed relatively high average number of observed alleles, number of effective alleles, Shannon's information index (0.36), Nei's gene diversity and percentage of polymorphic loci (64.01%), indicating the presence of promising genetic variability in the vernonia populations to be exploited through breeding to improve its production and productivity. Among the eight Vernonia populations, Vernonia populations collected from East Shoa sowed the highest gene diversity followed by the populations of East Hararghe, indicating that these areas are hot spots for Vernonia gene diversity, and hence, potential source of breeding relevant alleles in Vernonia breeding program and also for its in-situ conservation purposes. Therefore, relatively these population should be the main focus for future follow up of collection and population conservation as compared to areas which possess lowest genetic diversity estimates. On the other hand the low gene diversity (H=0.19) in vernonia populations of South Wollo might be explained due to single or few seed sources during its introduction to this area. Nei’s unbiased measure of genetic diversity (Uh) ranged from 0.22 (South Wollo) to 0.34 (East Shoa) with an overall mean of 0.28 (Table 4). The percentage of polymorphic loci of the populations ranged from 50.60 (South Wollo) to 75.90 (East Shoa) with overall mean value of 64.01% [19].
Population genetic structure and gene flow
Breeding systems of plants greatly affect genetic differentiation, and selfng can result in low genetic diversity within populations. In the present study, high and statistically significant Fst (p<0.001, Fst=0.16) was observed, indicating presence of high genetic differentiation among populations of the self-pollinating V. galamensis. The observed higher genetic differentiations could due to gene flow and also genetic drift resulted from small population size. AMOVA revealed that V. galamensis has high genetic differentiation (Fst=0.16) with relatively low (37%) among populations genetic variation which accounted for 37% of the total genetic variation. The observed high (63%) within population genetic variation could be due to high sexulal recombination within population, and spontaneous mutations. Like the present study a high and significant within populations genetic variations have been reported in previous studies using ISSR markers. In line with this, Dagmawit and Bekele, reported high (72.53%) within population genetic variation with only 27.47% for the among populations genetic variation for Korarima populations of Ethiopia using seven ISSR markers. Likewise, Hailu et al. reported high (64.8%) intra-population variations with lower (34.2%) inter-population variations for Korarima populations using ISSR markers. Genetic diversity is highly influenced by gene flow, which encompasses several mechanisms of gene exchange among populations. In this study the relatively high level of gene flow (Nm=1.93) could be due germplasm exchange in the form of seeds through sharing common markets among several of the adjacent areas where different populations were collected, and also pollen movement across populations. This result is consistent with earlier studies on similar and related crops. Kassahun et al. in coffee and Fikiru et al. in Lentil reported an among population genetic variation of 22% and 43.7%, respectively.
In this study, the among population genetic distance ranged from 0.10 to 0.49. The largest genetic distance (h=0.49) with relatively lowest gene flow of (0.29) was observed between the populations of West Arsi and West Gojam. This might be due to the high geographic distance between the two populations. They are considered to be the most distantly related populations. While, Vernonia populations of Borena and Konso were found to be more closely related with each other because they showed lower genetic distance. Both the UPGMA dendrogram and PCoA also revealed these two populations to be closely related as they are found in the same cluster [20].
The present study did not reveal a clear pattern of clustering of populations according to their zone of origin. The Neighbor Joining (NJ) cluster analysis grouped the total populations into three clusters. The analysis revealed that individuals samples from different populations clustered together and formed moderate pattern of clustering on the basis of geographic origins. The failure of most vernonia populations and individuals to cluster on the basis of their geographic origins could be due to the presence of considerable gene flow between and among local populations and between adjacent zones mainly in the form of pollen grains through different agents like wind, insect and birds, and also human mediated transfer of genetic material. This could be due to the close geographical proximity of the sampled plants contributing to their genetic similarity. Nwakanma also observed four cluster in 50 vernonia samples of Nigeria assessed using RAPD marker system. UPGMA based clustering of the eight populations resulted in two major clusters, confirming the presence of weak population differentiation as a result of the presence of high gene flow. The result of PCoA also supported the NJ-tree result that the individuals of the different groups failed to form distinct clusters, rather mixed up along the axis. PCoA confirmed the presence of high genetic relationships (intermixing of individuals) among the studied vernonia populations, likely due to the presence of high gene flow among populations at bordering areas through pollen grain movement and/or germplasm exchange in the form of seed through common marketing places. Moreover, the common result revealed from NJ, PCoA and UPGMA cluster showed populations from geographically distant locations, Konso and borana, to be clustered together. This indicates that populations from the two locations are genetically closely related because they are either originated from the same ancestor or could be due to exchange of genetic material between the two localities Chombe and Bekele. Population genetic structure analysis also revealed that delta K reached its maximum (a sharp peak at K=2), indicating that the populations of V. galamensis could be grouped into two main populations with genetic admixture. The analysis revealed that most of the populations possessed genetic background (alleles) from both sub-populations, confirming the presence of genetic admixture due to the origin, distribution and pollination patterns of V. galamensis germplasms and gene flow among the populations [21].
Conclusion
Vernonia galamensis is one of the major source of vernolic acid which has various industrial applications. In the present study nine ISSR markers have been used to explore the extent and patterns of genetic diversity and population structure of 60 vernonia genotypes representing eight populations collected from three major growing regions of Ethiopia. All the used ISSR markers were found to be highly informative, and hence, useful genetic tool to disclose the genetic structure of V. galamensis populations in Ethiopia. Among the eight studied populations, all diversity estimators indicate higher genetic diversity in vernonia population of East Shoa and East Hararge, indicating that these areas are hotspots for sources of desirable alleles for breeding values, and also for conservation purposes. This should be taken into consideration when conservation practices, management policies for the specie and site identification for in situ and ex situ conservation strategies are developed. Vernonia populations of West Arsi and West Gojam showed distant relationship, implying that they could be best combination to increase the genetic bases of Vernonia through crossing. Moreover, veronica populations of South Wollo showed the lowest genetic diversity, and thus, it should be considered during conservation strategies due to the putative risk of extinction that it could face because of low genetic diversity.
Acknowledgements
The authors are very thankful for the Institute of Biotechnology of Addis Ababa University, Ethiopia for providing laboratory space and facilities to conduct this research. We are also grateful for Ethiopian Biodiversity Institute (EBI) for providing study sorghum materials. We are also grateful for Adama Science and Technology University for small grant support.
Funding
The work was partly supported by Adama Science and Technology University, Ethiopia.
Author Contributions
Conceptualization: Gete Eshetu, Alemineh Mideksa and Tilahun Mekonnen; A data curation: Gete Eshetu and Tilahun Mekonnen; Formal analysis: Gete Eshetu and Tilahun Mekonnen; Funding acquisition: Kassahun Tesfaye; Investigation: Gete Eshetu Alemineh Mideksa and Tilahun Mekonnen; Methodology: Gete Eshetu Alemineh Mideksa and Tilahun Mekonnen; Project administration: Tilaun Mekonnen and Kassahun Tesfaye; Resources: Tilaun Mekonnen and Kassahun Tesfaye; Software: Gete Eshetu and Tilahun Mekonnen; Supervision; validation: Kassahun Tesfaye; Visualization: Gete Eshetu Alemineh Mideksa and Tilahun Mekonnen; Roles/Writing-original draft: Gete Eshetu and Tilahun Mekonnen; Writing-review and editing: Gete Eshetu Alemineh Mideksa and Tilahun Mekonnen.
Availability of Data and Materials
Full passport data of the Vernonia galamensis accessions used in this study is included.
Funding Source
The work was partly supported by Adama Science and Technology University, Ethiopia.
Author Agreement/Declarations
We confirm that the manuscript has been read and approved by all named authors and that there are no other persons who satisfied the criteria for authorship but are not listed. We further confirm that the order of authors listed in the manuscript has been approved by all of us.
Declarations of Interest
None.
Ethical Approval
The conducted research does not involve human participants or animals.
References
- Sun Y, Liu B, Xue J, Wang X, Cui H, Li R, et al. Critical metabolic pathways and genes cooperate for epoxy fatty acid-enriched oil production in developing seeds of Vernonia galamensis, an industrial oleaginous plant. Bio Biofuel Bio. 2022;15(1):21.
[Crossref] [Google Scholar] [PubMed]
- Mohamed AI, Mebrahtu T, Andebrhan T. Variability in oil and vernolic acid contents in the new Vernonia galamensis collection from East Africa. Proc Per New Crops and New Uses. ASHS Press Alexandria VA. 1999:272-274.
- Baye T, Becker HC. Genetic variability and interrelationship of traits in the industrial oil crop Vernonia galamensis. Euphytica. 2005;142:119-129.
- Shimelis H, Hugo A. Determination of selection criteria for seed yield and seed oil content in Vernonia (Vernonia galamensis variety ethiopica). Ind Crop Prod. 2011;33(2):436-439.
- Hussen KW. Review Paper on Genetic Diversity of Vernonina (Vernonia Galamensis L.) in Ethiopia. Int J Eng Inform System (IJEAIS). 2023;3:31-38.
- Baye T, Kebede H, Belete K. Agronomic evaluation of Vernonia galamensis germplasm collected from Eastern Ethiopia. Ind Crop Product. 2001;14(3):179-190.
- Angelini LG, Moscheni E, Colonna G, Belloni P, Bonari E. Variation in agronomic characteristics and seed oil composition of new oilseed crops in central Italy. Ind crop Product. 1997;6(3-4):313-323.
- Thompson AE, Dierig DA, Kleiman R. Characterization of Vernonia galamensis germplasm for seed oil content, fatty acid composition, seed weight, and chromosome number. Ind Crop product. 1994;2(4):299-305.
- Govindaraj M, Vetriventhan M, Srinivasan M. Importance of genetic diversity assessment in crop plants and its recent advances: an overview of its analytical perspectives. Genet Res Int. 2015;2015(1):431487.
- Bhandari HR, Bhanu AN, Srivastava K, Singh MN, Shreya HA. Assessment of genetic diversity in crop plants-an overview. Adv Plants Agric Res. 2017;7(3):279-286.
[Crossref] [Google Scholar] [PubMed]
- Hailu T, Hailesilassie T, Gadissa F, Feyissa T. Analyses of genetic diversity and population structure in cultivated and wild korarima Aframomum corrorima (Braun) PCM Jansen populations from Ethiopia using inter simple sequence repeats markers. J App Res Med Aromat Plant. 2022;30:100386.
- Brown E. Access to Smoking Cessation Services and Quitting Success: A Cross-Sectional Study in the UK. Addiction. 2018;38(2):189-201.
- Ramalema SP, Shimelis H, Ncube I, Kunert KK, Mashela PW. Genetic analysis among selected vernonia lines through seed oil content, fatty acids and RAPD DNA markers. Afr J Biotechnol. 2010;9(2).
- Nwakanma NM, Oboh BO, Adekoya KO, Ogunkanmi LA. Genetic Diversity of Vernonia as Revealed By Random Amplified Polymorphic DNA (RAPD) Markers. Egypt Acad J Biol Sci Bot. 2018;9(1).
- Nei M. Analysis of gene diversity in subdivided populations. Proceed Nat Acad Sci. 1973;70(12):3321-3323.
[Crossref] [Google Scholar] [PubMed]
- Hunt S. Ethnic Disparities in Tobacco Dependency: A Mixed-Methods Study in the UK. Ethn Health. 2018;19(3):287-301.
[Crossref] [Google Scholar] [PubMed]
- Johnson M. Tobacco Use among LGBTQ+Individuals in the UK: A Cross-Sectional Analysis. LGBT Health. 2019;12(1):56-68.
[Crossref] [Google Scholar] [PubMed]
- Evans R. Rural-Urban Disparities in Tobacco Dependency: A Multilevel Analysis in the UK. Rur Remot Heal. 2019;28(2):345-358.
- Bauld L. Impact of Plain Packaging and Graphic Health Warnings on Smoking Initiation in Young Adults: A Longitudinal Study in the UK. Tobacco Control. 2019;31(3):213-225.
- Semple S. The Impact of Smoke-Free Policies on Secondhand Smoke Exposure: Evidence from a National Study in the UK. Environmental Health Perspectives. 2021;45(4): 567-579. [Crossref][Google Scholar][PubMed]
- Angus C. Minimum Unit Pricing for Alcohol and Its Indirect Impact on Tobacco Dependency: A Policy Analysis in the UK. Alco Alcohol. 2020;42(5):345-357.
Citation: Eshetua G, Mideksa A, Mekonnen T, Tesfaye K (2025) Genetic Diversity and Population Structure Analysis of Vernonia (Vernonia galamensis (Cass.) Less L.) Germplasm in Ethiopia using ISSR Markers. J Pharmacogenom Pharmacoproteomics. 16:123.
Copyright: �© 2025 Eshetua G, et al. This is an open access article distributed under the terms of the Creative Commons Attribution License, which permits unrestricted use, distribution, and reproduction in any medium, provided the original author and source are credited.
