Indexed In
- Open J Gate
- Genamics JournalSeek
- JournalTOCs
- China National Knowledge Infrastructure (CNKI)
- Electronic Journals Library
- RefSeek
- Hamdard University
- EBSCO A-Z
- OCLC- WorldCat
- SWB online catalog
- Virtual Library of Biology (vifabio)
- Publons
- MIAR
- Euro Pub
- Google Scholar
Useful Links
Share This Page
Journal Flyer

Open Access Journals
- Agri and Aquaculture
- Biochemistry
- Bioinformatics & Systems Biology
- Business & Management
- Chemistry
- Clinical Sciences
- Engineering
- Food & Nutrition
- General Science
- Genetics & Molecular Biology
- Immunology & Microbiology
- Medical Sciences
- Neuroscience & Psychology
- Nursing & Health Care
- Pharmaceutical Sciences
Research Article - (2023) Volume 14, Issue 1
Exploring the Usefulness of Gaussian Process Regression for the Prediction of Oil, Water and Gas Production Rates
Etinosa Osaro1*, Vivian Okorie2 and Sonia Alornyo32Department of Chemical and Petroleum Engineering, University of Lagos, Lagos, Nigeria
3Department of Civil and Environmental Engineering, University of Notre Dame, IN, USA
Received: 14-Mar-2023, Manuscript No. JPEB-23-20122; Editor assigned: 16-Mar-2023, Pre QC No. JPEB-23-20122 (PQ); Reviewed: 03-Apr-2023, QC No. JPEB-23-20122; Revised: 10-Apr-2023, Manuscript No. JPEB-23-20122 (R); Published: 17-Apr-2023, DOI: 10.35248/2157-7463.23.14.506
Abstract
This study evaluated the performance of Gaussian Process Regression (GPR) models for predicting the production rates of oil, gas, and water in the energy industry. GPR is a non-parametric, Bayesian-based machine learning technique that models the uncertainty in the predictions, providing not only a prediction but also a confidence interval for the prediction. This study analyzed the impact of various input features on the production rates, including choke size, tubing head pressure, flow line pressure, basic sediment and water, net Application Programming Interface (API), well flowing pressure, and static pressure. The result of this study provides valuable insights into the potential of GPR for improving production forecasting and resource management in the oil and gas industry. The findings also shed light on the suitability of different kernels in modeling the production rates and the significance of each input feature in production forecasting and optimization. The use of GPR in production forecasting has the potential to increase efficiency, improve productivity, and reduce costs in the oil and gas industry.
Keywords
Petroleum production rates; Oil and gas industry; Gaussian Process Regression (GPR); kernels.
Introduction
Oil, gas, and water production are essential components of the energy industry and play a critical role in meeting global energy demands. Accurate predictions of these production rates are crucial for effective decision-making and resource management. In recent years, machine learning techniques have become increasingly popular in the oil and gas industry, providing a powerful tool for solving complex problems related to production forecasting. Gaussian Process Regression (GPR) is a machine learning technique that has shown promising results in a variety of applications, including the prediction of oil, gas, and water production rates [1–3].
GPR is a non-parametric, Bayesian-based technique that models the underlying relationship between the inputs and outputs [4– 6]. Unlike traditional regression techniques, GPR models the uncertainty in the predictions, providing not only a prediction but also a confidence interval for the prediction. This makes GPR an ideal tool for forecasting the production rates of oil, gas, and water, where the underlying processes are complex and uncertain.
In this study, the performance of GPR models was evaluated for predicting the production rates of oil, gas, and water using different kernels. The results of this study will provide valuable insights into the potential of GPR for improving production forecasting in the oil and gas industry. Additionally, the study will also help to shed light on the suitability of different kernels in modeling the production rates of these resources, which can provide a basis for future research in this field. The use of GPR in production forecasting has the potential to revolutionize the oil and gas industry by providing more accurate predictions, which can help to optimize resource allocation and decisionmaking. This, in turn, could lead to increased efficiency, improved productivity, and reduced costs. To accurately model the production rates of oil, gas, and water, it is important to consider the relevant input features that impact these rates.
In this study, a comprehensive set of input features was selected and analyzed for their impact on the production rates. The features selected include choke size, tubing head pressure, flow line pressure, basic sediment and water, net API, Well Flowing Pressure (Pwf), and Static Pressure (Ps). These features were carefully chosen to provide a comprehensive understanding of the underlying relationships between the input features and the production rates.
Choke size is an important factor in oil and gas production as it affects the flow rate of fluid from the well. The choke size is a device installed in the wellhead that regulates the flow of fluid by controlling the pressure drop across the choke. A smaller choke size results in a higher pressure drop and a reduced flow rate, while a larger choke size allows for a lower pressure drop and increased flow rate. In oil and gas production, the choke size is adjusted to maintain a desired flow rate and to optimize production [7].
Tubing head pressure refers to the pressure at the top of the tubing, which is the pipe that runs from the bottom of the well to the surface. It is an important parameter to consider in oil and gas production as it affects the flow rate of the production fluid. A high tubing head pressure can cause fluid to become trapped in the well, leading to reduced production rates, while a low tubing head pressure can result in excessive fluid flow, causing problems with the wellhead and downhole equipment.
Flow line pressure refers to the pressure of the fluid that is present in the pipeline that carries the produced fluid from the wellhead to the production facility. This factor plays a crucial role in determining the production rate of oil, gas, and water. High flow line pressure can result in decreased production due to the rise in backpressure at the wellbore, which hampers the flow of fluid. On the other hand, low flow line pressure can result in increased production but can also cause the formation of gas hydrate, a harmful solid form of gas that can block the flow line. This study evaluated the impact of flow line pressure on the production rates of oil, gas, and water as one of the input features considered in the GPR models. The findings of this study will provide important information about the significance of flow line pressure in production forecasting and its influence on optimizing production.
Basic Sediment and Water (BSW) refers to the mixture of solid particles and water present in the produced fluid from an oil well. BSW can have a significant impact on the production rates of oil, gas, and water as it can cause blockages and reduce the efficiency of production equipment. In this study, the effect of BSW on the production rates of oil, gas, and water was evaluated as part of the input features used in the GPR models. The results will provide valuable insights into the importance of BSW in production forecasting and its impact on production optimization. Additionally, the findings of this study can be used to improve production processes and minimize the negative impact of BSW on production efficiency.
The API gravity measurement of petroleum liquids, known as the Net API, is a crucial factor in determining the density and value of a well's production. This measurement compares the density of petroleum liquids to water, with higher API gravity indicating a lighter liquid and lower API gravity signifying a heavier liquid. This study analyzed the effect of Net API on the production rates of oil, gas, and water using GPR models, incorporating it as one of the input features. The results of this study will provide valuable insight into the relationship between Net API and production rate and its impact on production forecasting and optimization.
In this study, the effect of well flowing pressure on the production rates of oil, gas, and water was evaluated as part of the input features used in the GPR models. The results will provide valuable insights into the relationship between well flowing pressure and the production rate, and its impact on production forecasting and optimization. By understanding the relationship between well flowing pressure and the production rate, operators can make informed decisions on how to optimize the production of oil, gas, and water and maximize the potential of their wells.
Static pressure refers to the pressure of a fluid when it is stationary and not in motion. In the oil and gas production industry, the static pressure of a well represents the pressure of the fluid in the reservoir prior to the start of production. This pressure plays a crucial role in determining the production rate of oil, gas, and water as it impacts the flow rate of the fluid from the reservoir to the wellbore. A higher static pressure can lead to higher production rates, while a lower static pressure may result in reduced production. This study analyzed the effect of static pressure on the production rates of oil, gas, and water by incorporating it as one of the input features in the GPR models.
Methodology
The Machine Learning (ML) engine used in this study was the GPR, which is characterized by a mean and covariance called the kernel. Some of the many kernels used in GPR model include the matern kernel [8-9], Rational Quadratic Kernel (RQ) [10-12], Radial Basis Function (RBF) [13-14], the white-noise kernel [15].
The Matern kernel is a versatile covariance function used in GPR and other ML applications. It allows for more complex modeling of relationships between data points than the Squared Exponential (SE) kernel by considering the distance between points and a smoothness parameter. It is commonly used for modeling non-stationary processes and in spatial and temporal modeling.
The RQ kernel is a flexible covariance function in GPR and ML that models short and long-range dependencies between input variables by combining a squared exponential kernel and a white noise kernel. It is defined by two parameters-length-scale and smoothness-which control the smoothness and range of the covariance. The RQ kernel is useful for modeling non-stationary processes due to its ability to capture complex relationships between data points.
The RBF is a widely applied basis function in ML techniques, including support vector machines, neural networks, and GPR. It maps the input data into a higher-dimensional space by utilizing the distance between the input and a central point, allowing for non-linear separation of classes. RBFs exhibit great versatility in modeling complex relationships between inputs and outputs and are frequently used as kernel functions in nonlinear regression and classification.
In signal processing and ML, white noise kernel is a model for uncorrelated random data with constant power spectral density. It is utilized as a basic model for noise or background signal and as a covariance function in GP models, assuming constant variance and independence of observations. White noise kernel is employed to represent measurement errors, random fluctuations in data and regression analysis.
For this study, three kernels were considered: the RQ, RBF and matern kernels, and hyperparameter tuning was done [16-17].
Data generation
The input features for the model were derived from production data from a field, including choke size, Tubing Head Pressure (THP), Flow Line Pressure (FLP), Basic Sediment and Water (BSW), net API, Well Flowing Pressure (Pwf), and Static Pressure (Ps). The goal of the model was to use these input features to predict the output features of oil, water, and gas rates. The data used in this study was collected over a period of three years, representing the average production rate during the time periods when production was not completely shut down. 70% of the total data-set was used as the training data. The test data set was created by discretizing the choke size, THP, FLP, BSW, and net API values along the minimum and maximum values observed in the original data set. This test data set was different from the original data and was used to evaluate the performance of the machine learning model. This was done to further evaluate the impact of the input features. The input features of the training dataset were standardized using the mean and standard deviation from the corresponding test data feature.
Once the data was preprocessed and divided into training dataset, the Gaussian Process Regressor (GPR) machine learning model was trained using the RQ, RBF, and Matern kernels. The performance of the model was evaluated using metrics such as the coefficient of determination (R2) on the test data. The results showed the effectiveness of the GPR model in predicting the oil, water, and gas rates using the input features from the production field data.
Results
Using the matern kernel
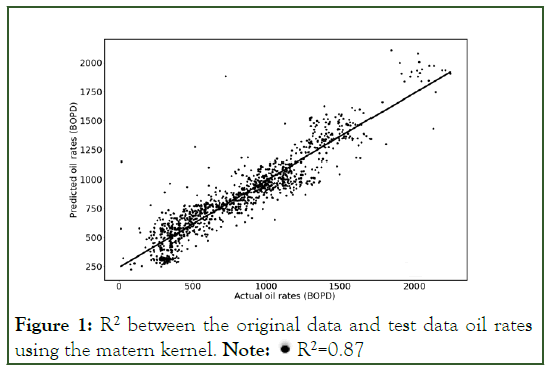
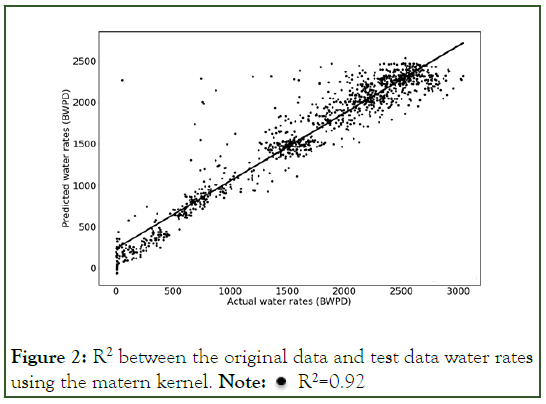
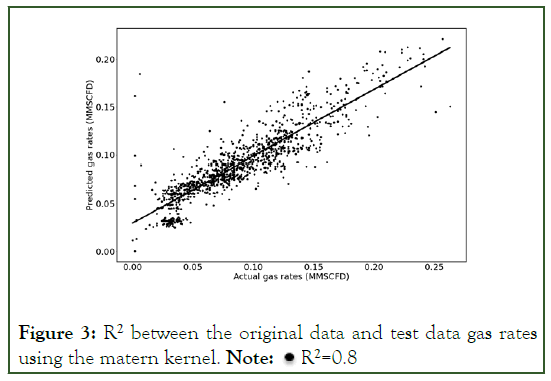
The predictions for oil, water, and gas rates were made using the three different kernels described in Section 2.0. Figures 1-3 depict the R2 plots comparing the results of the predictions of oil, water, and gas rates on the test data set to those of the original data set using the matern kernel. The R2 value obtained from modeling the oil rates was 0.87, while the R2 value for water rates was 0.92 and for gas rates was 0.8. This implies that the matern kernel performs well and there is room for improvement in the hyperparameters for the prediction of gas rates (Figures 1-3).
Figure 1: R2 between the original data and test data oil rates using the matern kernel. Note: • R2=0.87
Figure 2: R2 between the original data and test data water rates using the matern kernel. Note: • R2=0.92
Figure 3: R2 between the original data and test data gas rates using the matern kernel. Note: • R2=0.8
Using the rational quadratic kernel
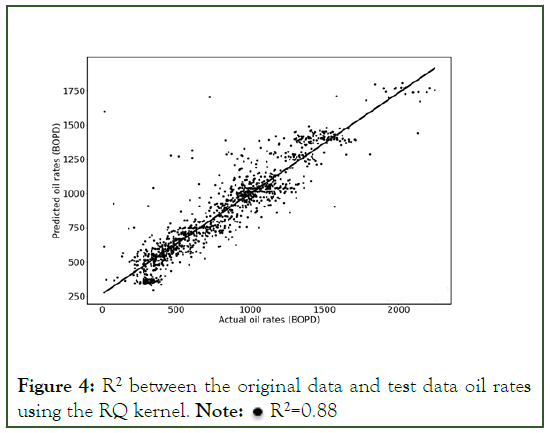
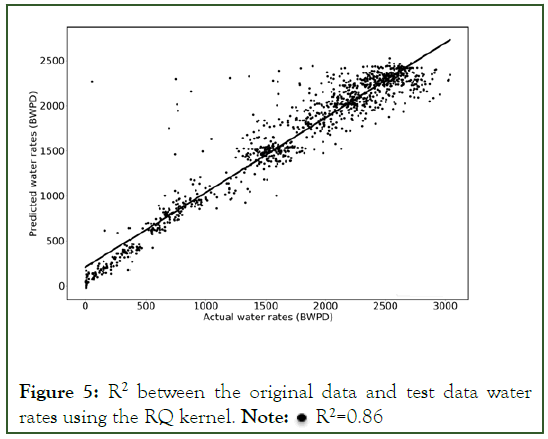
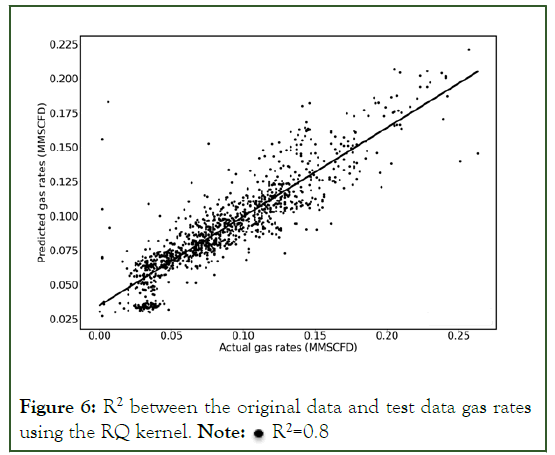
The results indicate that the RQ kernel was effective in modeling the oil and water rates, with R2 values of 0.88 and 0.86 respectively. However, the gas predictions were not as accurate, with an R2 value of only 0.8. This suggests that further optimization and refinement of the RQ kernel or the use of a different kernel could lead to improved predictions for the gas rates. Additionally, exploring other factors that may impact the accuracy of the gas predictions, such as the presence of outliers or the need for additional feature engineering, may also lead to improved results. Overall, the results of this study demonstrate the potential for GPR and ML techniques to provide valuable insights into oil and gas production rates and to inform production optimization efforts. Figures show the results for the oil, water and gas models respectively (Figures 4-6).
Figure 4: R2 between the original data and test data oil rates using the RQ kernel. Note: • R2=0.88
Figure 5: R2 between the original data and test data water rates using the RQ kernel. Note: • R2=0.86
Figure 6: R2 between the original data and test data gas rates using the RQ kernel. Note: • R2=0.8
Using the radial basis function kernel
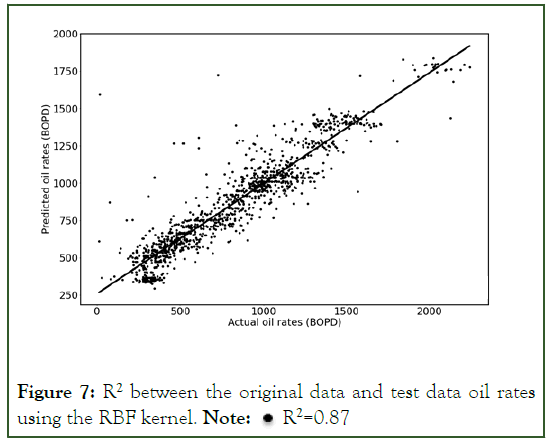
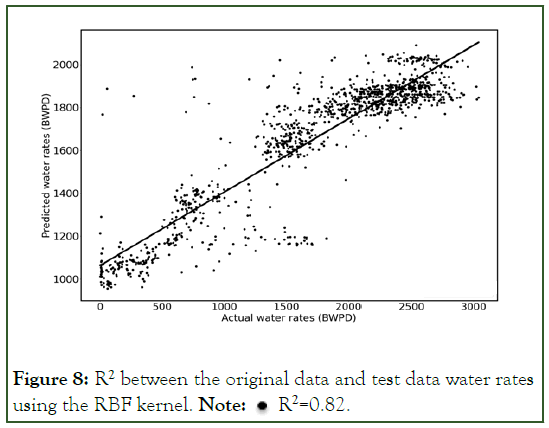
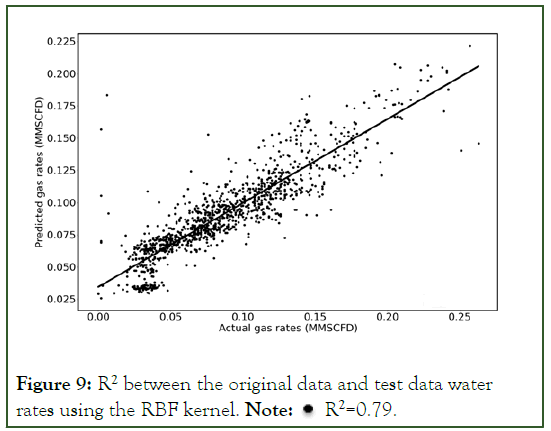
The results of using the RBF kernel for the prediction of oil, water, and gas rates in this study showed that the oil rate prediction was the best performer with an R2 of 0.87. This indicates that the RBF kernel was able to capture the relationship between the input variables and the oil rate effectively. The water rate prediction also performed well, with an R2 of 0.82, however, the gas rate prediction showed a poor performance, with an R2 of only 0.79.
It is important to note that R2 values close to 1 indicate a strong correlation between the predicted and actual values, while values close to 0 indicate a weak correlation [18-20]. In this case, the results indicate that while the RBF kernel was effective in predicting the oil and water rates, it was less effective in predicting the gas rates.
Further analysis may be required to determine the reason for the poor performance of the gas rate prediction and to determine if improvements can be made. This could include the use of different hyperparameters, the addition of more input variables, or the use of a different kernel function. Figures 7-9 shows the results for the oil, water and gas models respectively (Figures 7-9).
Figure 7: R2 between the original data and test data oil rates using the RBF kernel. Note: • R2=0.87
Figure 8: R2 between the original data and test data water rates using the RBF kernel. Note: • R2=0.82.
Figure 9: R2 between the original data and test data water rates using the RBF kernel. Note: • R2=0.79.
Conclusion and Recommendations
In conclusion, Gaussian Process Regression (GPR) is a promising tool for production forecasting in the oil and gas industry. This study evaluated the performance of GPR models for predicting the production rates of oil, gas, and water and analyzed the impact of different input features, including choke size, tubing head pressure, flow line pressure, basic sediment and water, net API, well flowing pressure, and static pressure, on the production rates. The results of this study will provide valuable insights into the potential of GPR for improving production forecasting and optimization in the oil and gas industry, as well as the suitability of different kernels in modeling the production rates of these resources. The findings of this study will also help to understand the significance of each input feature in production forecasting, which can be used to improve production processes and efficiency. In this study, we can conclude that the matern kernel is generally the better kernel. The choice of kernel is crucial as it controls the shape of the covariance function, and different kernels can lead to different predictions. Moreover, incorporating additional relevant information, such as geological data and well logs, into the GPR model could also improve the rate predictions. It is essential to continually evaluate and refine the GPR model to ensure that it provides accurate predictions of the oil, water, and gas rates. This will help with better decision-making for oil and gas production operations.
Acknowledgements
Author and co-authors will like to thank the production field in Nigeria for giving us the production data to carry out this study.
References
- Aldosari H, Elfouly R, Ammar R. Optimized Gaussian Process Regression for Prediction of Oil and Gas Pipelines Defect Length. EPiC Series in Comput. 2021;79:11-20.
- Laib O, Khadir MT, Mihaylova L. A Gaussian process regression for natural gas consumption prediction based on time series data. Inf Fusion. 2018;55-61.
- Asante-Okyere S, Shen C, Yevenyo Ziggah Y, Moses Rulegeya M, Zhu X. Investigating the predictive performance of Gaussian process regression in evaluating reservoir porosity and permeability. Energ. 2018;11(12):3261.
- Darwish MA, Cox PB, Proimadis I, Pillonetto G, Tóth R. Prediction-error identification of LPV systems: A nonparametric Gaussian regression approach. Automa. 2018;97:92-103.
- Park J, Lechevalier D, Ak R, Ferguson M, Law KH, Lee YT, et al. Gaussian process regression (GPR) representation in predictive model markup language (PMML). Smart Sustain Manuf Syst 2017;1(1):121-141.
[Crossref] [Google scholar] [PubMed]
- Wilson A G, Knowles D A, Ghahramani Z. Gaussian process regression networks. Proc Int Conf Mach Learn. 2012; 1: 599-606.
- Kargarpour MA. Oil and gas well rate estimation by choke formula: semi-analytical approach. J Pet Explor Prod Technol. 2019; 9(3):2375-2386.
- Melkumyan A, Ramos F. Multi-kernel Gaussian processes. Interna joint confer on artifi intell. 2011.
- Deshwal A, Doppa J. Combining latent space and structured kernels for bayesian optimization over combinatorial spaces. Adv Neural Inf Process Syst. 2021;34:8185-8200.
- Gheytanzadeh M, Baghban A, Habibzadeh S, Esmaeili A, Abida O, Mohaddespour A,et al. Towards estimation of CO2 adsorption on highly porous MOF-based adsorbents using gaussian process regression approach. Sci Rep. 2021;11(1):1-3.
- Deringer VL, Bartók AP, Bernstein N, Wilkins DM, Ceriotti M, Csányi G. Gaussian process regression for materials and molecules. Chem Rev. 2021;121(16):10073-10141.
[Crossref] [Google scholar] [PubMed]
- A. G. Wilson, R. P. Adams, Gaussian process kernels for pattern discovery and extrapolation. Int Conf Mach Learn. 2013;28:2104-2112.
- Pilario KE, Shafiee M, Cao Y, Lao L, Yang SH. A review of kernel methods for feature extraction in nonlinear process monitoring. Environ Proce. 2019;8(1):24.
- Khan S, Naseem I, Togneri R, Bennamoun M. A novel adaptive kernel for the rbf neural networks. Circuits Syst Signal Process. 2017;36:1639-1653.
- Tobar F, Bui TD, Turner RE. Learning stationary time series using Gaussian processes with nonparametric kernels. Adv Neural Inf Process Syst. 2015;28.
- Elgeldawi E, Sayed A, Galal AR, Zaki AM. Hyperparameter tuning for machine learning algorithms used for arabic sentiment analysis. Comput Sci. 2021; 8:79.
- Wu J, Chen XY, Zhang H, Xiong LD, Lei H, Deng SH. Hyperparameter optimization for machine learning models based on Bayesian optimization. J Electron Sci Technol. 2019;17(1):26-40.
- Ozili PK. The acceptable R-square in empirical modelling for social science research. Soc Sci Med. 2022.
- Reisinger H. The impact of research designs on R2 in linear regression models: an exploratory meta-analysis. J Empir Gen Mark Sci. 1997;2(1).
- Chicco D, Warrens MJ, Jurman G. The coefficient of determination R-squared is more informative than SMAPE, MAE, MAPE, MSE and RMSE in regression analysis evaluation. PeerJ Comput Sci. 2021;7:623.
[Crossref] [Google scholar] [PubMed]
Citation: Osaro E, Okorie V, Alornyo S (2023) Exploring the Usefulness of Gaussian Process Regression for the Prediction of Oil, Water and Gas Production Rates. J Pet Environ Biotechnol. 14.506.
Copyright: © 2023 Osaro E, et al. This is an open-access article distributed under the terms of the Creative Commons Attribution License, which permits unrestricted use, distribution, and reproduction in any medium, provided the original author and source are credited.
