
Indexed In
- Online Access to Research in the Environment (OARE)
- Open J Gate
- Genamics JournalSeek
- JournalTOCs
- Scimago
- Ulrich's Periodicals Directory
- Access to Global Online Research in Agriculture (AGORA)
- Electronic Journals Library
- Centre for Agriculture and Biosciences International (CABI)
- RefSeek
- Directory of Research Journal Indexing (DRJI)
- Hamdard University
- EBSCO A-Z
- OCLC- WorldCat
- Scholarsteer
- SWB online catalog
- Virtual Library of Biology (vifabio)
- Publons
- MIAR
- University Grants Commission
- Euro Pub
- Google Scholar
Useful Links
Share This Page
Journal Flyer
Open Access Journals
- Agri and Aquaculture
- Biochemistry
- Bioinformatics & Systems Biology
- Business & Management
- Chemistry
- Clinical Sciences
- Engineering
- Food & Nutrition
- General Science
- Genetics & Molecular Biology
- Immunology & Microbiology
- Medical Sciences
- Neuroscience & Psychology
- Nursing & Health Care
- Pharmaceutical Sciences
Research Article - (2021) Volume 12, Issue 10
Effects of Dietary Protein Level on Growth Performance of Pre-growing Catfish Clarias jaensis (Boulanger 1909) Fingerlings in Captivity
Komguep N. Ronald1*, Efole E. Thomas1, Defang F. Henry2, Nana T. Alrigent1, Mube K. Herve2 and Tagning Z.P. Davy12Research Unit in Animal Nutrition and Production (RUANP), University of Dschang, Cameroon
Received: 20-Oct-2021 Published: 10-Nov-2021, DOI: 10.35248/2155-9546.21.12.658
Abstract
The study of the effects of protein level on the survival rate, growth performance and the cost of production of pre-maturing Clarias jaensis fingerlings was carried out for 90 days at the Teaching and Research farm (5°36'-5°44'; 5°37'- 5°- 44'LN; 9°94' -10°06'and 9°85' - 10°06' LE; altitude 1392 -1396 m) of the University of Dschang. The aim of this work was to improve the production of this fish by determining its protein requirements. For this purpose, 360 Fingerlings of Clarias jaensis with an average weight of 23 ± 1.8 g and Total length 13.95 ± 2.90 cm were divided into 4 batches corresponding to diets containing 30; 35; 40 and 45% crude protein in the feed. The fish were fed twice a day at 5% of the ichthyobiomass and the quantities of feed where readjusted each month after biometrical monitoring. Data collected were analyzed by using SPSS 20.0 to test the effect of protein level on survival, growth characteristics and feed production cost. The results obtained revealed that the lowest survival rate (80.03 ± 2.5%) was recorded with the 30% protein ration and the highest (89.23 ± 1.72%) with the 45% protein level in the feed. Feed intake and total length were not affected by the protein level in the feed. The highest weight gain (89.33 ± 1.99 g), mean daily gain (0.99 ± 0.05 g), specific growth rate (1.75 ± 0.10%), K factor (0.98 ± 0.23) were recorded with fingerlings fed with 45% of crude protein in the diet (P< 0.05). The lowest feed conversion ratio (3.32 ± 0.1) and protein efficiency ratio (0.67 ± 0.20) where obtained with the ration containing 45% crude protein and the highest feed conversion ratio (4.04 ± 0.05) and protein efficiency ratio (0.84 ± 0.12) with 30% crude protein (P<0.05). The Lowest cost for the production of a kg of body weight (606.03 FCFA ± 10.44) was obtained with the ration containing 30% protein but no difference was recorded between different feed. The study revealed that in the formulation of feed for the Clarias jaensis fingerlings, 45% of crude protein will optimize survival rate, growth performance and cost of production.
Keywords
Clarias jaensis; Fingerlings; Crude proteins; Growth; Survival; Production cost
Introduction
The world's population is expected to reach nearly 9.7 billion by 2050 [1]. This increase in the population leads to an increasing demand for animal protein in general and for fisheries in particular. The supply of the population with fishery resources from the natural environment is increasingly limited due to pollution, climate change, destruction and degradation of habitat by human actions [2,3] and especially overexploitation which threatens nearly 31% of natural stocks [1]. The practice of aquaculture, which continues to grow over the years [4] helps to preserve natural stocks and repopulate continental and marine waters [5]. It is therefore presented as a means of achieving one of the Sustainable Development Goals (SDGs), the aim of which is to ensure a sustainable environment through the preservation and enhancement of biodiversity [6].
In Cameroon, very few endogenous species have undergone a domestication program and they have the advantage of adapting better to environmental conditions. Hence an interest was given to an endogenous fishery resource belonging to the family Clariidae and known as Claria jaensis. The Claridae family is marked by its hardiness, omnivorous diet, rapid growth (3 g/day) correlated with its ability to efficiently process composed feed and it’s much appreciated flesh [7].
The domestication of the still little known species Clarias jaensis, which is the subject of uncontrolled exploitation by farmers for profit and feed purposes [8] could like any other local species, make it possible to support sustainable aquaculture development [2].
This domestication requires a mastery of housing, feed and feeding, health and reproduction techniques. Among these techniques, feed and feeding is the most important because it represents almost 70% of production costs. Also, one of the important aspects of diet is determining nutrient requirements. Among these, energy requirement for physiological stages in Clarias jaensis has been studied [9]. However, up to our knowledge, there are limited or no information on the protein requirement for the growth of Clarias jaensis. Protein requirement study is one of the most important aspects on fish nutrition. Protein provides essential amino acids which are used for tissue repair and growth of the fish [10,11]. Dietary protein has significant importance in aquaculture systems because it represents considerable economic investment and a central factor that determines fish growth so long as other physiological requirements needed for growth are fulfilled [12].
This Study is aimed at contributing to the improvement of fish production by determining nutritional needs of Clarias jaensis.
Materials and Methods
Study area
This study was conducted at the Teaching and Research Farm of the Faculty of Agronomy and Agricultural Sciences of the University of Dschang (UDs). Dschang, a mountainous city, is located west of Cameroon at latitude 5°26’ North, longitude 10°26’ East and at an altitude of 1420 m and an average rainfall of 2000 mm per year.
Animal material
A total of 360 fingerlings of Clarias jaensis with an average weight of 23 ± 1.8 g obtained from fishermen in the Mbô floodplain, located in the Western region of Cameroon and transported in to the study site were used. Immediately on arrival, fish were acclimatized for two weeks in concrete tanks. During the acclimatization period, a 3A feed based on fishmeal, soybean meal and middling containing 40% of crude protein were given to them until satiety twice daily between 6-8 a.m. and 4-6 p.m.
Livestock structures
12 happas of 1 m3 (1 × 1 × 1m) attached to the four sides to Chinese bamboos firmly embedded in a 100 m2 pond, of average depth 0.90 m and supplied with water from a water dam located at 150 m distance were used. The pond was equipped with a 5 cm diameter water supply pipe with an average water flow rate of 0.14 m3/s and a 10 cm diameter PVC overflow pipe with an average flow rate of 0.14 m3/s so as to maintain a water height of 0.80 m. Each happa was also equipped with a circular floating frame 30 cm in diameter placed on its surface and vertically there was placed a 33 cm diameter basin located 0.70 m away to collect uneaten feed.
Experimental diets
Four isoenergetic experimental diets (Table 1) were formulated with different protein levels, namely 30%, 35%, 40% and 45%. Each diet was made from ingredients previously ground, homogenized manually and wetted with drilling water (0.8-1 liter for 5 kg of feed) so as to obtain a homogeneous paste, then granulated using a chopping machine with a sieve mesh diameter of 0.2-0.4 cm. The granules obtained were then dried in an electric dryer at 45°C. for 48 hours and stored in labeled plastic bottles. The Chemical composition of crude protein and metabolisable energy of different diet were obtained by AOAC (2000) method [13].
| Ingrédients | R1 (30%) | R2 (35%) | R3 (40%) | R4 (45%) | |
|---|---|---|---|---|---|
| corn | 34 | 28.5 | 24.5 | 20 | |
| Cassava | 5 | 4 | 4 | 1 | |
| Wheat bran | 10 | 7 | 4 | 4 | |
| Cottonseed cake | 6 | 5.5 | 2.5 | 1 | |
| Soybean meal | 6 | 6 | 4 | 4 | |
| Blood meal | 3 | 5 | 7 | 10 | |
| Fishmeal | 28 | 36 | 46 | 52 | |
| Shell meal | 0.5 | 0.5 | 0.5 | 0.5 | |
| Bone meal | 0.5 | 0.5 | 0.5 | 0.5 | |
| Palm oil | 5 | 5 | 5 | 5 | |
| Premix 2% | 2.00 | 2.00 | 2.00 | 2.00 | |
| Total | 100.00 | 100.00 | 100.00 | 100.00 | |
| Analysed Chemical composition | |||||
| CP (%) | 29.1 | 34.2 | 39.1 | 44.5 | |
| ME (kcal/kg) | 3118.46 | 3100.42 | 3107.96 | 3104 | |
| ME/CP | 107.16 | 90.65 | 79.48 | 69.75 | |
| Ca/P | 1.76 | 1.82 | 1.87 | 1.68 | |
Table 1: Composition of experimental diet.
Experimental set-up
360 Clarias jaensis fingerlings were divided into 4 comparable groups (90 fingerlings/groups) of equal size repeated 3 times with 30 fish per repetition. Each group was randomly assigned one of the experimental diets R1 (30%); R2 (35%); R3 (40%) and R (45%).
Conduct of the test and data collected
Feed was distributed twice a day (8 am and 6 pm) at 3% of the ichtyobiomasse. Each month, a biometrical monitoring was conducted in each group using a 0.1 g precision electronic scale (OHAUS) an icthyometer to evaluate growth characteristics and adjust the amount of feed given. Uneaten feed were collected weekly, sun-dried and weighed to estimate feed intake. The physicochemical parameters of the water (temperature, dissolved oxygen, pH) were measured weekly and recorded in Table 2.
| Physicochemical characteritics of water | Month 1 | Month 2 | Month 3 |
|---|---|---|---|
| Température (°C) | 21.7 ± 0.08 | 22.6 ± 0.02 | 19.7 ± 0.02 |
| Oxygène (mg/l) | 3.53 ± 0.32 | 3.48 ± 0.19 | 3.70 ± 0.15 |
| pH | 5.72 ± 0.38 | 5.35 ± 0.02 | 5.37 ± 0.02 |
Table 2: Physicochemical parameters of the water during the study.
Studied characteristics
Survival rate

Growth characteristics and cost of production
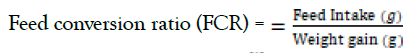
Feed intake (FI) = Feed distributed (g) – Left over (g)
Weight gain (WG) = Final body weight (g) - initial body weight (g)
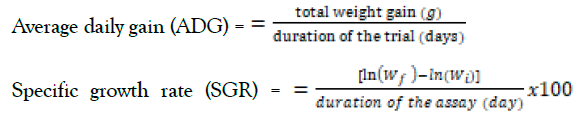
Wf: final average weight, Wi: initial average weight
Condition factor 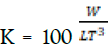 With W = Weight (g) LT = Total length (cm)
The cost of a kg of feed was calculated based on the price of each ingredient as practiced in the local market.
The cost of feed consumed was obtained by multiplying the average feed intake by the price of a kg of the corresponding diet. Price per kilogram of feed (PFC): PFC = Σ (Xi × Px); Xi = Quantity of ingredient (i) in (Kg); Px = Price of the ingredient (i) in FCFA.
The cost of production of a kg of live body weight was calculated by multiplying the cost of a kg of feed by the corresponding feed conversion ratio: Price of kilogram of feed consumed (PFC): FCP= FCR × PFC; FCR = Feed Conversion ratio.
Statistical analysis
One-way ANOVA was used to test the effect of protein level on survival and growth characteristics. When there were significant differences between the means, they were separated by Duncan's test at 5% significance level. SPSS 20.0 statistical software was used for these analyzes.
Results
Effects of protein level on the survival rate of pre-growing Clarias jaensis
Figure 1 which illustrates the effect of protein level on the survival rate of Clarias jaensis in captivity reveals that survival rate tends to increase with the level of protein in the diet. Hence, the highest survival rates were obtained with the diet R4 (89.23 ± 1.72%) and R3 (88.73 ± 7.5%) rations which were otherwise comparable to the R2 ration (83 ± 3.05%). The lowest survival rate (80.03 ± 2.5%) was obtained with the ration at 30% of the protein level

Figure 1: Effects of protein level on the survival rate of Clarias jaensis. a and b: histograms with the same letters are not significantly different (P> 0.05).
Effects of protein level on growth characteristics and feed cost production of pre-maturing Clarias jaensis
The effects of graded level of crude protein on the growth characteristics and the feed production costs of Clarias jaensis fingerlings are presented in Table 3 and illustrated by Figures 2-4. In general, it appears that with the exception of the feed conversion ratio, growth performance increased significantly with the increasing level of protein in the diets. The level of protein in the diet did not have a significant effect on feed consumption.
| Growth Characteristics and Cost Production | Protein Level (%) | ||||
|---|---|---|---|---|---|
| 30 | 35 | 40 | 45 | p | |
| FI (g) | 300.44 ± 0.82a | 303.99 ± 11.42a | 301.17 ± 9.00a | 296.77 ± 3.6a | 0.71 |
| Wi (g) | 23.47 ± 1.78a | 23.67 ± 1.81a | 23.08 ± 1.7a | 23.35 ± 1.80a | 0.28 |
| Wf (g) | 97.76 ± 5.44d | 102.23 ± 2.58c | 105.28 ± 3.92b | 112.53 ± 4.27a | 0 |
| TLf (cm) | 24.99 ± 0.98a | 24.02 ± 1.00a | 23.27 ± 1.31a | 22.74 ± 1.67a | 0.21 |
| WG (g) | 74.30 ± 0.91d | 78.56 ± 0.78c | 82.20 ± 1.64b | 89.33 ± 1.99a | 0 |
| DMG (g) | 0.83 ± 0.06d | 0.87 ± 0.03c | 0.91 ± 0.05b | 0.99 ± 0.05a | 0 |
| FCR | 4.04 ± 0.05a | 3.87 ± 0.18ab | 3.66 ± 0.15b | 3.32 ± 0.104c | 0.001 |
| PER | 0.84 ± 0.12 a | 0.75 ± 0.36 b | 0.69 ± 0.28c | 0.67 ± 0.20 c | 0 |
| SGR (%) | 1.58 ± 0.11d | 1.62 ± 0.08c | 1.68 ± 0.09b | 1.75 ± 0.10a | 0 |
| K | 0.63 ± 0.08d | 0.74 ± 0.09c | 0.85 ± 0.16b | 0.98 ± 0.23a | 0 |
| FCP | 686.15 ± 35.03a | 673. 49 ± 56.37a | 720.53 ± 56.38a | 699.71 ± 29.87a | 0.61 |
Table 3: Effects of protein level on growth characteristics and alimentary Cost production of pre-maturing Clarias jaensi.

Figure 2: Monthly evolution of the total length of Clarias jaensis juveniles as a function of the protein level.

Figure 3: Monthly evolution of weight gain according to the protein level of the food.

Figure 4: Monthly evolution of the condition factor K as a function of the protein level of the food.
Live weight: It emerges from Table 3 that the level of proteins in the ration significantly influenced the live weight of the prefattening Clarias jaensis juveniles. This weight tends to increase with the increasing level of protein in the diet. The highest live weight (112.53 ± 4.27) was obtained with R4 ration (45% of protein) while the lowest live weight (97.76 ± 5.44) was obtained with the R1 ration (30% of protein).
The monthly weight curve illustrated in Figure 2 shows the same trend, and the same profile. However, from month 2, the weight of the fish fed with the ration R4 (45% of protein) is above the other weights followed by that of R3 (40% of protein) and R2 (35% of protein) and the lowest curve is that of fish receiving the ration containing 30% protein in the feed
Total length: Whatever the protein level considered, no significant effect (P <0.05) was observed on the total lengths of the fish although the highest (24.99 ± 0.98) was observed with the ration containing the lowest protein level and the lowest (22.74 ± 1.67) was recorded with the 45% protein ration (Table 3). In addition, we noted the same pace, the same trend and the same profile in the monthly evolution of this length (Figure 2).
Weight gain and average daily gain: The highest weight gain (89.33 ± 1.99) and the mean Daily gain (0.99 ± 0.05) were recorded with the ration containing the highest level of proteins (45%) and the lowest (74.30 ± 0.91 and 0.83 ± 0.06). with 30% protein (Table 3). Throughout the test, the weight gain of the fish fed the lowest protein level (30%) and remained lower than the other weight gains while that of the fish receiving the 45% protein ration remained above as shown in Figure 3.
K condition factor: Condition factor K tends to increase significantly (P< 0.05) with increasing protein levels (Table 3). Thus the highest condition factor K (0.98 ± 0.23) was obtained with the 45% protein ration and the lowest (0.63 ± 0.08) with the 30% protein ration. Likewise, the monthly evolution curve of the condition factor k of fish receiving the lowest protein level remained lower than that of the other curves. At the end of the test, the curve of the fish receiving the highest protein level (45%) is higher than the others, followed by that of 40% and 35%.
Feed Conversion Ratio (FCR) and Protein Efficiency Ratio (PER): The FCR tended to decrease significantly (P< 0.05) with increasing protein level. The lowest value (3.32 ± 0.10) was recorded with the ration richest in protein R (45%), followed by (3.66 ± 0.15) obtained with Ration R (40%) and the highest (4.04 ± 0.05 and 3.87 ± 0.18) recorded respectively with the rations R (30%) and R (35%) otherwise not significant between them. However, there was no significant difference between the treatments.
Unlike Feed conversion ratio, the PER tended to decrease significantly (P <0.05) with the level of protein in the feed. The lowest PER (0.67 ± 0.2%) was recorded with the highest protein level (45% of crude protein) and the highest (0.84 ± 0.2%) was recorded with the ration containing 30% protein in the feed
Specific Growth Rate (SGR): The specific growth rate increased with increasing protein levels. It was highest with the R4 ration (45%) followed by the 40% protein ration and the lowest value was obtained with the 30% and 35% protein rations respectively.
Feed cost of production: The feed cost of production tends to increase with increasing protein levels in the feed. However, the highest Feed cost (720.53 ± 56.37 FCFA) was obtained with the 40% protein ration followed by the 45% protein ration (699.71 ± 29.87 FCFA). Although the cost of feed consumption was higher with the R4 ration (210.48 ± 2.55 FCFA), and lower with the 30% protein ration (169.31 ± 9.38 FCFA), the cost of feed production did not show any difference between the different feeds.
Discussion
The survival rate was significantly affected (P> 0.05) by the level of protein in the feed. This rate varied from 80.03% with the 35% protein ration to 89.23% with the 45% protein ration. These results are similar to those of [14] in which the survival rate increases significantly with the protein level of the feed in the big head catfish (Clarias microcephalus). Indeed, this author obtained a protein rate of 67.5% with the 25% protein ration and 100% with the 45 to 50% protein rations. When the protein level is insufficient and does not cover the needs of the fish, it uses its body proteins to maintain its minimal functions for survival [14].
Protein level in the feed had no effect on feed intake. These results are similar to those of [15] but differ from those of [16,14] obtained respectively with the fingerlings of catfish Horabagrus brachysoma and Clarias macrocephalus. The observed difference may be due to the methodology used (feed formulation), the species as well as the breeding environment.
In this study, the protein level affected significantly weight, weight gain, Daily weight gain, specific growth rate and condition factor K which tended to increase with increasing rate of protein in the feed. Of all these characteristics, the values obtained with the 30% protein ration were the lowest, followed by the 35% protein ration. The best results were recorded with 45% protein in the feed.
These results are different from those of [15-18] in whom the best weights, Weight gain, specific growth rates were recorded with protein levels of 42.5%, in Clarias gariepinus, 40% in Silurus asotus, and 35% in Horobagrus brachysoma and Clarias gariepinus. Insufficient protein content in feed induces poor weight gain due to insufficient supply of amino acids necessary for tissue production [19].
The ADG varied from 0.83 ± 0.06 for fish fed the feed with 30% protein to 0.99 ± 0.05 for fish fed the feed with 45% protein. This ADG is close to 0.90 ± 0.10 and 1.01 ± 0.16 obtained by Tsoupou KSG [9] in determining the energy requirements for the same species. In general, in other claridae, the ADG is around 3 g/day, a difference of around 2 g when compared with our results. This difference could be due to environmental conditions. Indeed, Warm temperatures of 25 to 32°C accelerate metabolism and stimulate growth in fish [20]. Conversely, cold temperatures slow down metabolism and therefore growth.
The protein efficiency ratio has tended to increase with the growing level of supplemental protein. These results are similar to those of [14] the effectiveness of proteins is high in low protein feeds because fish will maximize the use of the protein source for making body tissues. The same trend has also been recorded at Oreochromis niloticus in whom the use of feed proteins has decreased from 2.35 to 1.58 at the fry stage and from 1.92 to 1.19 at fingerlings stage and from 1.53 to 0.99 at the growth Stage [21].
[22] Reported that fish often have their best growth when they are fed with concentrations of feed proteins lower than those producing maximum growth and the lowest feed conversion ratio.
Conclusion
With the exception of feed intake and survival rate, growth characteristics and cost of production were significantly affected by the level of protein in the feed. The best body weight, weight gain, average daily gain, specific growth rate, consumption index and K condition factor were obtained with the feed containing the highest protein level. This ration was also one of the least economical.
The results of this study suggest that the protein requirement for maximum growth and of Clarias jaensis fingerlings may be 45%.
REFERENCES
- FAO. La situation mondiale des pêches et de l’aquaculture. Contribuer à la sécurité alimentaire et à la nutrition de tous. Rome. 2016;224
- Lazard J, Et Levêque C. Introductions et transferts d’espèces de poissons d’eau douce. In Lazard J et Lésel R. Pisciculture: Poisson de demain. Cahier Agricole.2009;18(3): 157-173.
- Domwa M. Prévalence et intensité d’infestation de Clarias jaensis (Boulager, 1909) et Clarias gariepinus (Burchell, 1822) par Eustrongylides et Contracaecum dans la plaine des Mbô au Cameroun. Thèse de Master. Université de Dschang.2012;71.
- FAO. La situation mondiale des pêches et de l’aquaculture, Rome. 2014;255.
- Boujard T, Gélineau A, Denis C, Corraze G, Gilbert D, Eric G, et al. Regulation of feed intake, growth, and nutrient and energy utilization in European sea bass (Dicentrarchus labrax) fed high fat diets. Aquaculture living ressources. 2004;5:529-545.
- OMD. Objectifs du millénaire pour le développement. Rapport des Nations Unies, New York. 2014; 59.
- Lacroix. Pisciculture en zone tropicale. GFA Terra Systems Eulenkrugstraße 82 22 359 HamburgAllemagne. 2004;231.
- Zango P. Caractéristiques de reproduction comparées en milieu naturel Clarias gariepinus et Clarias jaensis. Université de Dschang. Mémoire de fin d’études. 2009;98.
- Tsoupou KSG, Efole ET, Moussala OJ, Tchoumboue J. Effect of various levels of metabolize energy on growth performance of clarias jaensis fingerlings (boulenger, 1909). Int J Res Granthaalayah. 2018;6(5). DOI: 10.5281/zenodo.1254567 Vol.6 (Iss.5): May 2018.
- Amoah YT. Effect of dietary protein levels on growth and protein utilization in juvenile arctic char (Salvinus alpinu). United Nations University Fisheries Training Programme, Iceland [final project]. 2012.
- Nwanna LC, Omojola I, Nwanna E, Abiodun E. Effect of protein deficient diets on the growth and carcass protein ash ratio of African catfish Clarias gariepinus (Burchell 1822), J Appl Sci Enviro Manag. 2014.
- Buttle LG, Uglow RF, Cowx IG. Effect of dietary protein on the nitrogen excretion and growth of the African catfish, Clarias gariepinus. Aquatic Living Resources. 1995;8:407-414.
- AOAC (Association of Official Analytical Chemists) In: Official Methods of Analysis (Helrick, K. ed.) AOAC, Arlington, VA, USA. 2000;69-78.
- Tran TTH, Lu T, Tran LCT, Bui MT. Dietary protein requirement of bighead catfish (Clarias macrocephalus Gunther, 1864) fingerling. Int J Sci Res Publ. 2018;8(11):2250-3153.
- Effiong MU, Esenowo IK. Effects of varying protein levels on Clarias gariepinus (Burchell, 1822) growth, Proteinutilization and yield in Hapa system. Asian J Biol. 2018;5(1):2456-7124.
- Girri S, Sahoo S, Paul B, Mohanty S, Sahu AK. Effects of dietary protein level on growth, feed utilization and carcass composition of endangered bagrid catfish Horabagrus brachysoma (Gunther 1864) fingerlings. Aquauliture Nutrition. 2011;17:332-337.
- Kyoung-Duck Kim, Sang Gu Lim, Yong Jin Kang, Kang-Woong Kim, Maeng Hyun Son. Effects of Dietary Protein and Lipid Levels on Growth and Body Composition of Juvenile Far Eastern Catfish Silurus asotus. Asian-Aust. J Anim Sci. 2012;25(3):369-374.
- Keremah R, Beregha O. Effect of varying dietary protein levels on growth and nutrient utilization of african catfish clarias gariepinus fingerlings. J Exp Biol and Agric Sci. 2014;2(1):86-94.
- Halver JE, Hardy RW. Fish nutrition (3rd edn). Academic Press, New York, U.S.A. 2002;143-175.
- Kemp JOG. Effects of temperature and salinity on resting metabolism in two South African rock pool fish: the resident gobiid Caffrogobius caffer and the transient sparid Diplodus sargus capensis. African Zoology. 2009;44:151-158.
- Mohsen AT, Ahmad MH, Khattab YAE, Shalaby AME. Effect of dietary protein level, initial body weight, and their interaction on the growth, feed utilization, and physiological alterations of Nile tilapia, Oreochromis niloticus (L.). Aquaculture 2010;298: 267-274.
- Milikan MR. Effects of dietary protein concentration on growth, feed efficiency and body composition of age-0 striped bass. Trans Am Fish Soc. 1982;111:373378
Citation: Komguep NR, Efole TE, Defang FH, Nana TA, Mube KH, Tagning ZPD (2021) Effects of Dietary Protein Level on Growth Performance of Pre-growing Catfish Clarias jaensis (Boulanger 1909) Fingerlings in Captivity. J Aquac Res Dev 12:658.
Copyright: © 2021 Komguep NR, et al. This is an open access article distributed under the term of the Creative Commons Attribution License, which permits unrestricted use, distribution, and reproduction in any medium, provided the original work is properly cited.