Indexed In
- Open J Gate
- Genamics JournalSeek
- Academic Keys
- JournalTOCs
- The Global Impact Factor (GIF)
- China National Knowledge Infrastructure (CNKI)
- Ulrich's Periodicals Directory
- RefSeek
- Hamdard University
- EBSCO A-Z
- OCLC- WorldCat
- Publons
- Geneva Foundation for Medical Education and Research
- Euro Pub
- Google Scholar
Useful Links
Share This Page
Journal Flyer

Open Access Journals
- Agri and Aquaculture
- Biochemistry
- Bioinformatics & Systems Biology
- Business & Management
- Chemistry
- Clinical Sciences
- Engineering
- Food & Nutrition
- General Science
- Genetics & Molecular Biology
- Immunology & Microbiology
- Medical Sciences
- Neuroscience & Psychology
- Nursing & Health Care
- Pharmaceutical Sciences
Research Article - (2019) Volume 10, Issue 3
Development and Validation of Robust Analytical Method to Determine Droplets Size Distribution of Nasal Spray Using Laser Diffraction Technique
Mugada Ravi Prasada Rao1*, Paul Mogadati2, Srinivas Arutla3 and Mahibalan Senthi12AR&D Consultant, Innovative Scientific Services Inc, Rutgers University, East Greenbush, New York, USA
3Product Development, Apotex Research Pvt. Ltd., Bangaluru, India
Received: 17-Jul-2019 Published: 13-Aug-2019, DOI: 10.35248/2153-2435.19.10.611
Abstract
In the recent past, delivery of therapeutic agents through the nasal route becoming a very attractive proposition, especially when rapid absorption and effects are required. The droplets size of a nasal spray dosage form is important for both efficacy and toxicity. In this study, an attempt was made to develop and validate a method to measure the droplets size distribution in Fluticasone nasal spray using Malvern spray tech coupled with automatic actuation station at various angles. Devices were actuated at the force of 6.0 kg, the velocity at 60 mm/s and rate of acceleration at 5000 mm/s2. Data was collected for 150 ms at a height of 6.0 cm from the tip of the device. The method was evaluated for their precision, robustness and impact of different actuation angle on the formation of droplets size. The study revealed that changing the actuation angle from 0° to 45° had no significant impact on droplets size distribution of brand-B, whereas, the Dv (90) of brand-A significantly affected. The repeatability of the method was assessed from the percent standard deviation of six replicate measurements and was found to be 3.2, 5.3, 9.1 and 11.1 for Dv (10), Dv (50), Dv (90) and less than 10 µm respectively. Similarly, the robustness of the method was evaluated by changing velocity and acceleration. When the velocity changed to 55 and 65 from 60 mm/s the percent difference in their Dv (10), Dv (50) and Dv (90) was found to be -4.2, -7.6 and -11.4 for 55 mm/s and 0.4, 0.2 and 0.5 for 65 mm/s. When the acceleration changed to 4500 and 5500 from 5000 mm/s2 the percent difference in their Dv (10), Dv (50) and Dv (90) was found to be -2.6, -1.7 and 0.1 for 4500 mm/s2 and -3.3, -1.7 and 0.5 for 5500 mm/s2. The results suggest that change in velocity and acceleration does not impact significantly on droplets size, thus ensures the robustness of the method. The method was applied to two commercially available nasal sprays labeled as Brand-A and Brand-B. The result has shown marginal differences in their Dv (10 and 50) but a significant difference observed in Dv (90) and Dv Ë10. The Dv (90) and Dv Ë10 of Brand-A and Brand-B was found to be 91.7; 0.8 and 66.9; 2.1µm respectively. The data presented here suggest that the developed method is precise and robust can distinguish the droplets size change in the products. Hence, this can be adopted in the pharmaceutical industries to check the characteristics of the spray products.
Keywords
Nasal spray; Fluticasone furoate; Actuation angle; Droplet size distribution
Introduction
Nasal sprays are demonstrated as a more efficient way compared to oral or injections to transport drugs with potential use in bypassing the blood-brain barrier [1]. The main nasal passage may serve as an efficient absorption surface for topically applied therapeutic agents due to the rich vascularization and large surface area proportion [2]. In particular, the olfactory region located at the uppermost of the nasal cavity is the only site in the human body where the central nervous system (CNS) is in direct contact with the environment. Intra-nasally administered drugs once deposited in the olfactory region can migrate across the olfactory mucosa and reach the CNS within minutes, resulting in quick therapeutic onset [3].
A nasal spray solution requires a majority of droplets having diameters >10 μm to localize delivery in the nose and to avoid possible undesired effects resulting from the material reaching the lung. It is therefore important, from an efficacy perspective, to ensure that the nasal spray unit primarily produces droplets >10 μm in diameter. However, droplets ˂10 μm in diameter inevitably exist in small quantity in a spray. The ability of these small droplets to advance in the trachea-bronchi system depends on their size. Therefore, it is equally important, from a safety point of view, to determine the size distribution of droplets ˂10 μm in diameter [4].
Spray device driven by propellants or hand actuated pump systems have been developed for intranasal delivery. There are several formulations are available for nasal drug delivery, of which drug formulated as an aqueous solutions or suspensions are most widely used [5]. Spray devices and drug formulations interact to produce a spray plume with unique geometric and droplets properties, and the characteristics of the resulting spray are believed to have a profound effect on the resulting nasal deposition patterns [6,7].
Various nasal spray studies adopting human nasal cavity have found that the deposition of the spray particle is influenced by nasal cavity geometry and spray parameters (such as droplets size, injected velocity) controlled by the design of nasal spray devices. The aqueous spray pump is the most dominant delivery device in the nasal drug delivery market which relies on an actuation force to atomize the drug formulation as it is discharged from the device [8].
There are several factors that attribute the drug delivery of a nasal spray device such as patient handling, physical properties of the formulation, the design of the pump and the shape of the orifice [9- 11]. Foo and co-workers [12] suggested that the spray cone angle and administration angle are critical factors for deposition efficiency, as not all spray droplets delivered by a nasal spray pump can enter the main nasal passage. Experimental visualization [13] and in-vivo deposition studies [14,15] also showed that high deposition occurred in the anterior nasal cavity because of the inertial deposition of droplets. Consequently, the fraction of droplets that penetrate the nasal valve region is low, leading to low drug utilization [12,16]. Recently, Suman and his co-researchers used gamma scintigraphy to demonstrate that sprays possessing similar velocities and plume angles gave similar deposition patterns, regardless of the specific device used [10].
Recent studies demonstrated the effect of droplets size on the deposition efficiency of the spray. Newman and his team demonstrated that a greater fraction of the total spray volume could penetrate into the ciliated region of the main nasal passage from a spray whose plume angle was 30° compared to a wider 60° spray and median droplets size (Dv 50) of ~70 μm [17]. Harris et al., studied the influence of solution with varying polymer concentration on the droplets size [18]. It is also demonstrated greater anterior deposition with larger droplets. Therefore, evaluating droplets size is paramount to understand the efficacy and toxicity of the nasal products.
A number of studies performed to understand the effect of various parameters on the formation of droplets size. For example, Inthavong et al., studied the effect of actuation pressure on spray atomization [19]. Mitchell et al., Dayal et al., Guo and Doub, Guo et al., and Liu et al., demonstrated the effect of stroke length and actuation velocity on the plume geometry and droplets size distribution of a nasal spray [11,20-23]. Kippax et al., and Doughty et al., used phase Doppler anemometry (PDA) but related the time-varying droplets size distribution to the force of actuation with human manual actuation [24,25]. In this study, an analytical method was developed and validated to assess the droplets size distribution in Fluticasone Furoate nasal spray and also evaluated the effect of different actuation angle by Malvern Spray Tech.
Results
Effect of different angles on the droplets size distribution
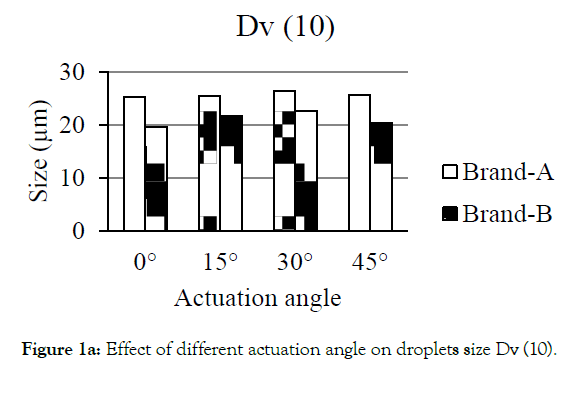
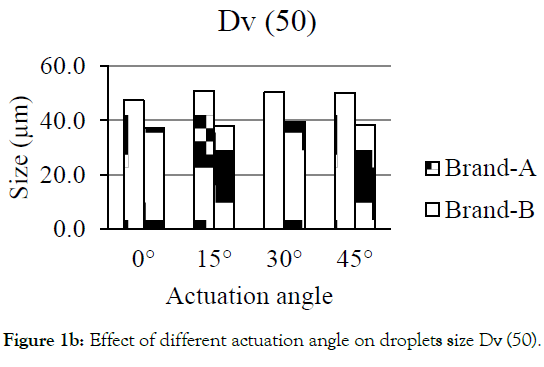
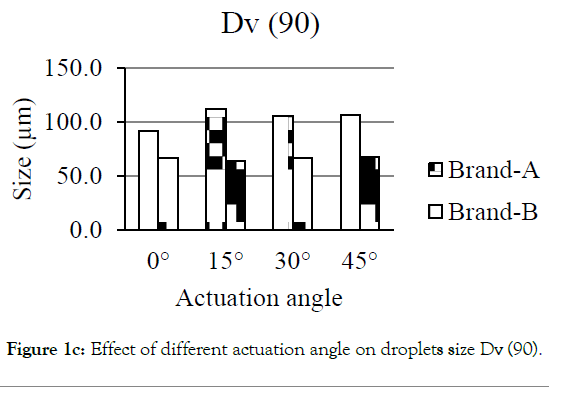
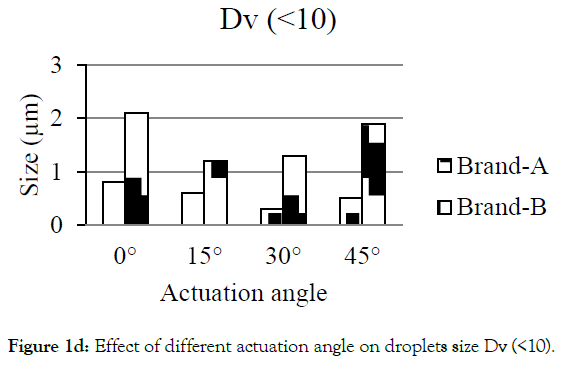
Figures 1a-1d showed the effect of different actuation angle on the formation of droplets size distribution. There was no significant change observed on the Dv (10) and Dv (50) of Brand-A and Brand-B when the actuation angle was changed from 0 ° to 15 °, 30 ° and 45 °. At 0 °, 15 °, 30 ° and 45 ° angle, 10% of the droplets was found to have a size of 25.3, 25.5, 26.4 and 25.6 μm for Brand-A and 19.6, 21.7, 22.6 and 20.4 μm for Brand-B. Similarly, 50% of the droplets were found to have the size of 47.4, 50.9, 50.4, and 50.2 μm for Brand-A and 37.3, 37.8, 39.5, and 38.4 with Brand-B. In-converse to DV (10) and Dv (50), Dv (90) had shown a significant difference in the size of the droplets when the angle changed from 0 ° to 15 °, 30 ° and 45 °. Here, the author considered as significant, when the change is greater than 10 μm in size. 90% of the population was found to have the size of 91.7, 112.5, 105.8 and 106.8 μm for Brand-A and 66.9, 64.4, 67.3 and 68.0 μm for Brand-B at 0 °, 15 °, 30 ° and 45 ° actuation angle respectively. Droplets size of mean distribution volume less than 10 percent were found to be 0.8, 0.6, 0.3 and 0.5 μm for Brand-A and 2.1, 1.2, 1.3 and 1.9 for Brand-B at 0 °, 15 °, 30 °and 45 ° respectively. Though no significant differences observed on Dv (10) and Dv (50) of Brand-A and Brand-B at various angle, certainly there was a distinct change in the Dv (90) of Brand-A. The present data suggest that this analytical method could be employed in pharmaceutical industries to distinguish the changes in the spray characteristics.
Figure 1a: Effect of different actuation angle on droplets size Dv (10).
Figure 1b: Effect of different actuation angle on droplets size Dv (50).
Figure 1c: Effect of different actuation angle on droplets size Dv (50).
Figure 1d:Effect of different actuation angle on droplets size Dv (<10)
Method validation
Repeatability: Table 1 demonstrates the repeatability of spray characterization methods.
Table 1: Repeatability of the spray characterization methods.
| Device | Dv 10 (µm) | Dv 50 (µm) | Dv 90 (µm) | Dv <10 (µm) |
|---|---|---|---|---|
| 1 | 25.9 | 52.5 | 114 | 0.8 |
| 2 | 25 | 49.2 | 98 | 0.9 |
| 3 | 25 | 47.3 | 92.1 | 1 |
| 4 | 23.8 | 46.8 | 97.1 | 0.9 |
| 5 | 25.8 | 51.8 | 105 | 0.8 |
| 6 | 25.5 | 46.8 | 89.3 | 0.7 |
| Average | 25.2 | 49.1 | 99.3 | 0.9 |
| %RSD | 3.2 | 5.3 | 9.1 | 11.1 |
The percent related standard deviation of the six replicates measurements obtained for their particle size was found to be 3.2, 5.3 and 9.1 for Dv (10), Dv (50) and Dv (90) respectively. This data suggests that the parameters optimized to measure the droplets size can measure the size precisely.
Inter-day variation: Tables 2a and 2b show the reproducibility of the results between two days. The percent difference of the six replicates measurements obtained between initial and third day for their particle size was found to be 0.8, 2.5and 3.3 for Dv (10), Dv (50) and Dv (90) respectively. This data suggests that the parameters optimized to measure the droplets size can reproduce the results within acceptable variations.
Table 2a: Droplets size distribution on initial day.
| Device | Dv 10 (µm) | Dv 50 (µm) | Dv 90 (µm) | Dv < 10 (µm) |
|---|---|---|---|---|
| 1 | 25.9 | 52.5 | 114.0 | 0.8 |
| 2 | 25.0 | 49.2 | 98.0 | 0.9 |
| 3 | 25.0 | 47.3 | 92.1 | 1.0 |
| 4 | 23.8 | 46.8 | 97.1 | 0.9 |
| 5 | 25.8 | 51.8 | 105.0 | 0.8 |
| 6 | 25.5 | 46.8 | 89.3 | 0.7 |
| Average | 25.2 | 49.1 | 99.3 | 0.9 |
Table 2b: Droplets size distribution on the third day.
| Device | Dv 10 (µm) | Dv 50 (µm) | Dv 90 (µm) | Dv <10 (µm) |
|---|---|---|---|---|
| 1 | 26.6 | 49.8 | 98.0 | 0.5 |
| 2 | 26.1 | 51.0 | 104.3 | 0.5 |
| 3 | 22.5 | 43.0 | 88.7 | 0.6 |
| 4 | 24.4 | 49.0 | 104.4 | 0.9 |
| 5 | 25.7 | 49.7 | 96.7 | 0.9 |
| 6 | 24.6 | 44.7 | 83.7 | 0.7 |
| Average | 25.0 | 47.9 | 96.0 | 0.7 |
| % Difference | 0.8 | 2.5 | 3.3 | 18.0 |
Analyst to analyst variation: Tables 3a and 3b show reproducibility of the results between two analysts. The % difference of the six replicates measurements obtained between Analyst-1 and Analyst-2 for their particle size was found to be 7.2, 3.2 and 1.0 for Dv (10), Dv (50) and Dv (90) respectively. This data suggests that the parameters optimized to measure the droplets size can reproduce the results within acceptable variations.
Table 3a: Droplets size distribution-Analyst 1.
| Device | Dv 10 (µm) | Dv 50 (µm) | Dv 90 (µm) | Dv <10 (µm) |
|---|---|---|---|---|
| 1 | 25.9 | 52.5 | 114.0 | 0.8 |
| 2 | 25.0 | 49.2 | 98.0 | 0.9 |
| 3 | 25.0 | 47.3 | 92.1 | 1.0 |
| 4 | 23.8 | 46.8 | 97.1 | 0.9 |
| 5 | 25.8 | 51.8 | 105.0 | 0.8 |
| 6 | 25.5 | 46.8 | 89.3 | 0.7 |
| Average | 25.2 | 49.1 | 99.3 | 0.9 |
Table 3b: Droplets size distribution-Analyst 2.
| Device | Dv 10 (µm) | Dv 50 (µm) | Dv 90 (µm) | Dv <10 (µm) |
|---|---|---|---|---|
| 1 | 27.0 | 50.1 | 97.4 | 0.7 |
| 2 | 28.9 | 54.0 | 105.5 | 0.0 |
| 3 | 25.7 | 49.6 | 101.5 | 0.6 |
| 4 | 25.7 | 48.9 | 100.1 | 0.5 |
| 5 | 27.6 | 53.1 | 107.2 | 0.7 |
| 6 | 27.0 | 48.2 | 89.4 | 0.0 |
| Average | 27.0 | 50.6 | 100.2 | 0.4 |
| % Difference | 7.2 | 3.2 | 1.0 | 50.0 |
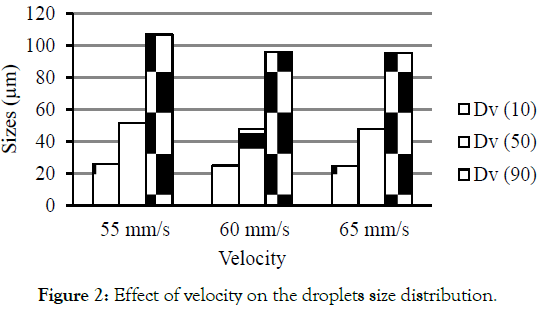
Robustness: Two parameters were studied for their effect on droplets size distribution. Figure 2 illustrates the effect of velocity on droplets size. The optimized method was having velocity at 60 mm/s. When the velocity changed to 55 and 65 mm/s the percent difference in size was found to be 4.2, 0.4, 7.6, 0.2 and 11.4, 0.5 for Dv (10), Dv (50) and Dv (90) respectively. This present data suggest that when velocity reduced to 55 mm/s or 65 mm/s there were no significant changes in their size. The percent difference was well within the acceptable criteria.
Figure 2: pharmaceutica-analytica-droplets-size.
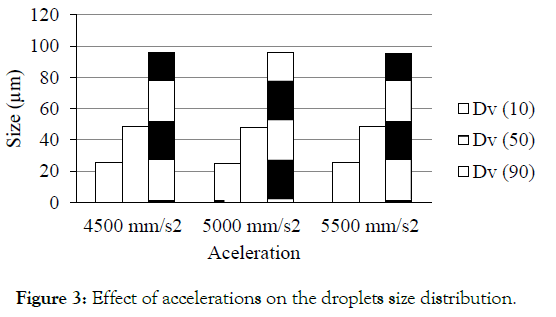
Figure 3 illustrates the effect of accelerations on droplets size. The optimized method was having acceleration at 5000 mm/s2. When the acceleration changed to 4500 and 5500 mm/s2 the percent difference in size was found to be 2.6, 3.3, 1.7, 1.7 and 0.1, 0.5 for Dv (10), Dv (50) and Dv (90) respectively. This present data suggest that when acceleration changed to 4500 mm/s2 and 4500 mm/s2 there were no significant changes observed in their droplets size. The percent difference was well within the acceptable criteria.
Figure 3: Effect of accelerations on the droplets size distribution.
Discussion
Despite the nasal sprays provide non-invasive quick therapeutic onset and have been widely applied for the treatment of various diseases, poorly designed spray nozzle or incorrect use of spray devices will significantly affect the treatment outcome. The delivery of nasal drug products may be assessed by a variety of means, however high reliance is usually placed upon in-vitro testing methodology. In-vitro bioequivalence of nasal spray is often characterized via measurement of spray view, spray angle and droplets size distribution. The FDA nasal bioavailability (BA)/ BE guidance states that droplets size distribution and span during the fully developed phase are requested [7]. In this study, we have developed and validated an analytical method for the measurement of droplets size distribution in Fluticasone nasal spray.
Results suggest that the optimized parameters can produce reliable data with acceptable variations. Hence, this method can be employed to test the spray characteristics of the nasal products in the pharmaceutical industries.
However, the current measures of in-vitro performance by droplets size distribution may not be clinically relevant due to the absence of nasal anatomy, human actuation behavior, and other operational factors.
Experimental Section
Nasal products
cause reducing crops productivity. Therefore the proper level of fertilizers and appropriate methods is required to sustain the productivity of crops and soil fertility. Different levels of Nitrogen and its application methods were used to improve the canola productivity. A field experiment was conducted at University of Agriculture, Peshawar research farm in 2015-16. Randomized complete block design in split plot arrangement was applied with four replicates. Application methods (Broadcast method, rows one side placement, rows both side placement and rows between) were allotted to mai
Instruments
Malvern Panalytical Spraytec (Malvern Panalytical Ltd., Royston, UK) and Vereo Automated Actuator (NSx), Proveris Scientific Corporation, Hudson, MA, USA).
Instrument parameters
The 300 mm lens used was capable of measuring droplets between 0.1-900 µm (Dv 50: 0.5-600 µm). The distance between the spray tip and receiving lens was adjusted to 6.0 cm. The spray devices were placed on an automatic actuation station (Vereo NSx actuator) and delivered with the force of 6.0 kg, acceleration and velocity were set as 5000 mm/s2 and 60 mm/s respectively. Data collection was initiated when the beam obscuration exceeded 7% and data were collected for 150 ms at 0° angle. The data were analyzed using Spraytec software. Percent volume diameters (Dv) defining 10%, 50% and 90% of the cumulative volume distribution of the spray droplets were determined. Initially, seven priming shots were performed on each device and then three repeated measurements were made for calculation.
Effect of different angles on the droplets size distribution
Three individual devices each from Brand-A and Brand-B was actuated at 15°, 30° and 45° angle. Other parameters were set as per details are given in materials and methods. Data collected during stable phase from triplicate measurements of each device for each angle was considered.
Method validation
Repeatability: Repeatability of the analytical method on the assessment of droplets size distribution was executed based on the optimized parameters i.e. actuation force (6.0 kg), actuation angle( 0°), data collection (150 ms), distance from the tip (6.0 cm) acceleration (5000 mm/s2) and velocity (60 mm/s). Data collected from the triplicate measurement of six individual devices of Brand-A were considered for calculation.
Intermediate precision: Two intermediate precision i.e. inter-day variation and analyst to analyst variation was performed as per parameters are given under repeatability. Data collected from the triplicate measurement of six individual devices of Brand-A were considered for calculation.
Robustness: The developed analytical method was subjected to their robustness by changing acceleration and velocity. All the parameters were set as given under repeatability except acceleration and velocity. The acceleration was changed from 5000 mm/s2 to 4500 and 5500 mm/s2. Similarly, velocity also changed from 60 mm/s to 55 and 65 mm/s. Data collected from the triplicate measurement of six individual devices of Brand-A were considered for calculation.
Discussion
Despite the nasal sprays provide non-invasive quick therapeutic onset and have been widely applied for the treatment of various diseases, poorly designed spray nozzle or incorrect use of spray devices will significantly affect the treatment outcome. The delivery of nasal drug products may be assessed by a variety of means, however high reliance is usually placed upon in-vitro testing methodology. In-vitro bioequivalence of nasal spray is often characterized via measurement of spray view, spray angle and droplets size distribution. The FDA nasal bioavailability (BA)/ BE guidance states that droplets size distribution and span during the fully developed phase are requested [7]. In this study, we have developed and validated an analytical method for the measurement of droplets size distribution in Fluticasone nasal spray.
Results suggest that the optimized parameters can produce reliable data with acceptable variations. Hence, this method can be employed to test the spray characteristics of the nasal products in the pharmaceutical industries.
However, the current measures of in-vitro performance by droplets size distribution may not be clinically relevant due to the absence of nasal anatomy, human actuation behavior, and other operational factors.
Conclusion
A highly robust, precise and reproducible spray characteristics method was developed and validated to assess the droplets size distribution of Fluticasone Furoate nasal spray. The developed method demonstrated the ability to identify the changes in the droplets size of different nasal sprays. Thus, this method can be adopted in the pharmaceutical industries to evaluate the quality of the nasal sprays. In addition to that, the effect of different actuation angle on the droplets size distribution was studied. The results suggest that change in the actuation angle does not impact significantly on droplets size when compared for Dv (10) and Dv (50) but certainly makes great impact on Dv (90).
Conflicts of Interest
The authors declare that there are no conflicts of interest
Acknowledgement
The authors are grateful to the Integrated Product Development Organization (IPDO), Dr. Reddy’s Laboratories Ltd., Bachupally, Hyderabad, India for providing Spray Tech instrument facility to carry out the work.
REFERENCES
- Bleske BE, Warren EW, Rice TL, Shea MJ, Amidon G, Knight P. Comparison of intravenous and intranasal administration of epinephrine during CPR in a canine model. Ann Emerg Med. 1992;21:1125-1130.
- Djupesland PG. Nasal drug delivery devices: characteristics and performance in a clinical perspective-a review. Drug Deliv Transl Res. 2013;3:42-62.
- Hanson LR, Frey WH. Strategies for intranasal delivery of therapeutics for the prevention and treatment of neuro AIDS. J Neuroimmune Pharmacol. 2007;2:81-86.
- Yu CD, Jones RE, Henesian M. Cascade impactor method for the droplets size characterization of a metered-dose nasal spray. J Pharm Sci. 1984;73:344-348.
- Trows S, Wuchner K, Spycher R, Steckel H. Analytical challenges and regulatory requirements for nasal drug products in Europe and the US. Pharmaceutics. 2014;6:195-219.
- Vidgren MT, Kublik H. Nasal delivery systems and their effect on deposition and absorption. Adv Drug Deliv Rev.1998;29:157-177.
- US FDA, Draft Guidance on “Bioavailability and Bioequivalence Studies for Nasal Aerosols and Nasal Sprays for Local Action.” Centre for Drug Evaluation and Research (CDER), Washington DC, 2003.
- Kundoor V, Dalby RN. Assessment of nasal spray deposition pattern in a silicone human nose model using a color-based method. Pharm Res. 2010;27:30-36.
- Cheng YS, Holmes TD, Gao J, Guilmette RA, Surakitbanharn SY, Rowlings C. Characterization of nasal spray pumps and deposition pattern in a replica of the human nasal airway. J Aerosol Med. 2001;14:267-280.
- Suman JD, Laube BL, Lin TC, Brouet G, Dalby R. Validity of in-vitro tests on aqueous spray pumps as surrogates for nasal deposition. Pharm Res. 2002;19:1-6.
- Dayal P, Shaik MS, Singh M. Evaluation of different parameters that affect droplets size distribution from nasal sprays using the malvern spraytec. J Pharm Sci. 2004;93:1725-1742.
- Foo M, Cheng Y, Su W, Donovan M. The influence of spray properties on intranasal deposition. J Aerosol Med. 2007;20:495-508.
- Ting TY, Gonda I, Gipps EM. Microparticles of polyvinyl alcohol for nasal delivery. I. Generation by spray-drying and spray-desolvation. Pharm Res. 1992;9:1330-1335.
- Vecellio L, Gersem DR, Guellec LS, Reychler G, Pitance L, Pennec LD, et al. Deposition of aerosols delivered by nasal route with jet and mesh nebulizers. Int J Pharm. 2011;407:87-94.
- Suman J, Laube B, Dalby R. Comparison of nasal deposition and clearance of aerosol generated by a nebulizer and an aqueous spray pump. Pharm Res. 1999;16:1648-1652.
- Fung MC, Inthavong K, Yang W, Lappas P, Tu J. External characteristics of unsteady spray atomization from a nasal spray device. J Pharm Sci. 2013;102:1024-1035.
- Newman SP, Moren F, Clarke SW. Deposition pattern from a nasal pump spray. Rhinology. 1987;25:77-82.
- Harris AS, Svensson E, Wagner ZG, Lethagen S, Nilsson IM. Effect of viscosity on particle size, deposition, and clearance of nasal delivery systems containing desmopressin. J Pharm Sci. 1988;77:405-408.
- Inthavong K, Fung MC, Yang W, Tu J, Measurements of droplets size distribution and analysis of nasal spray atomization from different actuation pressure. J Aerosol Med Pulm Drug Deliv.2015;28:59-67.
- Mitchell JP, Nagel MW, Nichols S, Nerbrink O. Laser diffractometry as a technique for the rapid assessment of aerosol particle size from inhalers. J Aerosol Med. 2006;19:409-433.
- Guo C, Doub WH. The influence of actuation parameters on in-vitro testing of nasal spray products. J Pharm Sci. 2006;95:2029-2040.
- Guo C, Stine KJ, Kauffman JF, Doub WH. Assessment of the influence factors on in-vitro testing of nasal sprays using Box-Behnken experimental design. Eur J Pharm Sci. 2008;35:417-426.
- Liu X, Doub WH, Guo C. Evaluation of droplet velocity and size from nasal spray devices using phase doppler anemometry (PDA). Int J Pharm. 2010;388:82-87.
- Kippax PG, Krarup H, Suman D. Applications for droplet sizing: manual versus automated actuation of nasal sprays, Pharmaceutical Technology (Outsourcing Resources), August.2004;30-39.
- Doughty DV, Vibbert C, Kewalramani A, Bollinger ME, Dalby RN. Automated actuation of nasal spray products: determination and comparison of adult and paediatric settings. Drug Dev Ind Pharm. 2011;37:359-366.
Citation: Prasada Rao MR, Mogadati P, Arutla S, Senthi M (2019) Development and Validation of Robust Analytical Method to Determine Droplets Size Distribution of Nasal Spray Using Laser Diffraction Technique. Pharm Anal Acta 10:611. doi: 10.35248/2153-2435.19.10.611
Copyright: © 2019 Prasada Rao MR, et al. This is an open-access article distributed under the terms of the Creative Commons Attribution License, which permits unrestricted use, distribution, and reproduction in any medium, provided the original author and source are credited.


