Indexed In
- Open J Gate
- Genamics JournalSeek
- Academic Keys
- JournalTOCs
- The Global Impact Factor (GIF)
- China National Knowledge Infrastructure (CNKI)
- Ulrich's Periodicals Directory
- RefSeek
- Hamdard University
- EBSCO A-Z
- OCLC- WorldCat
- Publons
- Geneva Foundation for Medical Education and Research
- Euro Pub
- Google Scholar
Useful Links
Share This Page
Journal Flyer

Open Access Journals
- Agri and Aquaculture
- Biochemistry
- Bioinformatics & Systems Biology
- Business & Management
- Chemistry
- Clinical Sciences
- Engineering
- Food & Nutrition
- General Science
- Genetics & Molecular Biology
- Immunology & Microbiology
- Medical Sciences
- Neuroscience & Psychology
- Nursing & Health Care
- Pharmaceutical Sciences
Research Article - (2019) Volume 10, Issue 2
Development and Validation of HPLC Method for Estimation of Zolmitriptan in its Pharmaceutical Dosage Form
Richa I. Champaneria*, Bhavini K. Gharia, Ashish D. Mishra and Shailesh A. ShahReceived: 10-Apr-2019 Published: 29-Apr-2019, DOI: 10.35248/2153-2435.19.10.609
Abstract
A new simple, accurate and precise HPLC method have been developed and validated for estimation of Zolmitriptan in its pharmaceutical dosage form. In RP-HPLC method, a C18 column and methanol: water in the ratio of 75:25 (v/v %), pH adjusted to 3 using 10% orthophosphoric acid were used at a flow rate of 1.0 mL/min and detected at 222 nm. The retention time for zolmitriptan was found to be 3.6 min. The developed method was validated for linearity, precision, accuracy, specificity, LOD and LOQ as per ICH guidelines. Linearity was observed in the range of 10-50 μg/mL for zolmitriptan and correlation coefficient was found to be 0.9979. LOD and LOQ for Zolmitriptan were found to be 2.84 μg/mL and 8.62 μg/mL respectively. The % recovery was found to be 99.87%–101.57%. The method was applied for estimation of Zolmitriptan in its pharmaceutical dosage form. The assay result was found to be 95.98 ± 1.82 of percentage label claim of Zolmitriptan.
Keywords
Zolmitriptan (ZMT); High-performance liquid chromatography (HPLC); Pharmaceutics; Electrospray
Introduction
Zolmitriptan is a selective 5-hydroxytryptamine 1B/1D (5-HT1B/1D) receptor agonist. Several methods for the estimation of Zolmitriptan have been described in the literature which include spectrophotometric method [1-3], High-Performance Liquid Chromatography (HPLC) method [4-6], colorimetry [7], capillary chromatography [8,9], differential pulse and square wave voltammetry [10,11]. While HPLC methods were reported for the determination of zolmitriptan in human plasma using fluorescence detection, liquid chromatography-electrospray mass spectrometry [12,13], coulometric detection [14]. However, these techniques are very time consuming and required sophisticated instrumentation and not suitable for real-time analysis. Furthermore, these techniques required ion-pair and redox complexing reagents for the analysis of triptan drugs. The reported methods in the literature suffer from one or the other disadvantage such as poor sensitivity, very narrow linearity range, scrupulous control of experimental variables and the present study reports the development and validation of a liquid chromatographic method with better detection ranges in pure form and its dosage forms. An LC-MS method was developed to determine antimigraine compounds but limit of quantification was 0.3 mg/mL which is not sensitive enough for studies [15]. Literature survey reveals that there was no method reported using isocratic RP-HPLC (without using buffers) for estimation of Zolmitriptan in its Nasal spray formulation [16]. The developed method was validated for linearity, precision, accuracy, specificity, LOD and LOQ as per ICH guidelines.
Materials and Methods
Instruments
HPLC (Shimadzu, LC-10AT ), UV-Visible Spectrophotometer (Shimadzu, UV1800)
FT-IR spectrophotometer: BRUKER, Alpha, Electronic analytical balance (Shimadzu, AUX-220) were used (Figure 1).
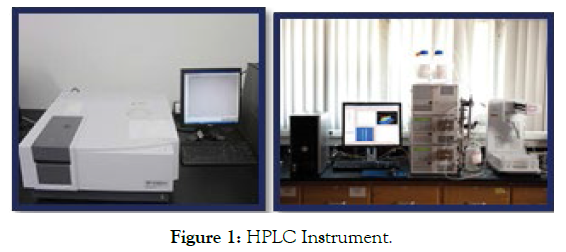
Figure 1: HPLC Instrument.
Reagents and materials
Pharmaceutical grade of Zolmitriptan was supplied as a gift sample. Methanol was used of LR grade and purchased from s.d. Fine Chem Limited, Mumbai, India. Zolmitriptan nasal spray (ZOLMIST) was procured from the local market.
Preparation of standard solutions
Preparation of stock solution of ZMT: 25 mg of Zolmitriptan was weighed and transferred in 25 mL volumetric flask and volume made up to mark with methanol (1000 µg/mL).
Preparation of working standard solution: From stock solution of ZMT, aliquot of 0.1, 0.2, 0.3, 0.4 and 0.5 mL were transferred in series of 10 mL volumetric flask and diluted up to mark with mobile phase to get the concentration range of 10, 20, 30, 40 and 50 μg/mL of ZMT.
Preparation of sample solution: Marketed formulation of ZMT (ZOLMIST) was taken and sprayed once in 10 mL volumetric flask and diluted up to mark with methanol (500 µg/mL). From above solution, aliquot of 0.6 mL was transferred and diluted up to mark with mobile phase in 10 mL volumetric flask (30 µg/mL).
Preparation of mobile phase: 75 mL of Methanol and 25 mL of double distilled water was taken and pH adjusted to 3.0 using 10% Orthophosphoric acid. Mobile phase was vacuum filtered and sonicated for 15 min three times.
Method development for mobile phase optimization: The working standard solution of ZMT were injected separately, the mobile phases were tried one by one, run time was about 20 min and detected at detection wavelength. Numbers of trials were taken by changing the ratio of mobile phase, by changing pH of mobile phase, by changing flow rate to achieve minimum tailing and reasonable Rt time (Figures 2 and 3).
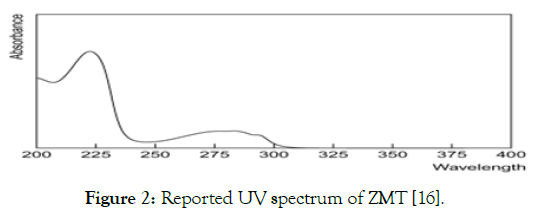
Figure 2: Reported UV spectrum of ZMT [16].
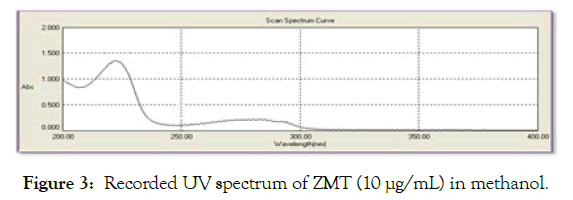
Figure 3: Recorded UV spectrum of ZMT (10 µg/mL) in methanol.
Validation of Proposed Method
Specificity: It is the ability to assess unequivocally the analyte in the presence of components which may be expected to be present. Typically these might include impurities, degradants, matrix, etc. Interference from solvents and endogenous matrix components was investigated by analyzing blank samples as well as ZMT sample by the proposed method. It can be done by measuring system suitability parameters such as plate count and tailing factors.
Linearity: The linearity range is expressed in term of correlation coefficient of linear regression analysis. The linearity range for ZMT was assessed by analysis of five independent levels of calibration curve in range of 10-50 μg/mL for ZMT (n=5). Five working standard solutions of ZMT were injected and analysed. The calibration curves were obtained by plotting graph of peak area vs. concentration.
Precision
Results were expressed as relative standard deviation (% RSD) or coefficient of variance.
Repeatability: For repeatability, 0.3 mL of stock solutions (1000 μg/mL) was transferred into 10 mL volumetric flasks and diluted up to mark with mobile phase to get 30 μg/mL of ZMT. This concentration was prepared six times. The solutions were injected in HPLC and analyzed by the proposed method. The area of the peak was measured at 222 nm wavelength and % RSD was calculated.
Intra-day precision: For Intra-day precision, working standard solutions containing 10, 20, 30, 40 and 50 μg/mL ZMT were analyzed three times on the same day and % RSD was calculated.
Inter-day precision: For Inter-day precision, working standard solutions containing 10, 20, 30, 40 and 50 μg/mL ZMT were analyzed on the three different days and % RSD was calculated.
Limit of detection and limit of quantification
LOD and LOQ were calculated from the standard deviation of intercepts and mean slope of the five calibration curves of Zolmitriptan using the formulae as given below.
LOD=3.3(SD)/S
LOQ=10(SD)/S
Where, SD=Standard deviation of the Y-intercepts of the 5 calibration curves.
S=Mean slope of the calibration curve.
Accuracy
It was determined by calculating the recovery of ZMT by standard addition method. Three numbers of 10 mL volumetric flasks were taken. To a fixed amount of preanalyzed sample (0.3 mL of 500 µg/mL of ZMT spray solution), increasing aliquots of ZMT working standard solution (0.12, 0.15 and 0.18mL of 1000 µg/mL of ZMT) were added respectively and diluted to mark with mobile phase. These solutions were filtered through Whatman filter paper individually. 20 μl of these solutions were injected in HPLC individually and area of peak obtained with each solution was measured at 222 nm for ZMT. The amount of ZMT was calculated at each level and % recoveries were computed.
Analysis of the marketed formulation
20 μl of sample solution was injected in HPLC and area of the peak was measured at 222 nm. The amount of ZMT per spray was determined with the help of calibration curve (Table 1).
Table 1: Chromatographic conditions of HPLC.
| Stationary phase | C18–Grace Smart (250 mm × 4.6 mm, 5µm) |
| Mobile phase | Methanol : Water (75: 25, v/v) |
| pH | Adjusted to 3 using 5% orthophosphoric acid |
| Flow rate | 1 ml/min |
| Temperature | 25 ± 2°C |
| Wavelength | 222nm |
| Injection volume | 20µl |
| Total run time | 15min |
Standard and sample solutions were injected in column with 25 μl micro-syringe. Methanol: Water (75:25 v/v) solution was prepared and then pH of the solution was adjusted to 3 by 5% o-phosphoric acid. The chromatogram was run for appropriate minutes with previously degassed mobile phase, Methanol: Water (75:25 v/v) at pH 3 (adjusted by 5% o-phosphoric acid), detection was carried out at wavelength 222 nm. The chromatogram was stopped after complete separation was achieved. Data related to peak like area, height, retention time, etc. were recorded using Clarity software (v2.3.0.197).
System suitability test
System suitability is performed to ensure system performance before or during the analysis of unknowns. If measurements are susceptible to variations in analytical conditions, these should be suitably controlled, or a precautionary statement should be included in the method.
Method Validation
Specificity
Chromatograms of blank and ZMT spray are shown in Figures 4 and 5 respectively. No peak at retention time of ZMT was observed. Indicating there was no interference.
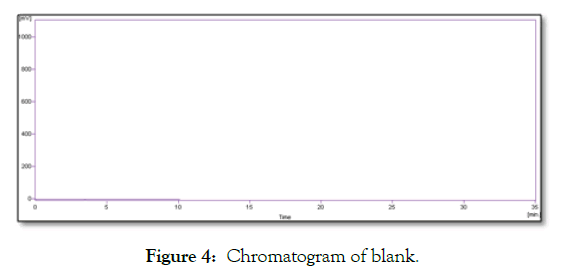
Figure 4: Chromatogram of blank.
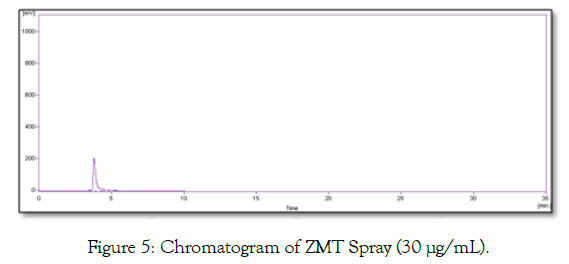
Figure 5: Chromatogram of ZMT Spray (30 µg/mL).
Linearity and Range
The linearity study was found to be in the range of 10-50 μg/mL. Linearity data are depicted in Table 2. Overlain chromatogram for five concentration of ZMT standard solution (10-50 μg/mL) in mobile phase is shown in Figure 6. Correlation co-efficient for calibration curve of ZMT was found to be 0.9979 shown in Figure 7 (Table 2).
Table 2: Linearity data for ZMT.
| Concentrations (µg/ml) | Peak area ± S.D (n=5) | % RSD |
|---|---|---|
| 10 | 1013.00 ± 10.08 | 0.99 |
| 20 | 1800.65 ± 17.16 | 0.95 |
| 30 | 2803.98 ± 6.55 | 0.23 |
| 40 | 3866.34 ± 27.54 | 0.71 |
| 50 | 4822.92 ± 23.21 | 0.48 |
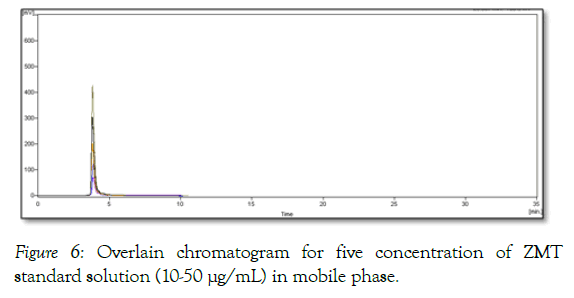
Figure 6: Overlain chromatogram for five concentration of ZMT standard solution (10-50 µg/mL) in mobile phase.
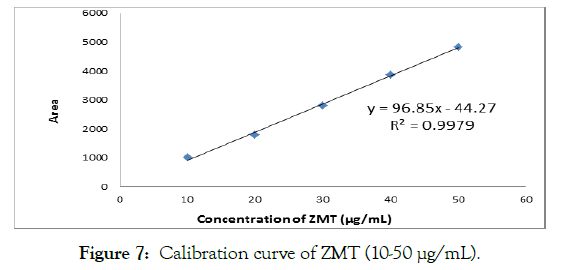
Figure 7: Calibration curve of ZMT (10-50 µg/mL).
Precision
Results were expressed as relative standard deviation (% RSD) or coefficient of variance.
Repeatability: For repeatability, 0.3 mL of stock solutions (1000 μg/mL) was transferred into 10 mL volumetric flask and diluted up to mark with mobile phase to get 30 μg/mL of ZMT. This concentration was prepared six times. The solutions were injected in HPLC and analyzed by the proposed method. The area of the peak was measured at 222 nm and % RSD was calculated. The % RSD of repeatability was found to be 0.12. The % RSD of repeatability was found to be 0.12. The repeatability data for ZMT are depicted in Table 3.
Table 3: Repeatability data for ZMT.
| Sr. no | Peak area | Mean peak area (n=7) | Standard Deviation | % Relative standard Deviation |
|---|---|---|---|---|
| 1 | 2809.74 | 2810.76 | 3.60 | 0.12 |
| 2 | 2811.23 | |||
| 3 | 2804.58 | |||
| 4 | 2815.68 | |||
| 5 | 2812.36 | |||
| 6 | 2808.47 | |||
| 7 | 2813.27 |
Intermediate precision: The developed method was found to be precise as RSD values for intermediate precision studies were less than 3%, as recommended by ICH guideline. The results of intermediate precision are given in Table 4.
Table 4: Intraday and Interday precision data for HPLC estimation of ZMT.
| Conc. (µg/ml) | Intraday precision | Interday precision | ||
|---|---|---|---|---|
| Area of peak (µV) Mean ± S.D. (n=3) |
% RSD | Area of peak (µV) Mean ± S.D. (n=3) |
% RSD | |
| 10 | 1048.59 ± 18.43 | 1.74 | 1051.93 ± 23.56 | 2.23 |
| 20 | 1861.90 ± 24.38 | 1.30 | 1855.23 ± 33.10 | 1.78 |
| 30 | 2856.51 ± 29.03 | 1.01 | 2848.84 ± 34.35 | 1.20 |
| 40 | 3848.13 ± 42.37 | 1.10 | 3843.05 ± 44.54 | 1.15 |
| 50 | 4865.66 ± 63.80 | 1.31 | 4875.56 ± 79.99 | 1.64 |
Accuracy
It was determined by calculating the recovery of ZMT by standard addition method. Three numbers of 10 mL volumetric flasks were taken. To a fixed amount of pre-analyzed sample (0.3 mL of 500 µg/mL of ZMT spray solution), increasing aliquots of ZMT working standard solution (0.12, 0.15 and 0.18 mL of 1000 µg/mL of ZMT) were added respectively and diluted to mark with mobile phase. These solutions were filtered through Whatman filter paper individually. 20 μl of these solutions were injected in HPLC individually and area of peak obtained with each solution was measured at 222 nm for ZMT. Percentage recovery for was found to be 99.87%-101.57% shown in Table 5.
Table 5: Recovery data for ZMT.
| Amount of ZMT in sample (µg) | Amount of std ZMT added (µg) | Total amount of ZMT (µg) | Spiked amount of ZMT recovered (µg) ± SD (n=3) | Mean % recovery (n=3) |
|---|---|---|---|---|
| 15 | 12 | 27 | 26.63 ± 0.57 | 100.96 |
| 15 | 15 | 30 | 29.64 ± 0.19 | 99.87 |
| 15 | 18 | 33 | 32.72 ± 0.29 | 101.57 |
LOD and LOQ
Calibration curve was repeated for five times and the Standard Deviation (S.D.) of the intercepts was calculated. The LOD was found to be 2.84 µg/ mL for ZMT. The LOQ was found to be 8.62 µg/mL for ZMT (Table 6).
Table 6: LOD and LOQ data.
| Parameter | Result |
|---|---|
| Standard deviation of the y intercept of the 5 calibration curve | 83.56 |
| Mean slope of the 5 calibration curve | 96.85 |
| LOD=3.3*(SD/slope) | 2.84 |
| LOQ=10*(SD/slope) | 8.62 |
Analysis of the marketed formulation
Marketed formulation of ZMT (ZOLMIST) was taken and sprayed once in 10 mL volumetric flask and diluted up to mark with methanol (500 µg/mL). From above solution, aliquot of 0.6 mL was transferred in 10 mL volumetric flask and diluted up to mark with mobile phase (30 µg/mL). 20 μl of sample solution was injected in HPLC and area of the peak was measured at 222nm.The concentration of drug was calculated using equation of straight line. The results obtained were compared with the corresponding labelled amount (Table 7).
Table 7: Analysis of marketed formulation of ZMT.
| Brand name | Company | Formulation | Each spray delivers (mg) | % Labelled found ± SD (n=3) |
|---|---|---|---|---|
| ZOLMIST | CIPLA | NASAL SPRAY | 5 | 95.98 ± 1.82 |
System suitability test
Parameters such as plate count, tailing factors and reproducibility (% RSD retention time and area for six repetitions) were determined and compared against the USP (Tables 8 and 9).
Table 8: Results of system suitability parameters.
| Parameters | Data obtained |
|---|---|
| Theoretical plates per meter | 2338.8 |
| Retention time (min. ± S.D) | 3.8 ± 0.03 |
| Tailing factor/symmetry factor | 1.18 |
Table 9: Summary of validation parameters.
| Sr. no. | Parameter | Result |
|---|---|---|
| 1 | Linearity Range (µg/ml) | 10-50 µg/ml |
| 2 | Correlation coefficient | 0.9979 |
| 3 | Precision (% RSD) Repeatability(n=7) Intraday precision(n=5) Interday precision(n=5) |
0.12 1.01-1.74 1.15-2.23 |
| 4 | Accuracy (% recovery) | 99.87-101.57 |
| 5 | LOD (µg/ml) | 2.84 |
| 6 | LOQ (µg/ml) | 8.62 |
Results and Discussion
In RP-HPLC method, a C18 column and methanol: water in the ratio of 75:25 (% v/v) pH adjusted to 3.0 using 10% orthophosphoric acid were used at a flow rate of 1.0 mL/min and detected at 222 nm. The retention time for zolmitriptan was found to be 3.8 min. The developed method was validated for linearity, precision, accuracy, specificity, LOD and LOQ as per ICH guidelines. Linearity was observed in the range of 10-50µg/mL for zolmitriptan and correlation coefficient was found to be 0.9977. LOD and LOQ for Zolmitriptan were found to be 2.84 µg/mL and 8.62 µg/mL respectively. The % recovery was found to be 99.87%- 101.57%.The method was applied for estimation of Zolmitriptan in its pharmaceutical dosage form. The assay result was found to be 95.98 ± 1.82 of percentage label claim of Zolmitriptan. The proposed HPLC methods are simple, accurate and reproducible for estimation of ZMT in nasal spray formulation and was validated as per ICH guidelines. Three samples of ZMT spray were determined by HPLC methods and the results were correlated. Statistical test indicate that the proposed HPLC methods reduce the duration of analysis and suitable for routine estimation of Zolmitriptan in its pharmaceutical formulation and bulk drug.
Conclusion
The proposed HPLC methods are simple, accurate and reproducible for estimation of ZMT in nasal spray formulation and was validated as per ICH guidelines. Three samples of ZMT spray were determined by HPLC methods and the results were correlated. Statistical test indicate that the proposed HPLC methods reduce the duration of analysis and suitable for routine estimation of Zolmitriptan in its pharmaceutical formulation and bulk drug.
REFERENCES
- Raghavendra Rao NG, Humaira S, Munde MR. Validated UV spectroscopic method for estimation of zolmitriptan from tablet formulations. Int J Biomed Adv Res. 2010;1:82-87.
- Garg G, Siddiqui N, Garg V. Development and validation of a simple UV method for in-vitro estimation of zolmitriptan in an intraoral dosage form. Res J Pharm Biol Chem Sci. 2013;4:649-656.
- Basavaiah K, Prashanth KN, Xavier CM, Raghu MS. Development and validation of stability-indicating UV spectrophotometric methods for the determination of zolmitriptan in pharmaceuticals. Int J Pharm Chem Sci. 2013;2:236-245.
- Chen J, Jiang X, Jiang W, Mei N, Gao X, Zhang Q. High-performance liquid chromatographic analysis of zolmitriptan in human plasma using fluorescence detection. J Pharm Biomed Anal. 2004;35:639-645.
- Rao BM, Srinivasu MK, Sridhar G, Kumar PR, Chandrasekhar KB, Islam A. A stability indicating LC method for zolmitriptan. J Pharm Biomed Anal. 2005;39:503-509.
- Srinivasu MK, Rao BM, Sridhar G, Kumar PR, Chandrasekhar KB, Islam A. A validated chiral LC method for the determination of zolmitriptan and its potential impurities. J Pharm Biomed Anal. 2005;37:453-460.
- Safwan A, Mahmoud B, Mouhamed K. Colorimetric determination of zolmitriptan in pure form and in pharmaceutical preparations. Aleppo University. 2006;53-61.
- Wang H, Zhu Y, Lin J, Yan X. Fabrication of molecularly imprinted hybrid monolithsviaa room temperature ionic liquid-mediated nonhydrolytic sol-gel route for chiral separation of zolmitriptan by capillary electrochromatography. Electrophoresis. 2008;29:952-959.
- http://en.cnki.com.cn/Article_en/CJFDTOTAL YWFX200206005.htm
- El-Shal MA, Attia AK. Adsorptive stripping voltammetric behavior and determination of zolmitriptan using differential pulse and square wave voltammetry. Anal Bioanal Electrochem. 2013;5:32-45.
- Safwan A, Mahmoud B, Mouhamed K. Colorimetric determination of zolmitriptan in pure form and in pharmaceutical preparations. Aleppo University. 2006;53-61.
- Chen X, Liu D, Luan Y, Jin F, Zhong D. Determination of zolmitriptan in human plasma by liquid chromatography-tandem mass spectrometry method: Application to a pharmacokinetic study. J Chromatogr B. 2006;832:30-35.
- Zhang Z, Xu F, Tian Y, Li W, Mao G. Quantification of zolmitriptan in plasma by high-performance liquid chromatography-electrospray ionization mass spectrometry. J Chromatogr B. 2004;813:227-233.
- Clement EM, Franklin M. Simultaneous measurement of zolmitriptan and its major metabolites N-desmethyl zolmitriptan and zolmitriptan N-oxide in human plasma by high-performance liquid chromatography with coulometric detection. J Chromatogr B. 2002;766:339-343.
- Annapurna MM, Nanda B. Validated RP-HPLC method for the determination of zolmitriptan-A serotonin 5-HT receptor agonist. J Pharm Nutr Sci. 2011; 1: 9-14.
- Moffat AC, Osselton MD, Widdop B. Clarke's analysis of drugs and poisons. 3rd edition, London. UK: Pharmaceutical press; 2005:1716.
Citation: Champaneria RI, Gharia BK, Mishra AD, Shah AS (2019) Applications, Model Study and Commercial Utilization (Patents) of Ophthalmic Route as Drug Delivery Site. Pharm Anal Acta 10:609.
Copyright: © 2019 Champaneria RI, et al. This is an open-access article distributed under the terms of the Creative Commons Attribution License, which permits unrestricted use, distribution, and reproduction in any medium, provided the original author and source are credited.


