

Indexed In
- Open J Gate
- Genamics JournalSeek
- Academic Keys
- JournalTOCs
- ResearchBible
- China National Knowledge Infrastructure (CNKI)
- Scimago
- Ulrich's Periodicals Directory
- Electronic Journals Library
- RefSeek
- Hamdard University
- EBSCO A-Z
- OCLC- WorldCat
- SWB online catalog
- Virtual Library of Biology (vifabio)
- Publons
- MIAR
- Scientific Indexing Services (SIS)
- Euro Pub
- Google Scholar
Useful Links
Share This Page
Journal Flyer
Open Access Journals
- Agri and Aquaculture
- Biochemistry
- Bioinformatics & Systems Biology
- Business & Management
- Chemistry
- Clinical Sciences
- Engineering
- Food & Nutrition
- General Science
- Genetics & Molecular Biology
- Immunology & Microbiology
- Medical Sciences
- Neuroscience & Psychology
- Nursing & Health Care
- Pharmaceutical Sciences
Research Article - (2021) Volume 12, Issue 6
Comparison of Si Nanoparticle types for use as a Potencial Drug Delivery System for Central Nervous System Diseases
E. Podkorytov1*, M. Stastny2, M. Chvojkova1, L. Cejkova1, OH Asnaz3, J. Benedikt3, M. Muller4, P. Galář4, K. Valeš1 and K. Herynkova42Institute of Inorganic Chemistry of the Czech Academy of Sciences, 25068 Husinec-ReZ, Czech Republic
3Institute of Experimental and Applied Physics, Experimental Plasma Physics, Christian-Albrechts- Universität zu Kiel, Germany
4Department of Thin Films and Nanostructures, Institute of Physics, Academy of Sciences of the Czech Republic, Czech Republic
Received: 02-Jun-2021 Published: 22-Jun-2021, DOI: 10.35248/2157-7439.21.12.567
Abstract
Diseases affecting the central nervous systém (CNS) are considered to be some of the most debilitating conditions worldwide. The range of standard therapies for disorders affecting CNS is largely limited for many patients. Nonetheless, nanoparticle-based drug delivery offers itself to be a promising strategy for effective drug delivery into the brain, addressing the frequently arising complications with blood-brain barrier crossing.
This study compared the drug adsorption ability and the surface chemistry of two types of silicon nanoparticles (Si-NPs). Si- NPs were prepared using two methods: electrochemical etching of Si wafers (Si-E) and low-pressure plasma synthesis (Si-P). Silicon nanoparticles were characterized by X-ray photoelectron spectroscopy (XPS), X-ray diffraction (XRD) and nitrogen physisorption (method of Barrett, Joyner, and Halenda (BJH) and method of Brunauer, Emmett and Teller (BET)). The size and morphology were characterized by high-resolution transmission electron microscopy (HRTEM) linked with energy-dispersive X-ray spectroscopy (EDAX) and dynamic light scattering (DLS), respectively. The concentration of the drug substance that was captured by the silicon-based drug delivery system was determined by ultra high-performance liquid-chromatography-diode-array (UHPLC-DAD) method. Results of XPS showed that the Si-E are more oxidized than Si-P. The BET analysis showed us that the Si-E have more surface area, pore volume and grain size then the Si-P, and Si-P have a bigger pore size than Si-E. We also demonstrated by XRD that silicon nanoparticles prepared by both methods have a crystalline structure. The Si-P adsorption analysis of the model compound (ferulic acid) showed better adsorption ability than Si-E. The size of the Si-P (40- 120 nm) was also measured by HRTEM.
Keywords
Silicon Nanoparticles; Ferulic acid; Drug delivery
Introduction
Silicon nanoparticles (Si-NPs) are very promising not only in optoelectronic materials, but also in biology and medicine. The in vivo use of nanomaterials as therapeutic and diagnostic agents is of intense interest owing to the unique properties, such as the sizeable specific capacity for drug loading [1], strong superparamagnetism [2], efficient photoluminescence [3,4] or distinctive Raman signatures [5], among others. Materials sized between 20–200 nm can avoid renal filtration, leading to prolonged time in the blood-stream. This property enables more effective targeting of diseased tissues [6] and can easily penetrate blood vessels and even the blood-brain barrier.
In biology, the use of Si-NPs has been considered for various purposes – as fluorescent labels, biological sensors, drug delivery systems or scaffold for multiple tissues. The main advantages of Si-NPs are low cytotoxicity, easy functionalization [7], efficient photoluminescence and biodegradability [8].
Providing a controlled and localized release of therapeutics within the body is a primary objective to achieve an increased efficacy and risk reduction of potential side effects. The low toxicity of porous Si and porous SiO2, the high porosity, and feasible surface chemistry have spurred interest in using this system as a host, or “mother ship” for therapeutics, diagnostics, or other types of payloads. Various approaches to load a molecular cargo into a porous Si host have been explored, and they can be grouped into the following categories: covalent attachment, physical trapping and adsorption [8].
Si-NPs demonstrated the promising potential for simultaneous multi-drug delivery of both hydrophobic and hydrophilic compounds [9]. Moreover, in body fluids, Si-NPs are metabolized into non-toxic silicic acid and rapidly excreted through the urine [10].
In the case of CNS conditions the site of action for most of the drugs is in the brain; they must cross several barriers to reach the brain tissue, and the blood-brain barrier (BBB) is the final filter for the penetration of drugs that require CNS activity. The BBB is a structure with a complex cellular organization that isolates the brain parenchyma from the systemic circulation. It comprises brain capillaries that back endothelial cells and is encompassed by astrocytic end-foot forms. The BBB also acts as a metabolic barrier due to the presence of numerous enzymes. These enzymes can either metabolize potentially harmful drugs to CNS-inactive compounds, convert inactive drugs to their active CNS metabolites or degrade them into metabolites or substrates of specific efflux transporters [3-5]. Novel nanotechnology strategies are to enhance brain drug delivery, including the use of organic (lipid or polymerbased) or inorganic (gold, silica, carbon) nanoparticles [11].
Maserini et al. [11] said that silica NPs had been shown to reach the brain and accumulate in neurons even in the absence of any specific functionalization, with a mechanism that is still largely unknown. Nonetheless, several studies show the possibilities for penetration of the BBB with silica nanoparticles modified with different substances [12-17].
This work compares two types of silicon nanoparticles prepared by two different methods, with the primary goal to compare their surface properties, choose the best kind of Si-NPs and analyze the drug adsorption ability.
Materials and Methods
Preparation of silicon nanoparticles
Silicon nanoparticles prepared by electrochemical etching: The first type of Si-NPs was prepared according to Herynkova et al. [7] by standard anodic electrochemical etching of a p-type {100} silicon wafer (boron doping, resistivity 0.06 to 0.1 Ω cm) in a 1:3 aqueous- HF (49 %, Sigma) solution in ethanol (absolute, Sigma) for 2 hours at a current density of 1.6 mA/cm2. Porous silicon layers were then mechanically scraped from the etched wafers.
Silicon nanoparticles prepared by electrochemical etching: The first type of Si-NPs was prepared according to Herynkova et al. [7] by standard anodic electrochemical etching of a p-type {100} silicon wafer (boron doping, resistivity 0.06 to 0.1 Ω cm) in a 1:3 aqueous- HF (49 %, Sigma) solution in ethanol (absolute, Sigma) for 2 hours at a current density of 1.6 mA/cm2. Porous silicon layers were then mechanically scraped from the etched wafers.
Silicon nanoparticles prepared by low-pressure plasma synthesis: The second type of Si-NPs was prepared according to Lopez et al. [18] by low-pressure plasma synthesis using silane (SiH4) as a precursor in a non-thermal capacitively coupled plasma reactor with two cylindrical rf-driven (frequency 13.56 MHz) electrodes positioned 9 cm apart around 22 mm inner diameter glass tube. The reactor’s design is based on the system as developed by Kortshagen and Mangolini [19,20]. The synthesis was carried out under these conditions: pressure 300 Pa, total flow rate 90 sccm, 1.37 volume % of SiH4 in Ar, generator power 100 W, length of plasma in the tube approximately 10 cm. The prepared nanoparticles were thermally treated for 40 min in a laboratory oven under humid air conditions at 200 °C to produce OH groups on the surface of the nanoparticles.
Stabilization of silicon nanoparticles in liquids: Once the nanoparticles are produced and purified to a satisfactory level it is often necessary to introduce surface modifications. The surface modifications can be to passivate a very reactive nanoparticle, stabilizing a very aggregative nanoparticle in a medium (solvent or a polymer melt) where the nanoparticles are dispersed, functionalizing the nanoparticle for applications such as molecular recognition, or promoting the assembly of nanoparticles. Most commonly used surface modification methods include grafting thiolated surfactants or polymers, adsorption of charged surfactants, charged ligands or polymer brushes, attachment of biological molecules such as DNA, peptides, proteins, antigens, streptavidin or coating a continuous polymer film on nanoparticles [21]. In our case we need to achieve a high positive zeta potential of single nanoparticles to prevent their substantial agregation (>100 nm), and modify the surface of nanoparticles for further applications. The simplest way to accomplish both is to modify each nanoparticle with ((3 - Aminopropyl) triethoxysilane) APTES (Sigma) by making a Si-O-Si covalent bond between the nanoparticle and APTES (Figure 1).

Figure 1: Chemical structure of APTES.
Instruments and Procedures
Xray Photoelectron Spectroscopy (XPS): XPS was performed on an Omicron Nanotechnology machine (Germany) using monochromatized Al lamp radiation of 1486.7 eV as a primary radiation source. In CAE (constant analyzer energy) mode, measurement was performer. Calibration of intensities was based on previous copper measurements and copper-derived calibration constants‘ spectra. The Casa XPS software was used to evaluate the ranges. After calibration, the peak area and the values of the relative cross-sections were used to determine the element concentrations.
Nitrogen physisorption (BJH and BET): The surface area and porosity measurements were carried out on a NOVA 4200e Quantachrome instrument (Germany) at −196°C. The Bet method determined specific surface area values and the pore size distributions were investigated using the BJH method. Before measurement, the Si-P sample was outgassed in a vacuum for 3 hours at 80°C, and Si-E was outgassed in a vacuum for 5 hours at 80°C; analysis time was set to 128 min.
The model compound
The researchers in the field of CNS disorders have paid significant attention to the role of antioxidants in the treatement of neurodegenerative conditions. Nevertheless, as real antagonistic effects are related to engineered antioxidants, this work has been centred on common items such as phenolic antioxidants. A classic example of a phenolic antioxidant is ferulic acid. To investigate the drug encapsulation ability of both types of Si-NPs we used ferulic acid (FA) (Figure 2).

Figure 2: Chemical structure of ferulic acid.
Drug adsorption analyses (UHPLC): The batch technique was used for the rapid determination of the adsorption capacity of both materials. In a typical experiment, both types of Si-NPs were dissolved in methanol (99,8 %, Sigma) with ferulic acid. The concentration of ferulic acid in each sample was 2 mg∙ml-1. The concentration of Si-NPs was 1 mg∙ml-1 for each sample. Samples with different FA concentrations in methanol (100, 200, 300, 400, 600, 800, and 1000 μg∙ml-1) were prepared to construct the adsorption isotherms while maintaining the dose of Si-NPs (2 mg∙ml-1). The samples were shaken for 24 hours in glass test tubes on a horizontal shaker with a 250 rpm speed. After shaking, reaction mixtures were allowed to stand 48 hours for equilibration between liquid and solid phases. Centrifugation (18000 rpm, 2.5 minutes) separated the liquid phase to determine the FA concentration with HPLC measurements. The adsorption isotherms were plotted as the dependence of equilibrated concentrations of FA adsorbed onto Si-NPs against equilibrated concentrations in the liquid phase.
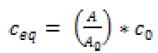
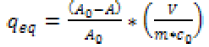
The equilibrium concentration of FA in the liquid phase ceq(μg∙ml-1) and solid phase qeq (μg∙mg-1) were calculated using the Equations (1) and (2):
 (1)
(1)
and
 (2)
(2)
where m is the mass of Si-NPs (g), V is the volume of the liquid phase (L), A0 and A are values of peak area of the solution before and after equilibrating (mAU*min), and c0 is the initial concentration of FA in the solution (μg·ml-1).
The adsorption equilibrium data were fitted by the Freundlich and Langmuir adsorption isotherms using Origin Pro 9.0 software.
Freundlich isotherm is an empirical equation describing the adsorption processes that occur on heterogonous surfaces [21].
The Freundlich model shows in equation (3).
 (3)
(3)
qeq is the equilibrium concentration of FA onto Si-NPs, Kf and n are the Freundlich constants related to the adsorption capacity and adsorption intensity.
The Langmuir models the surface of the adsorbent as inert with a finite number of adsorption centres that are all the same, and the heat of adsorption that is released during adsorption is not dependent on the amount of adsorption [22].
This model can derive equation (4).
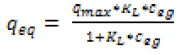 (4)
(4)
qmax(μg∙mg-1) is the maximum adsorption capacity, and KL is a constant related to the affinity of the binding sites.
The HPLC system with a diode array detector (DAD) Dionex UltiMate 3000 (Thermo Scientific ™, Palo Alto, USA) monitors and identifies ferulic acid. Chromatographic analysis was carried out in a reverse phase system (RPLC-C18) on AcclaimTM120 Å column, 5 μm, C18, 250 x 4.6 mm. For gradient elution, mobile phase methanol (MeOH)/water (H2O) acidified with formic acid (HCOOH, 0.1 %) was used. The gradient was set as follows: -1.5 min → 0 min: Column equilibration (30 % MeOH-HCOOH (0.1 %) / 70 % H2O-HCOOH (0.1 %); 0 min → 9 min: 30 % MeOH-HCOOH (0.1 %) / 70 % H2O-HCOOH (0.1 %) → 75 % MetOH-HCOOH (0.1 %) /25 % H2O-HCOOH (0.1 %); 9 min → 15 min: 75 % MeOH-HCOOH (0.1 %) /25 % H2O-HCOOH (0.1 %) → 95 % MetOH-HCOOH (0.1 %) /5 % H2O-HCOOH (0.1 %). The flow rate of the mobile phase was set to 1.0 ml·min-1 in the entire gradient, 30 °C column temperature, and 5 μl volume injection. Data were collected at a set wavelength of 310 nm. Data collection and evaluation was performed using the Chromeleon Chromatography Data System (CDS) software (Thermo Scientific).
Fourier-transform infrared spectroscopy (FT-IR): The FT-IR spectra were registered utilizing a Bruker VERTEX 80v FT-IR (Germany). Before the measurement, the sample was prepared by mixing silicon nanoparticles with ferulic acid (Sigma, ≥98.0 %) in methanol (Sigma, anhydrous, 99.8 %). The mixture was left stirring for 24 hours. Subsequently, a few droplets of the sample were dripped on the silicon wafer, heated and evaporated with the heat gun and tested by FT-IR. The measured transmittance (%) of samples was then transformed into absorbance (a.u.) according to the following equation:
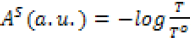 , where AS is the absorbance of a material, T is the radiant flux transmitted by that material and T ois the radiant flux received by that material [23].
X-ray powder diffraction (XRD): Powder X-ray diffraction (XRD) patterns were obtained using Bruker D2 diffractometer equipped with a conventional X-ray tube (Cu Kα radiation, 30 kV, 10 mA) and the LYNXEYE 1 - dimensional detector. The primary divergence slit module width 0.6 mm, Soler Module 2.5, Airscatter screen module 2 mm, Ni Kbeta-filter 0.5 mm, step 0.00405°, and time per step 0.3 s were used. The qualitative analysis was performed using a DiffracPlus Eva software package (Bruker AXS, Germany) using a JCPDS PDF-2 database.
Dynamic light scattering (DLS): To access the (hydrodynamic) size of Si-NPs, dynamic light scattering (DLS) in colloidal suspensions was applied using a Malvern Nano S Zetasizer (Germany) also equipped with a zeta-potential module. The dynamic nanocluster sizes and their zeta-potential were calculated by Zetasizer software.
High-resolution transmission electron microscopy (HRTEM): The morphology of the Si-NPs was inspected by high-resolution transmission electron microscopy (HRTEM) using a 200 kV TEM microscope FEI Talos F200X, which combines high-resolution S/TEM with energy dispersive x-ray spectroscopy (EDS) signal detection, and 3D chemical characterization with compositional mapping. As specimen support for TEM investigations, a microscopic copper grid was used.
Results
X-ray Photoelectron Spectroscopy (XPS)
To compare the surface of both samples of Si-NPs, the chemical bonding status of silicon was determined using X-ray Photoelectron spectroscopy (XPS).
As the spectra show (Figure S1a, b), there is a considerable difference between the samples, mainly in the oxygen content, i.e., silica.
The Si2p spectrum of the silicon nanoparticles prepared by electrochemical etching (Si-E) shown in (Figure S2a) displays four fitted peaks at 100.6, 101.9, 103.5 eV, and 104.9 eV, which were attributed to the combination of Si-Si-N, Si-N, Si-O, and Si-O-Si groups, respectively [24-26].
The existence of a strong peak for the Si-O bond (18.7 %) in the Si2p spectrum indicates the presence of silica residues on the surface layer.
On the other hand, the Si2p spectrum shown in (Figure S2b) of the silicon nanoparticles prepared by low-pressure plasma synthesis (Si- P) displays four fitted peaks at 95.7, 96.9, 98.4, and 99.7 eV, which can be attributed to the elemental silicon (Si0) [27,28].
In conclusion, we confirmed the presence of SiO2 at the surface of Si-NPs prepared by electrochemical etching as Herynková et al. [8] previously described by Fourier-transform infrared spectroscopy (FTIR). Insets show the fitting results from the XPS measurements.
Nitrogen physisorption (BJH and BET)
Surface area and porosimetric analysis were carried out on both types of Si-NPs. As we can see from (Table 2), the pores of the Si-NPs prepared by electrochemical etching are significantly larger than the Si-NPs prepared by low-pressure plasma synthesis. This is due to the partial destruction of the porous skeleton achieved by scraping the porous surface of the silicon wafer with a regular scalpel. Adsorption measurements of Si-NPs prepared by electrochemical etching can be classified as type IV isotherm with an H1 type hysteresis loop. This adsorption behaviour is attributed to spherical agglomerates of mesoporous materials with a narrow pores‘ distribution [36]. From BET analysis, a specific surface area of 556 m2 ∙ g-1 was obtained. Moreover, the BJH method reveals a narrow pores size distribution around an 8 nm radius.
The adsorption measurement of Si-NPs prepared by low-pressure plasma synthesis showed a type I isotherm with an H4 type hysteresis loop related to a microporous material [36]. The BET analysis estimated a lower specific surface area equal to 66 m2 ∙ g-1 and a pores size distribution around 12-13 nm radius. (Table 2) lists data of the surface area, pore-volume, average pore size and mean particle size of Si-NPs prepared by electrochemical etching (Si-E) and low-pressure plasma synthesis (Si-P).
Drug adsorption analyses (HPLC and FT-IR)
The FA adsorption results of both types of Si-NPs showed that Si- NPs prepared by low-pressure plasma synthesis have a better ability to adsorb than Si-NPs prepared by electrochemical etching. The residual FA concentrations were 1900 ± 0.01 μg/ml and 1500 ± 0.01 μg/ml, respectively, after 24 h of adsorption.
The different adsorption capacity is given by the size of the pores, as shown in Table 1. It corresponds to the fact that Si-NPs prepared by low-pressure plasma synthesis have a bigger pore size than Si-NPs prepared by electrochemical etching [29].
For these reasons, the adsorption isotherms were measured only for Si-NPs prepared by the low-pressure plasma synthesis method. The isotherms‘ constants and the correlation coefficients (R2) with the experimental data are listed in Table 3.
Figure 3 shows the adsorption isotherms for FA. The results show good agreement for the Langmuir isotherm model. The maximum adsorption capacity qmax for Si-NPs prepared by low-pressure plasma synthesis was calculated as 20.5 μg∙mg-1.
As observed in Table 3, the n value ~ 4.1 from the Freundlich model indicates that the affinity between the adsorbate and adsorbent is high. In other words, FA is well adsorbed by the Si-NPs surface. However, the fit with the Langmuir isotherm is much better (R2 = 0.9954), than the Freundlich isotherm (R2 = 0.9490). In addition, the good fit of the experimental data with the Langmuir isotherm is an indicator of mono-layer coverage of FA on the Si-NPs surface, which contains only one type of binding site [28].

Figure 3: Adsorption isotherms of FA on Si-NPS prepared by low-pressure plasma synthesis. The inset shows the calibration curve.
| Silicon nanoparticles prepared by electrochemical etching | Silicon nanoparticles prepared by low-pressure plasma synthesis | ||||
|---|---|---|---|---|---|
| Name | Position | At % | Name | Position | At % |
| C 1s | 284.62 | 26.31 | C 1s | 281.20 | 18.19 |
| O 1s | 533.02 | 25.66 | O 1s | 530.00 | 5.09 |
| Si 2p | 101.02 | 48.03 | Si 2p | 149.20 | 76.72 |
Table 1: Overview spectrum of both samples in the state after dedusting with Ar ions.The atomic percentage of O2 of Si-E is significantly larger than that of Si-P. On the surface of the Si-E we can see more O and C atoms than on the surface of Si-P. Consequently, there are more Si atoms on the surface of Si-P than on the surface of Si-E.
| Sample | Surface area (m2∙g-1) |
Pore volume (cm3∙g-1) |
Average pore size (nm) |
Grain size (nm) (XRD – Scherrer equation) |
|---|---|---|---|---|
| Si-E | 556 | 1.2 | 8.3 | 40.8 |
| Si-P | 66 | 0.2 | 12.9 | 20.2 |
Table 2: Surface and porosity measurements of Si-NPs prepared by electrochemical etching (Si-E) and low-pressure plasma synthesis (Si-P). The surface area, pore volume and grain size of Si-E are bigger than Si-P. The average pore size of Si-P is significantly larger than that of Si-E.
| Isotherm model | Parameters | ||
|---|---|---|---|
| KF | n | R2±SEE* | |
| Freundlich | 4.540 | 4.13 | 0.9490 ± 0.002 |
| qmax(µg∙mg-1) | KL | R2 ± SEE* | |
| Langmuir | 20.45 | 0.037 | 0.9954 ± 0.001 |
Table 3: Langmuir and Freundlich isotherm model parameters and correlation coefficients for adsorption of FA on Si-NPs prepared by low-pressure plasma synthesis. (SEE – Standard Error of Estimate). The maximum adsorption capacity qmax of FA for Si-NPs prepared by low-pressure plasma synthesis was calculated as 20.5 μg∙mg-1.
It is generally assumed that FA binding with silica surface is realized via phenolic hydroxyl group, confirmed by the quantum chemical calculations [30]. According to Bimbo et al. [31], the loading degree of drugs in the mesopores of Si-NPs depends mainly on the interactions of the drug compound and the Si-NPs matrix. At the appropriate pH, Si-NPs spontaneously adsorb positively charged molecules.
As we can see from our FTIR measurement (Figure 4) of FA in methanol separately from FA with Si-P in methanol there are no new significant bonds on the surface of nanoparticles that could provide us with information about chemical bonds between Si-P and FA. So, we hypothesised that FA can be adsorbed on the surface of SiNPs by Van Der Waals forces and be hidden in the pores of Si-P.

Figure 4: FTIR of mixture of Si-NPs prepared by low-pressure plasma synthesis (Si-P) and ferulic acid.
X-ray powder diffraction (XRD)
Powder X-ray diffraction (XRD) was done to determine the material structure.
Figure 5 shows the XRD patterns of synthesized silicon nanoparticles (Si-NPs) prepared by electrochemical etching and by low-pressure plasma synthesis.

Figure 5: XRD patterns of Si-NPs prepared by electrochemical etching (Si- E) and low-pressure plasma synthesis (Si-P).
As observed in Figure 5, there are differences between the intensities of the synthesized nanomaterials, which indicates a different size of crystallites. While Si-NPs prepared by electrochemical etching (Si-E) show higher line intensities, the case of Si-NPs prepared by low-pressure plasma synthesis (Si-P) shows lower intensities. The resulting diffractograms show that the prepared nanoparticles have a crystalline structure with an amorphous surface, which resulted in a background increase. The XRD patterns of both nanomaterials showed the characteristic peaks at 2θ = 28.45°, 47.31°,56.14°, 69.15°, 76.40°, and 88.1°, corresponding to the crystal planes of (111), (220), (311), (400), (331), and (422), respectively, which can be assigned to the cubic Silicon (Si, JCPDS card No. 00-077-2109; Fd-3m space group).
The crystallite sizes (see Table 2) were calculated from diffraction line broadening using the Scherrer formula [32]:
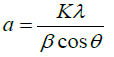
where K is the shape factor, λ is the wavelength of the applied radiation, β is the broadening of the diffraction line, and θ is the diffraction angle.
Dynamic light scattering (DLS) and high-resolution transmission electron microscopy (HRTEM)
For the stabilization and modification of the surface of Si-NPs with amino groups, we used APTES ((3-Aminopropyl) triethoxysilane) (Sigma). Stabilization and modification of silicon or silica nanoparticles with APTES is used widely in numerous publications [33-36].
We compared the stabilization of Si-NPs with different concentrations ofAPTES by DLS and confirmed the results by HRTEM.
As indicated by the DLS measurements (Figure 6) the hydrodynamic diameters with different concentrations of APTES have almost the same value: from 25 to 180 nm. Nonetheless, HRTEM measurements shows us that the actual size of the nanoparticles is around 20 nm and less. So, Si-P with s diameter of more than ~ 25 nm are agglomerated because of the large amount of APTES.

Figure 6: Hydrodynamic diameters (left) and HRTEM mesurements (middle, right) of the Si-NPs prepared by low-pressure plasma synthesis in the solution of methanol with different concentrations of APTES.
Figure 7 shows we can clearly observed the EDS HRTEM measurement of nanoparticles and the surrounding material and the presence of silicon in round particles with diameters of 20 nm and less. The oxygen is mainly located in the surrounding material because it is an integral part of APTES and methanol.

Figure 7: EDS HRTEM measurement of the Si-NPs prepared by low-pressure plasma synthesis in the solution of methanol with APTES.
Conclusions
In the present study, we applied two different strategies to create Si-NPs: electrochemical etching of the silicon wafer and low-pressure plasma synthesis. Many investigators prioritise chemical methods due to their high precision in size distribution and surface modification [37-39]. We decided to use manual methods, because they are less related to medicine and are more challenging for biological applications. We chose the low-pressure plasma synthesis to prepare nanoparticles for attaching FA on their surface for the following reasons: (1) this method allows us to prepare a much more significant amount of silicon nanoparticles than by electrochemical etching, and (2) low-pressure plasma synthesis is cheaper and safer than electrochemical etching method.
We investigated elemental compositions (XPS) on the surface of Si-NPs and demonstrated that Si-E has much more OH groups for further biological modification, namely the atomic percentage of O2 of Si-E is significantly larger than that of Si-P (25.66 vs. 5.09 At %, respectively). Subsequently, we used nitrogen physisorption (BJH and BET) for pore size determining and comparison and found that the Si-E have more surface area (556 m2·g-1 vs. 66 m2·g- 1), pore volume (1.2 cm3·g-1 vs. 0.2 cm3·g-1) and grain size than the Si-P (40.8 nm vs. 20.2 nm), and Si-P have significantly larger pore size than Si-E. The drug adsorption ability of Si-P was measured, and it was identified that the maximum adsorption capacity qmax for Si-NPs prepared by low-pressure plasma synthesis was calculated as 20.5 μg∙mg-1. We also measured DLS, XRD and TEM and the measured spherical nanoparticles have crystalline structure and sizes from 20 to 120 nm in diameter.
Acknowledgements
The authors would like to express gratitude to Mgr. Jakub Tolasz fromthe Institute of Inorganic Chemistry of the Czech Academy of Sciences, 25068 Husinec-ReZ, Czech Republic, for HRTEM measurements. We would also like to thank David Kačer, Franko Muhametaj and Daniel Bermejo Rodriguez for their help with experiments on rats.
This work was supported by the European Regional Development Fund project “PharmaBrain” CZ.02.1.01/0.0/0.0/16_025/0007 444 and the project “Sustainability for the National Institute of Mental Health”, grant number LO1611, with the financial support from the Ministry of Education, Youth and Sports of the Czech Republic.
REFERENCES
- Gao X H, Cui Y Y, Levenson R M, Chung L W K, Nie S M. In vivo cancer targeting and imaging with semiconductor quantum dots. Nature Biotech. 2004;22:969–976.
- Lee J. H. Artificially engineered magnetic nanoparticles for ultra-sensitive molecular imaging. Nature Med. 2007;13, 95–99.
- Gao X H, Cui Y Y, Levenson R M, Chung L W K, Nie S M et al. In vivo cancer targeting and imaging with semiconductor quantum dots. Nature Biotech. 2004;22:969–976.
- Godefroo S. Classification and control of the origin of photoluminescence from Si nanocrystals. Nature Nanotech. 2008;3:174–178.
- Liu Z. Circulation and long-term fate of functionalized, biocompatible single-walled carbon nanotubes in mice probed by Raman spectroscopy. Proc. Natl Acad. Sci. USA. 2008;105:1410–1415.
- Park J, Gu L. Biodegradable luminescent porous silicon nanoparticles for in vivo applications. Nature materials. 2009;8.
- Mobarok H, Purkait K T, Islam A M, Miskolzie M, Veinot J. Instantaneous functionalization of chemically etched silicon nanocrystal surfaces. AngewandteChemie. 2016;56, 6073-6077.
- Herynkova K, Podkorytov E, Slechta M, Cibulka O. Colloidal solutions of luminescent porous silicon clusters with different cluster sizes. Nanoscale Res Lett. 2014;9:478.
- Liu D, Bimbo L, Makila E, Villanova F, Kaasalainen M. Co-delivery of a hydrophobic small molecule and a hydrophilic peptide by porous silicon nanoparticles. J Control Release. 2013;170:268–278.
- Perrone Donnorso M, Miele E, De Angelis F, La Rocca R. Nanoporous silicon nanoparticles for drug delivery applications. Microelectron Eng. 2012;98:626-629.
- Masserini M. Nanoparticles for brain drug delivery. ISRN Biochemistry. article ID 238428, Hindawi. 2013.
- Tamba B I, Streinu V, Foltea G, Neagu A N, Dodi G, Zlei M et al. Tailored surface silica nanoparticles for blood-brain barrier penetration: preparation and in vivo investigation. Arab J Chem. 2018;18:30077-7.
- Song Y, Du D, Li L, Xu J, Dutta P, Lin Y et al. In vitro study of receptor-mediated silica nanoparticles delivery across blood−brain barrier. ACS Appl Mater Interfaces. 2017;9: 20410−20416.
- Nigro A, Pellegrino M, Greco M, ComandeA, Sisci D, Pasqua L et al. Dealing with skin and blood-brain barriers: the unconventional challenges of mesoporous silica nanoparticles. Pharmaceutics. 2018;10:250.
- Jampilek J, Zaruba K, Oravec M, Kunes M, Babula P, Ulbrich P et al. Preparation of silica nanoparticles loaded with nootropics and their in vivo permeation through blood-brain barrier. Hindawi. 2015.
- Mendirata S, Hussein M, Nasser H, Atef Ahmed Ali A. Multidisciplinary role of mesoporous silica nanoparticles in brain regeneration and cancers: from crossing the blood–brain barrier to treatment. Part. Part. Syst. Charact. 2019;1900:195.
- Liu D, Lin B, Shao W, Zhu Z, Ji T, Yang C et al. In vitro and in vivo studies on the transport of PEGylated silica nanoparticles across the blood−brain barrier. ACS Appl Mater Interfaces. 2017;6:2131−2136.
- Lopez T, Mangolini L. On the nucleation and crystallization of nanoparticles in continuous-flow nonthermal plasma reactors. J Vac Sci Technol B. 2014;06:1802.
- Kortshagen U. Nonthermal plasma synthesis of semiconductor nanocrystals. J. Phys. D: Appl. Phys. 2009.
- Mangolini L, Jurbergs D, Rogojina E, Kortshagen U. Plasma synthesis and liquid-phase surface passivation of brightly luminescent Si nanocrystals. J Lumin. 2006.
- Ayawei N, Newton Ebelegi A, Wankasi D. Modelling and interpretation of adsorption isotherms. Journal of Chemistry. 2017.
- Liu L, Luo X, Ding L, Luo S. Application of nanotechnology in the removal of heavy metal from water. 2019.
- Nair D, Podgorski M, Chatani S, Gong T, Xi W. The thiol-michaeladdition click reaction: a powerful and widely used tool in materials chemistry. Chem Mater. 2014;26:724−744.
- Wen G, Zeng X, Wen X, Liao W. Photoluminescence properties and crystallization of silicon quantum dots in hydrogenated amorphous Si-richsilicon carbide films. J. Appl. Phys. 2014;115.
- Post P, Wurtlizer L, Maus-Friedrichs W, Weber A. Characterization and applications of nanoparticles modified in-flight with silica or silica-organic coatings. Nanomaterials. 2018;8: 530.
- Luo L, Song Y, Zhu C, Fu S, Shi Q. Fluorescent silicon nanoparticles-based ratiometric fluorescence immunoassay for sensitive detection of ethyl carbamate in red wine. Sensors and Actuators B: Chemical. 2018;255:2742-2749.
- Nagarajan R. Nanoparticles: Building Blocks for Nanotechnology. ACS Publications. 2008;(1): 2-14.
- Kumar K, Srinivas G, Wood B, Ramisetty K, Stewart A A, Howard C A et al. Characterization of adsorption site energies and heterogeneous surfaces of porous materials. J. Mater. Chem. A. 2019;7:10104-10137.
- Kaushik N, Kaushik N, Linh N, Ghimire B. Plasma and nanomaterials: fabrication and biomedical applications. Nanomaterials. 2019;9:98.
- Kulik T V, Lipkovska N A, Barvinchenko V N, Palyanytsya B B, Kazakova O A, Dovbiy O A et al. Interactions between bioactive ferulic acid and fumed silica by UV–vis spectroscopy, FT-IR, TPD MS investigation and quantum chemical methods. J. Colloid Interface Sci. 2009;339:60–68.
- Bimbo L, Sarparanta M, Santos H A, Airaksinen A J, Mäkilä E, Laaksonen T et al. Biocompatibility of thermally hydrocarbonized porous silicon nanoparticles and their biodistribution in rats. ACS Nano. 20104;(6)22:3023-32.
- Morris A, Adamcakova Dodd A, Lehman S, Wongrakpanich A. Amine modification of nonporous silica nanoparticles reduces inflammatory response following intratracheal instillation in murine lungs. Toxicol. Lett.2016;241:207–215.
- Shafqat S S, Khan A A, Zafar M N. Development of amino-functionalized silica nanoparticles for efficient and rapid removal of COD from pre-treated palm oil effluent.J. Mater. Res. Technol. 2019;8:385 -395.
- Peng S, Deng Y, Li W, Chen J, Liu H, Chen Y et al. Aminated mesoporous silica nanoparticles for removal of low concentration aldehyde malodorous gases. Environ. Sci.: Nano. 2018;00:1-3.
- Liu T, Li L, Teng X, Huang X, Liu H, Chen D et al. Single and repeated dose toxicity of mesoporous hollow silica nanoparticles in intravenously exposed mice. Biomaterials. 2011;32:1657-1668.
- Kenneth S W, Ruth T W. Physisorption Hysteresis Loops and the Characterization of Nanoporous Materials. Adsorp Sci Technol. 2004;22:10.
- Cho M, Cho W S, Choi M. The impact of size on tissue distribution and elimination by single intravenous injection of silica nanoparticles. Toxicol Lett. 2009;189(3):177–183.
- Choi S, Lee H, Park D W. Synthesis of Silicon Nanoparticles and Nanowires by a Nontransferred Arc Plasma System. J. Nanomater.. 2016;9.
- Shavel A, Guerrini L. Alvarez-Puebla R. A. Colloidal synthesis of silicon nanoparticles in molten salts. Nanoscale.2017;9, 8157-8163.
Citation: Podkorytov E, Stastny M, Chvojkova M, Cejkova L, Asnaz OH, Benedikt J, et al. (2021) Comparison of Si Nanoparticle types for use as a Potencial Drug Delivery System for Central Nervous System Diseases. J Nanomed Nanotech. 12: 566.
Copyright: © 2021 Podkorytov E, et al. This is an open-access article distributed under the terms of the Creative Commons Attribution License, which permits unrestricted use, distribution, and reproduction in any medium, provided the original author and source are credited.