Indexed In
- Open J Gate
- Genamics JournalSeek
- JournalTOCs
- China National Knowledge Infrastructure (CNKI)
- Electronic Journals Library
- RefSeek
- Hamdard University
- EBSCO A-Z
- OCLC- WorldCat
- SWB online catalog
- Virtual Library of Biology (vifabio)
- Publons
- MIAR
- Euro Pub
- Google Scholar
Useful Links
Share This Page
Journal Flyer

Open Access Journals
- Agri and Aquaculture
- Biochemistry
- Bioinformatics & Systems Biology
- Business & Management
- Chemistry
- Clinical Sciences
- Engineering
- Food & Nutrition
- General Science
- Genetics & Molecular Biology
- Immunology & Microbiology
- Medical Sciences
- Neuroscience & Psychology
- Nursing & Health Care
- Pharmaceutical Sciences
Research Article - (2023) Volume 14, Issue 3
CO2 over a Coastal Urban Location and its Forcing
Sandhya K Nair1* and Madhusoodanan MS22Amity Institute of Global Warming and Ecological Studies (AIGWES), Noida, Uttar Pradesh, India
Received: 14-Mar-2023, Manuscript No. JPEB-23-20485; Editor assigned: 16-Mar-2023, Pre QC No. JPEB-23-20485 (PQ); Reviewed: 03-Apr-2023, QC No. JPEB-23-20485; Revised: 10-Apr-2023, Manuscript No. JPEB-23-20485 (R); Published: 17-Apr-2023, DOI: 10.35248/2157-7463.23.14.517
Abstract
Recognizing the role of Carbon dioxide (CO2) in altering climate research and air pollution, direct measurements carried out over a coastal urban station using Li-COR CO2/H2O analyser. The objective of the present study is to examine CO2 variability during December-March. Day-to-day variability of CO2 ranges from 380-550 ppm with a mean (423.1) and standard deviation (29.2). Monthly mean diurnal variability of CO2 is maximum during midnight to early morning hours and minimum during afternoon. Overall diurnal variation is similar during the entire months. The link between CO2 concentrations with Wind Speed (WS), Atmospheric Temperature (T) is examined. Wind speed varies inversely with CO2. Atmospheric temperature shows an exponentially decaying relation with CO2. The diurnal CO2 variability is associated with the competing source/sink mechanisms. The CO2 forcing is estimated and varies from 0.75 to 3.5 Wm-2 with temperature change from 1.75 to 2.0˚C.
Keywords
Carbon dioxide; Coastal urban location; Eddy covariance system; Forcing
Introduction
Atmospheric Carbon dioxide (CO2) plays a critical role in radiative perturbation of earth atmosphere system by acting as a major greenhouse gas, control atmospheric temperature and plays a vital role in surface air pollution. The global mean Radiative Forcing (RF) of CO2 is +1.66 (± 0. 17) Wm-2 (IPCC, 2007). The present level of background CO2 based on Mauna Loa data crossed 400 ppm and is increasing at an average rate of 2.13 ppmv per year [1]. Source/sink mechanisms of CO2 are mainly fossil fuel combustion from urban and industrial areas followed by land use changes, the ocean and animal respiration and removal from atmosphere by photosynthesis and carbon deposition. The surface CO2 distribution is determined by meteorological conditions of winds pattern, precipitation and atmospheric temperature. The urban regions are very important in the perspective of CO2 production and the coastal regions play a vital role in the distribution of CO2 due to the presence of mesoscale circulation prevailing over the region. Studies have already detailed on the effect of atmospheric CO2 [2,3] in altering the rainfall pattern through warmer atmospheric temperature and higher atmospheric water vapour content. Local temperature and moisture conditions are also affecting the diurnal cycle and seasonal variations in atmospheric CO2 [4].
Measurements of CO2 carried out using variety of instruments such as in situ remote sensing techniques of Non-dispersive infrared absorption for detecting CO2 [5]. Cavity Ring-Down Spectroscopy (CRDS) for the detection of CO2 and CH4 [6], Eddy Covariance Techniques (LICOR CO2/H2O analyser), Satellite observations, Atmospheric Infrared Sounder (AIRS) and Modeling approaches. A multisite initiative has been evolved from Indian Space Research Organization (ISRO) International Geosphere Biosphere Programme (IGBP) for quantifying national carbon balance. A study has reported on the influence of environmental factors and biospheric processes on the temporal variations of atmospheric CO2 in Dehradun [4]. In order to examine the CO2 variability, the present study, we make use of the data from Eddy covariance system with micrometeorological sensors installed at Thumba, Thiruvananthapuram, and a coastal sensors installed at Thumba, Thiruvananthapuram, and a coastal urban location. The objective of this paper is to examine and quantify the variability of CO2 over the coastal urban station situated in the Southwest Peninsular India during December-March and link with meteorological parameters, quantify the CO2 radiative forcing.
Materials and Methods
Experimental setup data collection and processing
The experimental site is a coastal urban station Thumba (8.5◦N, 76.9◦E) located in the southwest coast of Indian subcontinent ~500 m inland of the sea coast with the coastline roughly aligned to 145° to 325° (Figure 1). The terrain is nearly homogeneous and flat with scattered small bushes and trees. The instrument is facing in the north-west direction.
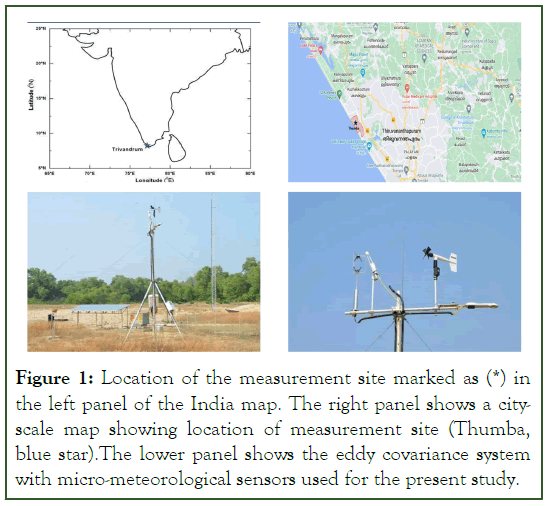
Figure 1: Location of the measurement site marked as (*) in the left panel of the India map. The right panel shows a cityscale map showing location of measurement site (Thumba, blue star).The lower panel shows the eddy covariance system with micro-meteorological sensors used for the present study.
Eddy Covariance (EC) system with micro-meteorological measurements was installed on a 4 m tripod above the ground. The system comprises of a three-dimensional sonic anemometer and open path CO2/H2O analyzer which together provides the three-dimensional component of wind and concentration of H2O and CO2. The EC system has both fast and slow response meteorological data. Fast response (20 Hz) data from sonic anemometer and CO2/H2O analyzer were logged in the L1-7550 analyzer interface unit. Slow response micrometeorological data are obtainable at a time resolution of 1 min through Sutron data logger. All the data files are transferred through RS-232 which permits daily data collection and realtime monitoring of the instrument. These data were further processed with Eddypro 5.1 software following normal measures, including de-spiking of raw data, correction of the angle of attack. Fast response flux measurements were processed and stored in the time resolution of 30 min used for present analysis. Quality assurance carried out for instrument failure, low signal strength (for L1-7500 output during the time of rain) which adversely affects the reading, and the data sets falls beyond physically reasonable thresholds.
Results and Discussions
Day-to-day and monthly variability of CO2
Figure 2 shows the time series plot of CO2 mixing ratio during December-March. The data used here is half an hour interval values of CO2 processed through Eddypro software. The raw data of three-dimensional component of winds from sonic anemometer (u, v, w) and mixing ratio from Lambda Instruments Corporation (LI COR) CO2/H2O analyser of 20 Hz frequency. The magnitude of CO2 varies from 388 ppm to 549 ppm with a mean value of (423 ppm) and 1σ variability drops of (29 ppm).The difference between the high and low value of CO2 is 161 ppm. The variability is due to the contrasting air mass and coastal boundary layer evolution Figure 2.
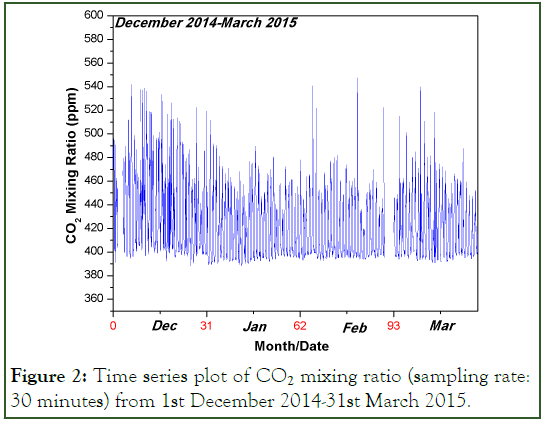
Figure 2: Time series plot of CO2 mixing ratio (sampling rate: 30 minutes) from 1st December 2014-31st March 2015.
Monthly mean diurnal variability of CO2 is shown in Figure 3. A consistent increase is seen from evening (~18.00 pm) to early morning (~ 07.00 pm) hours with maximum during midnight. Monthly mean values of CO2 peak at 435 ± 25, 418 ± 22, 418 ± 21, 420 ± 20 ppm during December to April and the diurnal amplitude range is ~60 ppm. Durnal cycles of atmospheric CO2 are affected by source/sink mechanisms with more CO2 intake during plant photosynthesis and release during the time of soil/plant respiration, regional transport and ABL dynamics [7]. Mixing ratio shows a sharp decrease after sunrise due to the evolution of Atmospheric Boundary Layer (ABL) and drops to a minimum most value in the afternoon when net ecosystem uptake and maximum boundary layer height. During night, mixing ratios increases due to the absence of photosynthetic activity, and stable atmospheric boundary layer. These diurnal cycles are also observed in other stations like Dehradun especially during pre-monsoon and monsoon seasons due to more moisture content in the soil, whereas such increase is not significant in Gadanki [4]. This coupling was already mentioned in the modeling studies [8-11] and the vertical concentration gradient to be correlated with the ABL dynamics.CO2 link with the controlling meteorological parameters like Wind speed and Atmospheric temperature examined detailed in Figures 4, 5. High CO2 mixing ratio in lower wind regimes and lower for high wind speeds reveal the emission from various sources. CO2 conveys exponential decay with temperature.
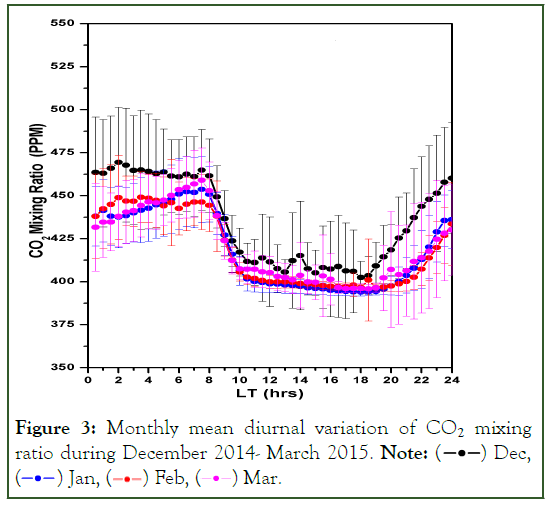
Figure 3: Monthly mean diurnal variation of CO2 mixing
ratio during December 2014- March 2015. Note: ( ) Dec,
(
 ) Jan, (
 ) Feb, (
 ) Mar.
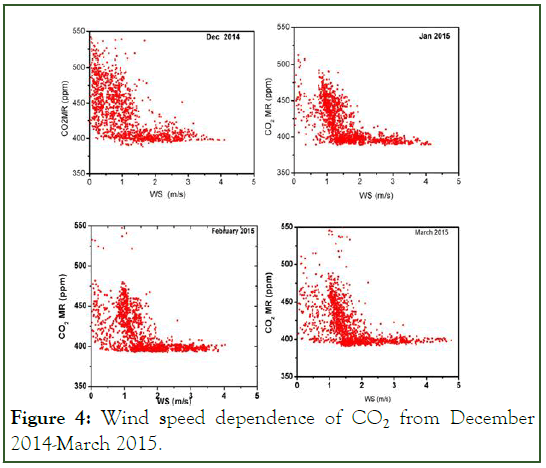
Figure 4: Wind speed dependence of CO2 from December 2014-March 2015.
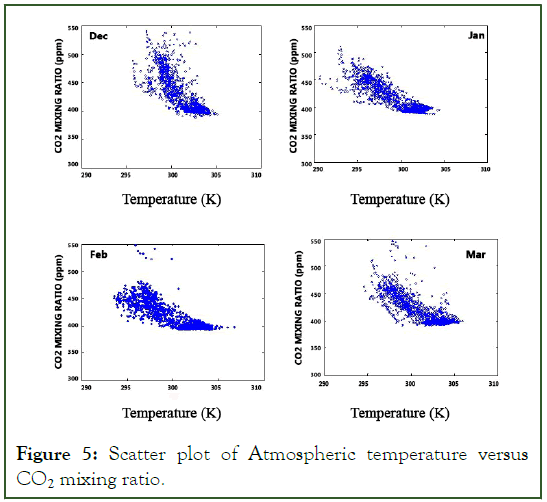
Figure 5: Scatter plot of Atmospheric temperature versus CO2 mixing ratio.
CO2 FORCING
CO2 forcing and associated temperature change is estimated using the formulae from Myhre, et al (1998) F=5.35 ln(C/Co)(1)
dT=λ*dF (2)
Where 'dF' is the radiative forcing in Watts per square meter, 'C' is the concentration of atmospheric CO2, and 'Co' is the reference CO2 concentration. Normally the value of Co is chosen at the pre-industrial concentration of 280 ppmv. Figure (6) shows the CO2 radiative forcing during December-March months estimated using equation (1). It can be seen that CO2 forcing ranges from 1.75-3.5 Wm-2 over Trivandrum with clear diurnal cycle and the temperature change due to CO2 is 0.75-2.00C [12-14].
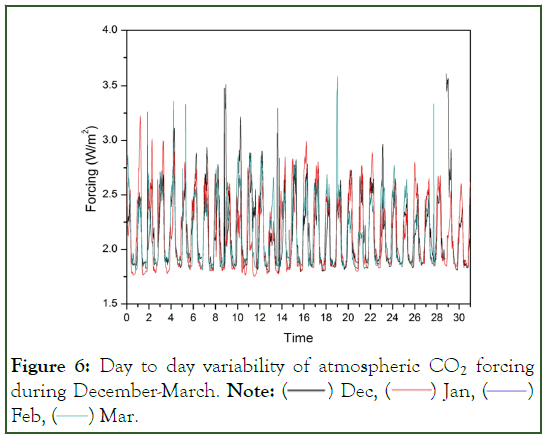
Figure 6: Day to day variability of atmospheric CO2 forcing
during December-March. Note: ( ) Dec, (
 ) Jan, (
 )
Feb, (
 ) Mar.
Conclusion
The objective of the study is to examine variability of atmospheric CO2 over a coastal urban station Thumba
During December-March period and it’s forcing. The study summarizes following points:
• Monthly mean diurnal variation of CO2 shows peak in midnight to early morning hours and minimum during afternoon.
• CO2 link with meteorological parameters is examined and found an inverse relation with wind and atmospheric temperature.
• CO2 forcing estimated and varies from 1.75 Wm-2 to 3.5 Wm-2 with a temperature change of 0.75˚C to 2˚C.
Data Availability Statement
The datasets used and analyzed during the current study are available from the corresponding author upon reasonable request.
The datasets generated and/or analyzed during the current study are not publicly available due to the study coming under the research activities of ISRO, Government of India and hence data not available publicly but are available from the corresponding author upon reasonable request.
References
- Bruce JP, Frome M, Haites E, Janzen H, Lal R, Paustian K. Carbon sequestration in soils. J Soil Water Conserv. 1999;54(1):382-389.
- Annamalai H, Hafner J, Sooraj KP, Pillai P. Global warming shifts the monsoon circulation, drying South Asia. J Clim. 2013;26(9):2701-2718.
- Kumar M, Bhatt VP, Rajwar GS. Plant and soil diversities in a subtropical forest of the Garhwal Himalaya. J For Res. 2006;19:1-9.
- Sharma N, Nayak RK, Dadhwal VK, Kant Y, Ali MM. Temporal variations of atmospheric CO2 in Dehradun, India during 2009. Air Soil Water Res. 2013;6:ASWR-S10590.
- Vay SA, Anderson BE, Conway TJ, Sachse GW, Collins Jr JE, Blake DR, et al. Airborne observations of the tropospheric CO2 distribution and its controlling factors over the South Pacific Basin. J Geophys Res Atmos. 1999;104(D5):5663-5676.
- Soloman S, Quin D, Manning M, Chen Z, Marquis M, Averyt KB, et al. Climate change 2007: The physical science Basis, Contribution of working group 1 to the Fourth Assessment Report of the Intergovernametal Panel on Climate change. Cambridge University Press, 2007; 4:996.
- Rice A, Bostrom G. Measurements of carbon dioxide in an Oregon metropolitan region. Atmos Environ. 2011;45(5):1138-1144.
- Lac C, Donnelly RP, Masson V, Pal S, Riette S, Donier S, et al. CO2 dispersion modelling over Paris region within the CO2-MEGAPARIS project. Atmos Chem Phys. 2013;13(9):4941-4961.
- Cherchi A, Alessandri A, Masina S, Navarra A. Effects of increased CO2 levels on monsoons. Climate Dynamics. 2011;37:83-101.
- Fang SX, Zhou LX, Tans PP, Ciais P, Steinbacher M, Xu L, et al. In situ measurement of atmospheric CO2 at the four WMO/GAW stations in China. Atmos Chem Phys. 2014;14(5):2541-2554.
- Pathakoti M, Gaddamidi S, Gharai B, Sudhakaran Syamala P, Rao PV, Choudhury SB, et al. Influence of meteorological parameters on atmospheric CO2 at Bharati, the Indian Antarctic research station. Polar Res. 2018;37(1):1442072.
- Myhre G, Highwood EJ, Shine KP, Stordal F. New estimates of radiative forcing due to well mixed greenhouse gases. Geophys Res Lett. 1998;25(14):2715-2718.
- Xueref-Remy IX, Dieudonné E, Vuillemin C, Lopez M, Lac C, Schmidt M, et al. Diurnal, synoptic and seasonal variability of atmospheric CO2 in the Paris megacity area. Atmos Chem Phys. 2018;18, 3335–3362.
- Albergel C, Dorigo W, Reichle RH, Balsamo G, De Rosnay P, Muñoz-Sabater J, et al. Skill and global trend analysis of soil moisture from reanalyses and microwave remote sensing. J Hydrometeorol. 2013;14(4):1259-1277.
Citation: Nair SK, Madhusoodanan MS (2023) CO2 over a Coastal Urban Location and its Forcing. J Pet Environ Biotechnol. 14.517.
Copyright: © 2023 Nair SK, et al. This is an open-access article distributed under the terms of the Creative Commons Attribution License, which permits unrestricted use, distribution, and reproduction in any medium, provided the original author and source are credited.
