
Indexed In
- Open J Gate
- Genamics JournalSeek
- ResearchBible
- RefSeek
- Directory of Research Journal Indexing (DRJI)
- Hamdard University
- EBSCO A-Z
- OCLC- WorldCat
- Scholarsteer
- Publons
- MIAR
- Euro Pub
- Google Scholar
Useful Links
Share This Page
Journal Flyer
Open Access Journals
- Agri and Aquaculture
- Biochemistry
- Bioinformatics & Systems Biology
- Business & Management
- Chemistry
- Clinical Sciences
- Engineering
- Food & Nutrition
- General Science
- Genetics & Molecular Biology
- Immunology & Microbiology
- Medical Sciences
- Neuroscience & Psychology
- Nursing & Health Care
- Pharmaceutical Sciences
Research Article - (2023) Volume 12, Issue 1
Allosteric Structure of Effector-free Human Hemoglobin
Francis Knowles*Received: 29-Dec-2022, Manuscript No. BABCR-23-19477; Editor assigned: 02-Jan-2023, Pre QC No. BABCR-23-19477 (PQ); Reviewed: 17-Jan-2023, QC No. BABCR-23-19477; Revised: 25-Jan-2023, Manuscript No. BABCR-23-19477 (R); Published: 01-Feb-2023, DOI: 10.35248/2161-1009.23.12.471
Abstract
The O2-affinity of human hemoglobin, free of E-molecules, was measured in 0.050 M Bis-Tris, pH 7.0 with HCl, 20°C. A Hill plot of O2-equilibrium binding data reveals an initial slope of 2 and fails to demonstrate an upward inflection. Four O2-binding reactions account for these results. The tetrameric hemoglobin structure in an E-free supporting electrolyte can be described as two cooperative dimeric subunits: (T,1α, R,2β) and (T,2α, R,1β). Subunits of human Hb4 are α- and β-chains. Within the hemoglobin tetramer: (i) Parenthetical inclusions describe the composition of cooperative dimeric subunits; (ii) Superscripts in the upper left identify the position of the subunit in the tetramer, and conformational state; R for the high affinity state and T for the low affinity state. Equilibrium constants of these four steps are related to intrinsic O2-binding constants for α and β chains, Kα and Kβ, respectively, by statistical factors: The equation of state contains these four unknown quantities.
Keywords
E-molecules; Cooperative mechanisms; Affinity; Electrolyte
INTRODUCTION
O2-Binding constants are not expected to be identical for each of the dimeric cooperative subunits: (1α,2β) and (2α,1β). The first cooperative subunit, (T,1α, R,2β), binds O2 while bound to an O2- free cooperative dimer, (T,2α,R,1β). The second cooperative dimer, (T,2α, R,1β), binds O2 while bound to R(1αO2,2βO2). The best fitting values obtained in fitting O2-binding data in an E-free supporting electrolyte to the equation of state, in units of L/μmol are: K1=0.2913; K2=1.112; K3=0.4912; K4=0.3185. A plot of predicted values of F versus observed values of F is linear: FPRE=0.9995 FOBS+0.0007 with a correlation coefficient of 0.9995. In the instance of each cooperative dimer, Kα exceeds Kβ. An equilibrium constant describing structural changes such as KΔ=[Rstate]/[Tstate] does not appear in E-free supporting electrolytes [1].
O2-Binding constants are not expected to be identical for each of the dimeric cooperative subunits: (1α,2β) and (2α,1β). The first cooperative subunit, (T,1α, R,2β), binds O2 while bound to an O2- free cooperative dimer, (T,2α,R,1β). The second cooperative dimer, (T,2α, R,1β), binds O2 while bound to R(1αO2,2βO2). The best fitting values obtained in fitting O2-binding data in an E-free supporting electrolyte to the equation of state, in units of L/μmol are: K1=0.2913; K2=1.112; K3=0.4912; K4=0.3185. A plot of predicted values of F versus observed values of F is linear: FPRE=0.9995 FOBS+0.0007 with a correlation coefficient of 0.9995. In the instance of each cooperative dimer, Kα exceeds Kβ. An equilibrium constant describing structural changes such as KΔ=[Rstate]/[Tstate] does not appear in E-free supporting electrolytes [2].
Addition of 0.1 M NaCl to the supporting electrolyte results in an approximately 4-fold increase in the concentration of O2 required for half saturation of hemoglobin: 1.9 μmol/L in 0.05 M Bis-Tris, pH 7, 20°C and 8.1 μmol/L in the presence of 0.10 M NaCl. O2- Equilibrium binding data obtained in the presence of 0.10 M NaCl cannot be fitted by the equation of state described above for the E-free solution. O2-Equilibrium binding data obtained in the presence of 0.100 M NaCl can, however, be fitted by the Perutz- Adair equation: Kα=5.3 × 10⁴ L/mol; Kc=0.0325; Kβ=1.8 × 10⁶ L/ mol [3,4].
Supplementing 0.050 M Bis-Tris, pH 7.0 with HCl with 0.100 M NaCl results in a supporting electrolyte that induces a T-state of relatively high affinity in Hb4 compared to the T-state obtained in the binary complex of Hb4/BPG. Hb4 appears to respond to the presence of chloride ions in the central cavity. The mechanism of the response to chloride ions is attributed to neutralization of positively charged residues in the central cavity of Hb4 by the relatively high concentration of chloride ions.
It is of interest to consider the effect on the O2-equilibrium binding properties of human rbc-lysates, brought about by quantitative removal of E-molecules. BPG, as well as many other E-molecules, stabilize a Tstate structural configuration (described as a conformation in earlier literature) of Hb4 (Accession Code: UniProtKB-P69905 (HbA_Human)) resulting in markedly diminished affinity for O2. Hb4, in supporting electrolytes free of any E-molecules, is not in the structural configuration characteristic of Hb4/BPG. Hb4/BPG only exists in vitro, not being presented in vivo under normal conditions. E-free Hb4 contains elements of structure which respond to the presence of BPG. Information concerning these incomplete unit(s) of allosteric structure is reflected in the O2-equilibrium binding data obtained in E-free supporting electrolytes. O2-Equilibrium binding data (Knowles)1 and 19F-nmr data (Knowles)2 identify cooperative dimeric subunits in the hemoglobin tetramer. Equation a, a model describing structural changes as E-free α2β2 is converted to E-free (αO2)2(βO2)2, by a sequence of four O2-binding reactions, is supported by the experimental results described herein. This model can be viewed as a variant of the Adair model insofar as it is comprised of a sequence of O2-binding reactions3.
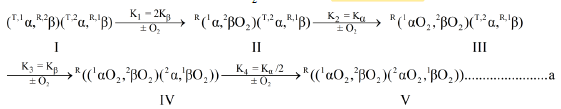
Equation a is a model for the reaction sequence from E-free Hb4, species I, to (HbO2)4, species V. Hemoglobin subunits are represented as α and β. Parenthetical inclusions describe cooperative dimeric subunits. Superscript integers to the upper left describe: the position of subunits in the hemoglobin tetramer and the conformational state, R or T.
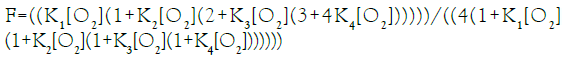
In this communication, an equation of state for E-free Hb4 is presented for O2-equilibrium binding curves and tested for its ability to account for equilibrium binding data. Fractional saturation, F, is defined in Equation (1), with integers representing the number of occupied O2-binding sites on each of the species defined in Equation a.

The allosteric architecture of species I through V is assigned in Equation a, cooperative units of structure being enclosed within brackets, as in (1α 2β) and (2α 1β). Substitution of analytical expressions for species I through V, obtained from individual mass action expressions, into (1) leads to the equation of state, (2), relating F to [O2]
Equation (2), based on binding constants intrinsic to α-chains and β-chains, Equation a, requires four variables to describe the O2-equilibrium binding curve modeled in Equation a. Equation (2), presented in a form compressed by repeated algebraic factoring, is found to describe the E-free O2-equilibrium binding curve. O2- Equilibrium binding constants are expected to be related to intrinsic binding constants for a- and b-chains, Kα and Kβ, respectively, by statistical factors: K1=2 Kβ, K2=Kα, K3=Kβ, K4=0.5 Kα. Statistical factors suggest that the equation of state can be expressed with only 2 unknown quantities: Kβ and Kα.
Efforts to establish an E-Free supporting electrolyte demand an amine buffer. Amine buffers, such as Bis-Tris, require neutralization with an acid to obtain a pH-value of 7. The conjugate base of any acid that might be utilized to neutralize a solution of Bis-Tris is likely to be an E-molecule. Therefore, it is necessary to use as low a concentration of buffering amine as possible. Use of a strong acid ensures that un-dissociated acids will not be present in the supporting electrolyte. HCl was chosen to adjust the pH of 0.05 M Bis-Tris. The pK-value of Bis-Tris suggests that the concentration of chloride ion in solutions used to establish binding data was 0.012 M. O2-Equilibrium binding curves in 0.025 M Bis-Tris, pH 7 and 0.05 M Bis-Tris, pH 7 are identical, establishing that chloride ion, at the concentrations used in these experiments, does not act as an E-molecule. A response to chloride ions requires concentrations as high as 0.10 M [5,6].
Materials and Methods
Stock solutions of human hemoglobin were prepared from whole blood obtained from a single donor. These stock solutions of hemoglobin were subjected to buffer exchange operations on a column of Sephadex G-25 equilibrated witheither (i) 0.050 M Bis-Tris, pH 7.0 or (ii) 0.050 M Bis-Tris, 0.100 M NaCl, pH 7.0. The hemoglobin solutions were further diluted with either (i) 0.050 M Bis-Tris, pH 7.0 or (ii) 0.050 M Bis-Tris, 0.100 M NaCl, pH 7.0 to provide approximately 200 mL of a hemoglobin solution suitable for use in the gas-liquid equilibration apparatus [7]. The details of the procedure for purification of stock solutions of hemoglobin, generation of gas mixtures of known composition, equilibration of hemoglobin solutions with gas mixtures, and spectroscopic analysis of Hb4 solutions partially saturated with O2 have previously been described (Knowles and Gibson)9. Bis-Tris, obtained from Aldrich Chemical Company, was crystallized from ethanol. The heme concentration of samples of hemoglobin used for elaboration of O2-binding curves was 300-400 μM. Binding data were fitted to the appropriate equation of state using XYCALC, Version 3.0. XYCALC determined best fitting values of non-linear parameters by an iterative procedure based on Nelder and Mead’s downhill simplex method. These results have been confirmed by use of the curve fitting tool in MatLab [8,9].
Results and Discussion
The affinity of Hb4 for O2 in 0.050 M Bis-Tris, pH 7.0 with HCl, 20.0°C
Equilibrium binding data are presented in Table 1, O2 concentrations being expressed in units of μmoles/L. The concentration of O2 in the liquid phase, required for half-saturation of Hb4, is 1.90 μmol/L (corresponding to a partial pressure of 1.07 torr O2 in the gas phase). The O2-equilibrium binding curve is presented in Figure 1.
| [O2] μmol/L | F | [O2] μmol/L | F |
|---|---|---|---|
| 0.303 | 0.0325 | 3.32 | 0.733 |
| 0.357 | 0.044 | 3.76 | 0.756 |
| 0.446 | 0.0675 | 5.32 | 0.826 |
| 0.553 | 0.0785 | 6.9 | 0.877 |
| 0.624 | 0.0945 | 8.14 | 0.903 |
| 0.731 | 0.153 | 9.42 | 0.913 |
| 0.946 | 0.207 | 10.6 | 0.918 |
| 1.18 | 0.291 | 11.8 | 0.929 |
| 1.46 | 0.372 | 12.8 | 0.935 |
| 1.75 | 0.447 | 15 | 0.941 |
| 2.05 | 0.526 | 17.3 | 0.948 |
| 2.36 | 0.573 | 21.3 | 0.957 |
| 2.66 | 0.635 | 25.9 | 0.965 |
| 3 | 0.687 |
Table 1: Binding data for Hb4 in 0.050 M BisTris, pH 7.0, 20.0°C.

Figure 1: O2 Equilibrium binding curve of E-free purified human hemoglobin. Data obtained in 0.050 M BisTris, pH 7.00 with HCl, 20.0°C.
A hill plot of O2 binding data is presented in Figure 2. The shape of the hill plot deviates from the expected sigmoid-shape in several respects: (i) the limiting n-value, as the concentration of O2 approaches zero, is 2 rather than 1; (ii) an upward inflection is not observed; (iii) the n-value decreased from 2.0 to values approaching unity at concentrations of O2 supporting values of F greater than 0.75.

Figure 2: Hill plot of O2 equilibrium binding data. The supporting electrolyte is 0.050 M BisTris, pH 7.00 with HCl, 20.0°C.
The best fitting values obtained in fitting O2-binding data in an E-free supporting electrolyte to the equation of state, in units of L/μmol are: K1=0.2913; K2=1.112; K3=0.4912; K4=0.3185. The correlation coefficient for fitting of binding data to the equation of state is 0.9995. Assigning equilibrium constants to individual chains in the first cooperative subunit yields: Kβ=0.146 and Kα=1.112. Equilibrium constants for the second cooperative subunit are Kβ’=0.4912 and Kα’=0.637. A plot of predicted values of F versus observed values of F, (Figure 3), is linear, FPRE=0.9995 FOBS+0.0007, a straight line being FPRE=FOBS. The correlation coefficient is 0.9995. In each cooperative dimer, Kα exceeds Kβ. Predicted values of F, FPRE, were obtained using the best fitting values for the equilibrium constants together with Equation (2), and the experimentally determined values for concentration of O2. The graph of FPRE versus FOBS is given in Figure 4.

Figure 3: Evaluation of the ability of the equation of state to predict F of Hb4 in E-free electrolytes. Comparison of observed values of F in 0.050 M BisTris, pH 7.0, 20.0°C with values of F predicted by the equation of state, Eq. (1.3) and the best fitting values of K.

Figure 4: O2 equilibrium binding curve of human hemoglobin in 0.050 M BisTris, 0.100 M NaCl, pH 7.0, 20.0°C. Half saturation was obtained at 8.1 μmol /L in the liquid phase.
The value of Kβ, the first subunit to bind O2, is small in comparison with the value of Kα=7.62. Binding of O2 to the α-chain in each cooperative subunit is regulated by reaction of the β-chain with O2. The value of Kα\Kβ for the second cooperative dimeric subunit is significantly less: 1.30, due to a decrease in the value of Kα and an increase in the value of Kβ.
Affinity of Hb4 for O2 in 0.050 M Bis-Tris, 0.100 M NaCl, pH 7.0, 20.0°C
O2-affinity of Hb4 in 0.050 M Bis-Tris, pH 7.00, 20.0°C responds to the addition of NaCl to a final concentration of 0.100 M, binding data being presented in Table 2. The effect of addition of 0.100 M NaCl to 0.050 M Bis-Tris, pH 7.0, 20.0°C is: (i) to increase the O2 concentration in the liquid phase at which Hb4 is half-saturated with O2 from 1.9 μmol/L to 8.1 μmol/L, and (ii) to change, dramatically, the shape of the Hill plot, (Figure 5). The equilibrium binding curve is markedly S-shaped. Fitting of O2-equilibrium binding data to the Perutz/Adair equation yields: Kα=5.3 × 10⁴ L/μmol; KΔ=0.0325; Kβ=1.8 × 10⁵ L/μmol. The correlation coefficient for the curve fitting procedure is 0.9997 A graph of predicted values of F versus observed values of F should be linear: FPRE=FOBS. A graph of FPRE versus FOBS yields: FPRE=0.995 FOBS+0.0007, (Figure 6).
| [O2] μmol/L | F | [O2] μmol/L | F |
|---|---|---|---|
| 0.829 | 0.012 | 10.4 | 0.675 |
| 1.33 | 0.029 | 10.8 | 0.695 |
| 1.95 | 0.051 | 11 | 0.717 |
| 2.64 | 0.084 | 11.7 | 0.747 |
| 3.34 | 0.114 | 12.2 | 0.768 |
| 4.42 | 0.151 | 13 | 0.805 |
| 5.08 | 0.227 | 13.7 | 0.826 |
| 5.99 | 0.297 | 14.4 | 0.839 |
| 6.65 | 0.366 | 15.2 | 0.863 |
| 6.7 | 0.356 | 16.3 | 0.884 |
| 7.41 | 0.431 | 17.9 | 0.903 |
| 7.97 | 0.488 | 20.2 | 0.931 |
| 8.03 | 0.48 | 23.4 | 0.95 |
| 8.59 | 0.535 | 27.5 | 0.964 |
| 9.08 | 0.575 |
Table 2: Binding data for Hb4/(Cl-)n in 0.050 M BisTris, 0.100 M NaCl, pH 7.00 20.0°C.

Figure 5: Hill plot of O2 equilibrium binding data. The supporting electrolyte is 0.050 M BisTris, 0.100 M NaCl, pH 7.00 with HCl, 20.0°C.

Figure 6: Observed and predicted values of F of the O2 equilibrium binding curve of purified Hb4 in 0.100 M NaCl, 0.05 M BisTris, pH 7.00 with HCl, 20.0°C. Predicted values of F, FPRE, were calculated with the Perutz/Adair equation using the best fitting values of Kα, Kβ, and KΔ and the corresponding O2-values.
The Hill plot of O2-equilibrium binding date is similar to the majority of Hill plots obtained for human hemoglobin and described in the voluminous hemoglobin literature: (i) The n-value approaches unity as [O2] approaches zero; (ii) The Hill plot demonstrates an inflection point with n-value of approximately 2.6: the n-value decreases beyond the inflection point. The concentration of O2 required to attain F=0.5, however, is much lower than that required by BPG.
The results shown in Table 1 and Figures 1-3 represents the properties of Hb4 tetramers free of the influence of E-molecules. The results shown in Table 2 and Figures 4-6 are representative of the properties of a Hb4/E complex: Hb4/(Cl-1)n.
Hb4, in 0.050 M Bis-Tris, pH 7.0 with HCl, is, effectively, free of E-molecules. The O2-equilibrium binding properties of Hb4 differ markedly from the equilibrium binding properties of binary complexes of Hb4 with E-molecules. In O2-equilibrium binding experiments, E-free Hb4 behaves as a pair of cooperative dimeric elements of allosteric structure. These elements of allosteric structure come into existence when a pair of identical αβ dimers reacts to form E-free Hb4. The structural states assigned to each chain in Hb4 are established by the results of O2-equilibrium binding constants.
The interface between the α- and β-subunits of physical dimers, 1α, 1β (MW=32 kD), remaining when an Hb4 molecule dissociates into a pair of dimers, is not (cannot be) identical to the αβ interface formed when a pair of identical physical dimers associate to form tetrameric Hb4 (MW=64 kD). Physical dimers are R-state and fail to demonstrate allosteric properties (Anderson et al., Edelstein et al., Edelstein and Gibson). The integral n-value of 2.0 for the Hill plot of E-free Hb4 as F approaches zero, (Figure 3), defines a functional unit of co-operativity as being comprised of two O2-binding sites. 19F-NMR experiments with E-free Hb4 labeled at Cys-β93 by a disulfide linkage to the trifluoroethyl residue does not reveal chain heterogeneity while the same experiment in the presence of IHP demonstrates chain heterogeneity (Knowles). Strong binding of O2 to a α-chain, following week binding of O2 to a β-chain of E-free Hb4 accounts for the absence of chain heterogeneity.
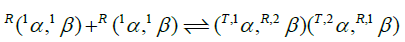
O2-Binding constants are not necessarily identical for each of the dimeric cooperative subunits (T,1α, R,2β) and (T,2α, R,1β). The first cooperative subunit, (T,1α, R,2β), binds O2 while in combination with a second O2-free cooperative dimer, (T,2α,R,1β). The second cooperative dimer, (T,2α, R,1β), binds O2 while bound to an R-state oxy-dimer, R(1αO2,2βO2). Clearly, (T,2α, R,1β) and R(1αO2, 2βO2) are different structures. It is likely that may not be identical in each of the two cooperative subunits of E-free Hb4.
The O2-binding constants of β-and α-chains of the first cooperative dimeric subunit to bind O2, in the E-free supporting electrolyte, in order of binding, are: Kβ=1.45 × 10⁵ L/mol; Kα=1.11 × 10⁶ L/ mol. They may be compared with the O2-binding constants in the presence of the weakest of E-molecules, 0.100 M NaCl, in order of binding: Kα=5.34 × 10⁴ L/mol; Kβ=1.81 × 10⁶ L/mol. E-molecule effects the values of both Kα and Kβ E-molecules reduce the affinity of β-chains below that of Tstate α-chains.
The first cooperative subunit of Hb4 undergoes the following sequence of reactions:
The Tstate in α-chains is established by proximal strain in the imidazole bond to the ferrous atom of the heme moiety (Perutz 1970 Perutz 1987). The Tstate α-chain is converted to the Rstate α-chain upon reaction of the Rstate β-chain with O2.
The Tstate in the presence of chloride ions, Hb4/(Cl-1)n, enhances pre-existing proximal strain in α-chains as well as establishing distal side steric hindrance to O2-binding by the β-chain. Distal side steric hindrance of β-chain heme moieties is a unique characteristic of all binary complexes of Hb4 and E-molecules, Hb4/(Cl-1)n in this instance. The order of binding of O2 to chains in E-free Hb4 is: The order of binding of O2 in Hb4/(Cl-1)n is: α,α, β,β.
An alternative model for O2-binding by Hb4, expressed in terms of the statistical assigned equilibrium constants, yields close agreement of predicted and observed values with the four-step ordered sequence cited above.
The equation of state for the model in Equation b, Equation 3, can be expressed in terms of only two unknown quantities.
The correlation coefficient for the equation of state, Equation (3), for the alternative model, Equation b, is 0.9992. These values are reasonably close to those presented for the model based on a sequence of four steps.
Conclusion
It is likely that a significant step in the evolution of the fully cooperative tetrameric hemoglobin molecule we know today occurred when (1α 1β) dimers underwent mutations leading to formation of tetramers resulting in (1α 2β) and (2α 1β) interfaces potentially supporting cooperative properties. Such a step may precede (i) Development of an E-molecule contributing to proximal strain in Tstate α-chains, (ii) Establishing steric hindrance to O2- binding by β-chains, and (iii) Sensitivity of O2-binding to the pH of the supporting electrolyte (Bohr Effect).
E-free Hb4 possesses a fundamental element of allosteric structure: identified as a pair of cooperative dimers that exist in Hb4 and do not exist in the dimeric molecules obtained upon dissociation of Hb4 into dimers. The O2-affinity of E-free Hb4 is too high to be useful as an O2 transport protein, being half saturated with O2 at less than 2 µmol/L. E-free (HbO2)4 generates an insufficient concentration gradient to move O2 from rbcs to mitochondria by the process of diffusion. BPG is a non-competitive inhibitor of O2 binding to Hb4, the resulting Hb4-inhibitor complex, Hb4/ BPG, possessing lower affinity for O2, being half saturated with O2 at approximately 60 µmol/L at pH 7.4 and 37°C. The role of Hb4 as an O2-transpsort protein is best managed as follows: (i) Hb4 should possess a high O2-affinity in the pulmonary circulation (the lung) and a low affinity for O2 in the systemic circulation (muscles, kidney, etc.). E-Free Hb4 possesses a pair of cooperative dimers: (T1α, R2β) and (T2α, R1β). These cooperative dimers are an underlying element of allosteric structure upon which other elements of allosteric structure are constructed. These other elements of allosteric structure can be summarized as follows: (i) Enhancement of proximal strain in α-chains; (ii) Introducing steric hindrance to O2-binding by β-chains; (iii) A high affinity of Tstate structures for BPG and a low affinity of Rstate structures for BPG; (iv) Introduction of pH-sensitivity to O2-binding (Bohr Effect): (v) Packaging these elements of structure in a manner supporting respiration in mammals.
The following linked manuscripts address the role of the BPG mediated R to T structural change, a second element of allosteric structure diminishing the O2-affinity of Tstate α-chains and regulating access of O2 to Rstate β-chains. A third element of allosteric structure converts Tstate/BPG complexes to Rstate/BPG complexes in conjunction with conversion of Tstate αO2 chains to Rstate αO2-chains. These elements of allosteric structure by BPG can be shown to account for the characteristic shape of O2-equilibrium binding curves of the binary complex of Hb4 and BPG obtained under conditions of constant pH. A fourth element of allosteric structure, not addressed in experiments conducted at constant pH-values, concerns the rise in pH in the pulmonary circulation and the decrease in pH in the systemic circulation.
Acknowledgement
Francis Knowles would like to acknowledge the help of Professor Glen Lo at Nicholls State University in providing assistance with curve fitting procedures and providing copies of XYCALC. Francis Knowles would to thank Professor Quentin Gibson and the Department of Biochemistry at Cornell University for their hospitality and assistance in elaborating instrumentation for determination of equilibrium binding curves of hemoglobin for O2 (1972-1977). Francis Knowles would like to thank the Department of Chemistry and Biochemistry at UCSD for continuing appointments as a Lecturer and Professors Douglas Magde and Michael Tauber for hosting the author as a Visiting Scholar.
References
- Knowles FC. Determination of equilibrium constants for a sequential model of dioxygen binding by hemoglobin-inositol hexaphosphate complexes: The structural pathway from deoxy-to oxy-hemoglobin. Arch Biochem Biophys. 1985 ;240(1):358-368.
[Crossref] [Google Scholar] [PubMed]
- Knowles FC. Application of 19F NMR spectroscopy to a study of carbon monoxide binding to human hemoglobin modified at cys-β93 with the S-trifluoroethyl residue. Arch Biochem Biophys. 1984;230(1):327-334.
[Crossref] [Google Scholar] [PubMed]
- Adair GS. The oxygen dissociation curve of hemoglobin. J Biol Chem. 1926;63:529-545.
- Andersen ME, Moffat JK, Gibson QH. The kinetics of ligand binding and of the association-dissociation reactions of human hemoglobin: Properties of deoxyhemoglobin dimers. J Biol Chem. 1971; 246(9):2796-2807.
[Google Scholar] [PubMed]
- Edelstein SJ, Rehmar MJ, Olson JS, Gibson QH. Functional aspects of the subunit association-dissociation equilibria of hemoglobin. J Biol Chem. 1970 ;245(17):4372-4381.
[Google Scholar] [PubMed]
- Knowles F. Architecture of allosteric structure. demonstration of the fundamental element of allosteric structure of human hemoglobin. O2-equilibrium binding curve of purified human hemoglobin in an effector-free supporting electrolyte. 2019.
- Perutz MF. Stereochemistry of cooperative effects in haemoglobin, 1970.
- Perutz MF, Fermi G, Luisi B, Shaanan B, Liddington RC. Stereochemistry of cooperative mechanisms in hemoglobin. Cold Spring Harb Symp Quant Biol. 1987 20(9):309-321.
[Crossref] [Google Scholar] [PubMed]
- Knowles FC, Gibson QH. A gas-Liquid equilibration apparatus for quantitative determination of oxygen binding by hemoglobin. Anal Biochem. 1976; 76(2):458-486.
[Crossref] [Google Scholar] [PubMed]
Citation: Knowles F (2023) Allosteric Structure of Effector-free Human Haemoglobin. Biochem Anal Biochem. 12:471.
Copyright: © 2023 Knowles F. This is an open-access article distributed under the terms of the Creative Commons Attribution License, which permits unrestricted use, distribution, and reproduction in any medium, provided the original author and source are credited.