


Indexed In
- Open J Gate
- Genamics JournalSeek
- JournalTOCs
- RefSeek
- Hamdard University
- EBSCO A-Z
- OCLC- WorldCat
- Publons
- Geneva Foundation for Medical Education and Research
- Google Scholar
Useful Links
Share This Page
Journal Flyer

Open Access Journals
- Agri and Aquaculture
- Biochemistry
- Bioinformatics & Systems Biology
- Business & Management
- Chemistry
- Clinical Sciences
- Engineering
- Food & Nutrition
- General Science
- Genetics & Molecular Biology
- Immunology & Microbiology
- Medical Sciences
- Neuroscience & Psychology
- Nursing & Health Care
- Pharmaceutical Sciences
Research Article - (2023) Volume 14, Issue 3
A Data-driven Approach to Revamp the Accountable Care Organizations (ACO) Risk Adjustment Model
Yubin Park*, Kevin Buchan, Jason Piccone and Brandon SimReceived: 28-Apr-2023, Manuscript No. JCRB-23-21165; Editor assigned: 01-May-2023, Pre QC No. JCRB-23-21165 (PQ); Reviewed: 15-May-2023, QC No. JCRB-23-21165; Revised: 22-May-2023, Manuscript No. JCRB-23-21165 (R); Published: 30-May-2023, DOI: 10.35248/2155-9627.23.14.462
Abstract
Accountable Care Organizations (ACOs) involve groups of healthcare providers, who voluntarily come together to deliver coordinated, high-quality care to aligned beneficiaries. Many ACOs, such as the Medicare shared savings program and the ACO REACH program, can participate in alternative payment models that differ from the prevalent Fee-for-Service model. In these alternative payment models, providers and payers share financial risk to align the ACOs’ financial incentives with the dual aims of reducing the total cost of care and improving the quality of care. In other words, ACOs could profit by keeping their patients healthy and preventing unnecessary hospitalization. However, to make this financial structure work as intended, there needs to be a Risk Adjustment (RA) model to change reimbursement proportional to a beneficiary’s risk; otherwise, ACOs may enroll only healthy patients, i.e., adverse selection. While most ACOs adopt RA models for this reason, the original RA methodology has mostly stayed the same over the last several decades. As a result, some ACO participants have found ways to “game” the system: to receive disproportional payments for the risk they bear. To mitigate the waste, the federal government has added various post-adjustment mechanisms, such as mixing the risk-adjusted benchmark with historical spending, adjusting by a coding intensity factor, capping risk score growth rate and incorporating health equity incentives. Unfortunately, those mechanisms build on top of each other in nonlinear and discontinuous ways, causing their actual effects and efficacy to be difficult to disentangle and evaluate. In this paper, we will summarize our lessons from operating one of the most successful ACOs in the nation to help rebuild the RA model based on a data-driven approach. Next, we outline the characteristics of an ideal RA model. Then, we propose a new one that addresses such requirements, eliminating the need for a multi-step process involving nonlinear and discontinuous staging. Finally, we provide experimental results by applying this model to our ACO data and comparing them with the current RA implementation. Our experimental results show that our data-driven approaches can achieve better predictive performances measured in R-squared, Cumming’s Prediction Measure, and Mean Absolute Prediction Error.
Keywords
Risk adjustment; Payment model; Value-based care; Accountable Care Organization (ACOs)
Introduction
In February 2022, the Centers for Medicare and Medicaid Services (CMS) under the Biden-Harris Administration launched a new Accountable Care Organization (ACO) model named ACO Realizing Equity, Access and Community Health [1]. ACO REACH is the latest revision of many ACO models, such as the Global and Professional Direct Contracting (GPDC) model, the Next Generation ACO (NGACO) model, the Pioneer ACO model and the Medicare Shared Savings Program (MSSP) model. The significant difference between the ACO REACH model and the previous models is the emphasis on health equity, granting financial incentives for serving underserved communities. As can be seen, CMS has experimented with various ACO models, addressing and improving on its alignment with ACOs to achieve its goals. However, with every iteration, the underlying financial and risk adjustment models have become more complex.
The ACO REACH model and its predecessors are viable alternative payment models to the prevalent Fee-For-Service (FFS) model for Original Medicare beneficiaries. For instance, CMS reported that one of the ACO models saved $1.66 billion in 2021 [2]. In a traditional FFS reimbursement model, payers, whether CMS or insurance companies, reimburse providers according to a set rate for each service provided. This payment model may incentivize providers to provide more or potentially unnecessary services. Many healthcare economists have pointed out this financial misalignment as the root cause of the rapid increase in healthcare expenditures [3]. On the other hand, a payer and the ACO often share financial risk, leading to financial alignment and accountability. The ACO and its stakeholders, which often include its physicians and healthcare providers, become responsible for their patients’ total cost of care. For example, if an ACO and its affiliated providers can prevent an unnecessary hospitalization event, the payer and the ACO would share the resulting savings in healthcare expenditures. In this way, the payer and the ACO and its constituent healthcare providers become aligned on focusing on preventive and necessary care to help patients stay healthy.
Risk Adjustment (RA) is critical for designing and operating a successful care delivery reimbursement model. As illustrated, an ACO is rewarded for the difference between the projected cost (also known as the “benchmark”) and the actual spending for its aligned beneficiaries. In other words, if the actual spending is less than the projected benchmark cost, the ACO and the payer are able to share in a positive financial outcome. The construction of an appropriate benchmark is nontrivial. A naive approach to constructing a benchmark might be to calculate the average healthcare spend per patient in the overall population and multiply that by the number of patients in an ACO. Although simple, this method of benchmark calculation might incentivize an ACO to recruit healthier patients with below-average healthcare expenditures, leading to outperformance relative to that benchmark. This phenomenon is called adverse selection, which can be mitigated by appropriate RA mechanisms.
The core idea of RA is to adjust the per-capita spending projection based on the patient’s current and previous medical and physical conditions. Patients with multiple chronic conditions would utilize more healthcare services than healthy patients; thus, an ideal RA model would raise the per-capita spending for multi-chronic patients. Over the last few decades, statisticians and healthcare researchers have developed many RA models based on medical claims data. Among those, the Hierarchical Condition Categories (HCC) model, developed by Pope, et al, was widely adopted in various government programs, including the Medicare ACO models and the Medicare Advantage program [4].
An ideal RA model should be able to:
1. Accurately predict future costs.
2. Promote best practices for treating patients so that they can stay healthy.
Under these two requirements, we can make the ACO market fair and reduce any gain/loss by random chance (the first requirement). At the same time, we can encourage providers to do more necessary and preventive services (the second requirement). The latter requirement is also the reason many RA models focus on using diagnosis variables rather than other features, such as procedures and prescription drugs. For example, on using a prescription drug as a model feature, Pope, et al. commented that “prescription drug risk markers might create perverse incentives for influencing treatment patterns to gain in the risk adjustment program” [5]. It is important to note that an ideal RA model should not dictate the details of treatments while rewarding the best outcomes.
The original HCC model met these two requirements in its early days. However, the model has remained mostly the same over the last decades, and many ACO and similar model participants have learned to game the system over time. For example, Kronick and Chua measured how Medicare Advantage organizations tend to over-diagnose their patients to increase RA-related payments [6]. Moreover, Gilfillan and Berwick claimed that the Global and Professional Direct Contracting model, an ACO model, is also part of a similar “risk-score” game as the medicare advantage organizations [7]. The ability for organizations to act in ways to circumvent the original intent of RA not only leads to waste in the Medicare budget, but also substantially over-burdens providers. For example, many payers evaluate providers on how they document diagnosis codes; this could cause providers to face more daily paperwork, which often contributes to physician burnout.
CMS has developed various mechanisms to reduce the effect of the gaming nature of the HCC model in deriving the final benchmark rates (i.e., projected costs), such as mixing the risk- adjusted benchmark with historical spending, adjusting with coding intensity factor, capping the risk score growth rate, and incorporating health equity incentives. But, unfortunately, those mechanisms often build on top of each other in highly nonlinear and discontinuous ways, as seen in Figure C (in the supplemental material section) and their actual effects are difficult to disentangle and evaluate. The complexity of the benchmark calculation has also become a barrier to entry to participating in an ACO program. For these reasons, many healthcare thought leaders such as Chopra, et al. are beginning to discuss the idea of revamping the current RA methodology [8].
In this paper, we will summarize our lessons from operating one of the most successful ACOs in the nation to help rebuild the RA model based on a data-driven approach. Our contributions are as follows:
• We lay out the principles for an ideal RA model
• We propose a framework that meets the principles
• We provide experimental results using our ACO data
• We discuss the potential impacts of the proposed solution
Implementing an actual RA model requires much more rigor and consensus from many stakeholders. However, we hope our proposal serves as a starting point for further discussion and experiments, specifically from the perspective of data scientists.
Hierarchical Condition Categories (HCC)
Currently, the HCC Model serves as the standard RA Model for many Medicare-funded programs, including many ACO models and the Medicare Advantage program. The model originates from the Diagnostic Cost Group (DCG) model by Ash, et al. to accurately and fairly determine the capitation payments for Health Maintenance Organizations (HMOs) [9]. Since then, the DCG model has gone through several upgrades, notably, Hierarchical Coexisting Conditions, Diagnostic Cost Groups and finally, Hierarchical Condition Categories [10,11]. These models all use diagnosis and demographic variables as their input features. However, each iteration provided improved predictive performance covering various corner cases.
The HCC model is not just a predictive model. Pope, et al. intended that the model should bias toward better actions and outcomes in the healthcare market [11]. They designed the model based on ten design principles. We list a few of those that we view as relevant to this paper:
1. Diagnostic categories should be clinically meaningful.
2. Diagnostic categories should predict medical expenditures.
3. The diagnostic classification should not reward coding proliferation.
To see how the HCC model works, we brought an example from the original paper; see Figure A in the supplemental material section. First, we collect all diagnosis codes in a one year span of medical claims for each patient. Next, the algorithm sequentially groups these diagnosis codes into DxGroups (DXGs), Condition Categories (CCs) and Hierarchical Condition Categories (HCCs). The original model has 101 HCCs; however, the details of grouping logic are slightly different from the exact model version. From a machine learning perspective, we view this process as a feature engineering step. Diagnosis codes are too fine-grained; hence, we group those features into something more manageable.
Once the feature engineering is completed, the model calculates the Risk Adjustment Factor (RAF) score (r) via a linear combination of the derived features and coefficients as follows:
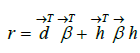
Where  d and
d and  represent the coefficients and feature vector for demographic variables such as age and gender, and
  h and represent the coefficients and feature vector for the HCC variables.
The risk score, the output from the HCC model, is then further post processed to calculate the final benchmark rate in order to reduce the effect of behaviors designed specifically to maximize benchmarks that do not correspond to actual improvements in healthcare delivery.
BENCHMARK=r x growthCap(r) x retroAdj x ...
For example, in some models, risk score growth from the previous year is capped at 3%, and the capped risk score is then mixed with historical spending. Over many years, payers have deployed many non-linear treatments to derive the final benchmark amounts. However, from a machine learning perspective, the act of publishing the model specifications itself may cause the underlying data to shift, i.e., dataset shift. Rather than applying various non-linear transformations in a post processing step, the most straightforward solution may be to update model coefficients directly.
Health equity indices
The most significant healthcare agenda in the Biden-Harris Administration is arguably “health equity” [12]. Accelerated by the COVID pandemic in 2020, disparities in access to quality healthcare resulted in a substantial loss of lives in the United States of America. Furthermore, data shows that healthcare providers in traditionally underserved communities are less likely to participate in value-based care programs, such as ACO programs, which would be a barrier to bending the healthcare expenditure growth rate [13].
To combat such problems, CMS designed the latest version of the ACO model, ACO REACH, to increase participation in high- quality, accountable care delivery to underserved communities via a new benchmark adjustment mechanism named the Healthcare Equity Benchmark Adjustment (HEBA) [14]. In a nutshell, HEBA intends to increase the benchmark for healthcare expenditures associated with beneficiaries in underserved communities by combining a beneficiary’s Area Deprivation Index (ADI) and dual-eligible Medicaid Status to determine an overall score. If the combined score is in the top decile, there is a positive adjustment of $30 Per Beneficiary Per Month (PBPM) to the benchmark; if in the bottom half, there is a negative adjustment of $6 PBPM.
This solution may in broad strokes yield the desired realignment of resources to achieve health equity goals. However, health equity is a multidimensional problem, and discontinuous and nonlinear models such as that presented above may not accurately or fairly capture the true impact of various elements of health inequity on a beneficiary’s risk profile. A more straightforward, concise, and quantitative representation of the problem is needed. Many countries and researchers have developed various health equity indices, of which ADI is one [15]. Other health equity indices include the Social Vulnerability Index (SVI), developed by Flanagan, et al. and the Social Deprivation Index (SDI), developed by Robert Graham Center-Policy Studies in Family Medicine and Primary Care [16,17]. These indices all use census data and attempt to infer individuals’ socioeconomic levels based on their home addresses. However, the resulting indices vary depending on their data engineering and applied algorithms. For example, Park, et al. and Knighton, et al. found that ADI heavily correlates with housing values compared to other indices [18,19].
Rather than adjusting the benchmark in a post hoc fashion, a more fundamental approach is to solve for appropriate benchmark adjustments due to health equity within the RA model itself. For example, Zink and Rose estimated the coefficients of an RA model that is more accurate for Mental Health and Substance Use Disorders (MHSUD) population [20]. They formulated new objective functions focusing on the underserved group’s goodness-of-fit and used convex optimization techniques to derive new coefficients. Although the mathematical methods may seem more complicated, this approach is more data-driven and more straightforward to analyze than setting an arbitrary incentive adjustment amount or applying any number of non-linear and/ or discontinuous adjustments in a post processing step, our work follows a similar path.
Materials and Methods
Principles for an ideal RA model
Following the ten design principles that guided the development of the HCC model, we outline our seven design principles for an ideal RA model:
1. The model should be accurate in predicting future costs (P1)
2. The model should not encourage specific treatment patterns (P2)
3. The model should be flexible to take in more input variables (P3)
4. The model should be easy to share and run (P4)
5. The model should be able to auto-correct over-diagnosed or under-diagnosed cases (P5)
6. The model should update as frequently as possible (P6)
7. The model should utilize the existing data infrastructure as much as possible (P7)
It has been more than two decades since the original HCC model was introduced. Since then, there has been substantial development in machine learning and artificial intelligence research. Furthermore, the amounts and types of data available to such algorithms have significantly increased. Many of the new principles owe to the recent ground-breaking progress in computing technologies.
Chopra, et al. a former Chief Technology Officer of the United States of America, also provided similar thoughts on revamping the RA model as follows [8]:
Odernize the CMS-HCC risk-adjustment model paradigm by taking advantage of advancements in applied technologies (for example, advancements in predictive analytics or digital health records) that incentivize better care over coding in value-based models.
These principles could lower the barrier of entry to the ACO model while reducing some of the misaligned behavior present in the current program.
Our approach
The challenge of building an ideal RA model is that the model must be more than just a predictive one. It needs to satisfy other requirements while being able to produce reasonably accurate cost predictions (Figure 1).
To meet the principles we laid out, we propose a new RA framework as shown in Figure 1. The proposed framework utilizes many existing data infrastructures, such as the derived HCC from the diagnosis variables, the RAF scores from the HCCs, historical spending, demographic variables, and health equity variables derived from the demographic variables. We can minimize administrative burden, improve familiarity by all stakeholders, and improve model stability even on smaller datasets by using the same input variables as in the existing RA framework (P7). Also, the framework does not encourage specific treatment patterns as it does not use medication or procedure variables (P2). Modeling all of the input variables together, using well-known machine learning algorithms, allows for higher predictive accuracies (P1) as well as simple, quantitative expansions of the model to incorporate new datasets or input variables as necessary (P3).

Figure 1: Proposed framework for machine learning models.
The remaining principles P4, P5, and P6, affect the choice of machine learning models we should use. To easily share and run the models, the models need to be widely available in different machine learning toolkits. In addition, such models must be time-tested and the model parameters must be compact. Based on these observations, we decided to select three machine learning models: ElasticNet, RandomForests and XGBoost are one of the most popular implementations of Gradient Boosting Machine by Friedman [21-24]. We did not include deep-learning models as their parameter spaces tend to be massive, and tree-based models, such as RandomForests and XGBoost, often still outperform deep-learning Figure 1: Proposed framework for machine learning models. models at least for tabular data [25].
Framework walk-through
The most significant difference between the current RA model and the proposed model is that the proposed model has everything in one calibration layer (the Machine Learning layer). In contrast, the current model consists of many non-linear transformation layers sequentially built on each other, where each layer’s effect is difficult to untangle from each other. For example, the current model requires many post-processing steps after calculating the RAF score, such as multiplying the coding intensity factor, bracketing the growth rate, mixing with historical spending, and adjusting the final rates based on ADI and dual-eligible status in a discontinuous way. On the other hand, the proposed model takes all these input variables and applies coefficients derived directly from the data, rather than through an arbitrary set of adjustments. This makes analyzing and auditing the interactions and correlations between the features and the predicted output easier (Table 1).
| Feature | Coeff |
|---|---|
| Cost | 0.351 |
| RAF | 2921.18 |
| ADI National Rank | 40.59 |
| Percent Black | 10438.87 |
Table 1: Example Coefficients from an ElasticNet.
Let’s walk through an example with ElasticNet in Table 1. We estimated the coefficients in the table from one of the ElasticNet models we trained. Suppose we have a male patient whose total cost of care this year was $10,000, and the RAF score was 1. Furthermore, his ADI national rank is at the 50th percentile and he lives in an area where half of the neighbors are black. This profile gives that his next year’s spending would be:
$13, 669/year=0.35 × 10, 000+2, 921 × 1+40.59 × 50+10, 438×0.5
What if he lived in an area where everybody was black and ADI was at the 100th percentile?
$20, 918/year=0.35 × 10, 000+2, 921 × 1+40.59 × 100+10, 438 × 1
The resultant estimates are different from the current RA model. For example, many ACO models use a 65% weight on historical spending, while the data-driven model weighs the variable only 35%. Moreover, the HEBA incentive provides $30 per month, which equates to only an additional $360 per year. However, as the above example shows, patients in underserved communities can cost thousands of dollars more; $360 is not even close to filling the gap and may result in further systemic underinvestment in underserved communities.
Implications for health equity
Achieving health equity is not just the current administration’s top agenda but one of the most critical generational problems. Therefore, our proposed framework incorporates various health equity indices as its inputs (the P3 principle). However, even seemingly neutral technology may have unintended consequences for health equity. For example, Seyyed-Kalantari, et al. found that state-of-the-art radiology diagnostic technologies consistently underdiagnosed underserved populations, which can lead to unequal access to timely treatment. In this case, technologies are accelerating the divergence of access to care and treatment [26].
Thus, we seek to clarify the health equity implications of our proposed model in the context of our ideal RA model.
First, we highlight that RA models predict future healthcare costs due to the ACO model design. Like other CMS value-based care programs, the three-part aims determine ACO’s success:
1. Better care for individuals
2. Better health for populations
3. Lower cost
Quality and outcome measures are used to assess the first two aims, such as HEDIS by NCQA. RA models are necessary to accurately and fairly assess the final aim, which relates to our P1 principle. Thus, to jointly satisfy all three aims, we need to evaluate each aim fairly while maintaining the right balance among the aims.
Second, RA models are predictive payment models, not clinical decision support models. RA models intend to set the accurate cost benchmark but should not promote specific treatment patterns (our P2 principle). This is important as demonstrated that using costs as representative outcomes can exacerbate disparities [27]. Furthermore, acknowledging the difference between the two is critical for interpreting the model coefficients. For example, in Table 2, living in high ADI areas does not “cause” higher healthcare costs; instead, the model says that people in high ADI areas tend to have higher healthcare costs. Of course, one can build a causal inference model using observational data [28], which may provide deeper insights into the relationship between SDoH variables and healthcare costs. However, such models require identifying treatment variables and carefully examining eligibility criteria for each treatment variable. It is impractical when the current RA model inputs are primarily demographic and descriptive variables. RA models should be interpreted at a population level as they are predictive payment models that rely on the law of large numbers.
| Model and Description | R2 | CPM | MAPE | PR |
|---|---|---|---|---|
| lm_basic, Linear Regression (LR) with RAF | 0.130 | 0.149 | 12628 | 0.985 |
| lm_cost, lm_basic plus the cost variable | 0.197 | 0.242 | 11259 | 0.919 |
| lm_adi, lm_cost plus the ADI variable | 0.195 | 0.265 | 10905 | 0.866 |
| lm_sdi, lm_cost plus the SDI variable | 0.197 | 0.242 | 11258 | 0.919 |
| rp_cp01, Decision Tree (simple) | 0.172 | 0.258 | 11010 | 0.828 |
| rp_cp001, Decision Tree (complex) | 0.143 | 0.264 | 10924 | 0.864 |
| enet_min, ElasticNet (ENet, best cross-validated) | 0.198 | 0.279 | 10706 | 0.840 |
| enet_1se, ENet (conservative estimation) | 0.177 | 0.224 | 11518 | 0.878 |
| enet_pos_min, ENet with Positive Coeffs. (best CV) | 0.200 | 0.266 | 10893 | 0.873 |
| enet_pos_1se, ENet with Pos. Coeffs. (conservative) | 0.170 | 0.219 | 11598 | 0.870 |
| rf_max16, RandomForests with 16 nodes | 0.186 | 0.264 | 10931 | 0.851 |
| rf_max32, RandomForests with 32 nodes | 0.194 | 0.280 | 10685 | 0.839 |
| rf_max64, RandomForests with 64 nodes | 0.196 | 0.283 | 10645 | 0.842 |
| xgb_n200, XGBoost with 200 iterations | 0.185 | 0.298 | 10426 | 0.826 |
| xgb_n100, XGBoost with 100 iterations | 0.195 | 0.299 | 10400 | 0.830 |
Table 2: Predictive Performance of Various RA Models.
Finally, our proposed framework embeds a few fundamental principles for designing ethical machine learning algorithms. For example, McCradden, et al. emphasized transparent and robust auditing processes for the algorithm outputs and a collaborative decision-making process engaging diverse stakeholders [29]. Similarly, Chen et al. remarked on the importance of output audits and human-in-the-loop feature selection processes [30]. As the current RA model consists of many sequential non-linear steps, it is often challenging to evaluate why the cost prediction is high or low. It can be due the past costs or a new coding intensity factor, but there is no easy way to tell as they are applied one after the other. Our proposed framework reduced those various steps into one layer, where users can easily map the relationships between inputs and output, which relates to our P4 principle. Furthermore, our P3 and P6 principles allow diverse stakeholders to engage and update any unintended pitfalls as quickly as possible.
We view our proposed framework as a work in progress rather than a final form of the ideal RA model. Moreover, our framework is a significant step forward from the current RA model in achieving health equity.
Results
Dataset
Our dataset contains the medical claims for our ACO patients between 2019 and 2022. The claims in 2019, 2020 and 2021 were used as the training set, and the claims in 2021 and 2022 were used as the test set. The task is to predict future costs; therefore, the target variable comes from one year in the future relative to the feature variables. For example, in the test set, we created the input features based on the claims in 2021 and made the target variable based on the claims in 2022, i.e., the total cost in 2022. To protect the anonymity of the submission, we do not provide the details of the dataset, but we will deliver the details, such as the volume of patients, our ACO coverage areas, etc., once accepted.
Evaluation metrics
We use these four metrics that are widely used to evaluate RA models [31]:
R-squared (R2), also known as Coefficient of Determination, is the proportion of total variance of the target variable explained variance by the model. The exact formula is as follows:
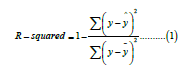
Where y represents the target variable, in our case, the next year cost and ȳ and ŷ are the average of the next year cost and the predicted next year cost by the model, respectively. The value ranges from 0 to 1, where 1 means the perfect prediction.
Cumming’s Prediction Measure (CPM) is similar to R-squared but uses absolute error instead of squared error. Using the absolute error mitigates the effect of large errors. The metric’s formula is as follows:
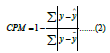
Where the same notation is used as in R-squared, the value ranges from 0 to 1, where 1 means the perfect prediction.
Mean Absolute Prediction Error (MAPE) is similar to CPM but is the average error rather than the explained variance ratio,
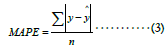
where n represents the total number of samples. MAPE has no upper bound, and the lower, the better.
Predictive Ratio (PR) differs from the above three metrics; it measures the budget-level performance. It compares the total predicted dollar amount versus the total actual dollar amount:
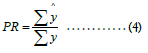
PR needs to be close to one for an ideal case. PR less than 1 indicates the model predicted lower than the actual on average.
These four metrics highlight slightly different aspects of model performance. In practice, many RA models, such as CMS- HCC and HHS-HCC [4,5], primarily focus on improving the R-squared metric, and other metrics are used to understand the model characteristics better. Therefore, we use these traditional metrics to compare the proposed framework with the current one. However, with the growing emphasis on health equity in industry and academia, evaluation metrics must evolve to assess the model performance fairly, such as (sub) group-level statistics rather than population-level statistics [30]. We leave this as our future work.
Models
Earlier, we recommended three machine learning models to use in our framework: ElasticNet, RandomForests, and XGBoost.
However, these three models are initial picks, not the final roster. We should experiment with many other machine learning models while meeting the principles we laid out.
On top of the three models, we added two simple algorithms to compare. They are linear regression and decision tree algorithms. We used these algorithms to show the baseline performance, as their performance and design are comparable to the current RA implementation.
The complete list of the models in our experiments is as follows:
lm_basic: The first model is a linear regression with only one variable, the RAF score, with an intercept. This model mimics the current RA implementation to some degree. The intercept and the coefficient for the RAF score would track the inflation trend and the geographic rate for the region.
lm_cost: The second model is an extension of the first model with the cost variable. The model should mimic the mix of historical spending and risk-adjusted geographic rates. The performance of this model is usually better than the first one, as the historical cost is one of the most indicative variables for the future cost. Furthermore, the predictive performance of this model tends to be higher than the current RA implementation, as the weight for the historical cost variable is set by the data rather than an arbitrary 65%.
lm_adi, lm_sdi: The following two models add Health Equity Indices to the second model, ADI and SDI. These models reflect the cost impact of socioeconomic status.
rp_cp01, rp_cp001: We add two decision tree models, “rpart” in the R programming language, varying its complexity parameters. The simple tree, rp_cp01, only uses the cost variable, while the complex tree, rp_cp001, uses other variables, such as the RAF score and other HCCs.
enet_: We apply ElasticNet with two settings; one with no constraint on the coefficients and the other with a positive constraint (enet_ pos_). In practice, negative coefficients are difficult to interpret. As we curated many variables that may increase future spending, the negative coefficients are often due to confounding and correlation effects. For each setting, we present two sub-versions: one with the minimum error estimate (_min) from cross-validation and a more conservative estimate (_1se) that potentially resists overfitting.
rf_: We trained RandomForests with three settings-16 nodes base trees (rf_max16), 32 nodes base trees (rf_max32), and 64 nodes base trees (rf_max64). As the base tree is a binary tree, 64 nodes translate to a complete tree with a depth of 5. We used 100 base trees for all three settings.
xgb_: Lastly, we applied XGBoost with two settings, one with 200 iterations (xgb_n200) and the other with 100 iterations (xgb_n100). Again, it’s because Gradient Boosting can overfit as the number of iterations increase. We used the base trees with a maximum depth of 4 and a learning rate of 0.1.
We present various hyperparameter settings for illustration purposes; to show the data’s characteristics, complexity, and overfitting nature. In practice, we need to extensively search their hyperparameter spaces to find the best model.
Discussions
Before presenting our full experimental results, we want to illustrate some characteristics of predicting the future cost. Figure 2 shows the coefficient path plot from one of the ElasticNet models we trained. The exact coefficient paths are slightly different based on the settings, but the prominent trend remains the same. The plot shows the coefficient values as the ElasticNet model relaxes its regularization strength (from left to right). The first coefficient to pick up is usually the cost variable, and the next is the RAF score. Often other health equity indices follow the paths of these two variables. Furthermore, the top variables from the XGBoost model with 100 iterations (xgb_n100) are Cost, RAF, Age, HCC23, Percent Black and Percent High Needs. As can be seen, the selected variables are similar to the results from the ElasticNet coefficient paths.

Figure 2: Coefficient Paths from the ElasticNet model. The x-axis represents the strength of the L1 Norm. Note: ( ) Cost; (
 ) RAF; (
 )
HCC23; (
)
HCC23; ( ) ADI National Rank; (
 ) ADI State Rank.
We summarize these observations as follows:
• The original HCC model and the RAF score are still very “relevant” in predicting the future cost.
• The historical cost has a significant momentum for the future cost.
• Socioeconomic variables have non-negligible impacts when predicting future costs.
These findings indirectly justify all the CMS’ efforts in mixing the historical spending and adding health equity adjustments. But unfortunately, the current implementation needs more justification for quantifying these variables. Through our data-driven approach, we can scientifically estimate the complex interactions of these variables (Figure 2).
As can be seen, the machine learning models exhibit superior predictive performance on three metrics, R-squared, CPM, and MAPE. Unfortunately, the baseline model has the highest PR. We believe this is due to the timeframe of our dataset. The training dataset comes from the right in the middle of the pandemic. During the pandemic, although the Intensive Care Units usages skyrocketed, the utilization rate of many elective surgeries and basic services was lower than usual; hence overall healthcare spending was lower during the pandemic. We did not adjust the machine models to account for this specific condition, which is why the PR values are lower for the machine learning models (Table 2).
The best-performing model is xgb_n100, XGBoost with 100 iterations, marking the best score in CPM and MAPE and reasonably close to the top score on R-squared. The result is not surprising, as XGBoost has consistently outperformed many machine learning models in various predictive tasks [23]. Noticeably, the ElasticNet with the positive coefficient constraint performed the best in terms of the R-squared metric. This result is encouraging because the coefficients of ElasticNet are perhaps the most approachable, as it is equivalent to a linear model. If we want to aim for the best predictive accuracy, we can use XGBoost; otherwise, if we’re going to disrupt the infrastructure minimally, we can choose ElasticNet.
One of the main reasons to reform the RA model is to reduce the prevalence of actions taken specifically for the purpose of increasing benchmarks with no value to high-quality care delivery. A part of the “gaming” that occurs comes from the subjective nature of documenting specific diagnosis codes for a particular timeframe.In practice, many providers need to review past documented diagnosis codes and provide the same documentation repeatedly. This practice can result in two adverse effects: over-diagnosis and paperwork burden. To reduce these adverse effects, Chopra, et al. proposed propagating chronic condition documentation without needing to re-document every time [8].
We believe that good machine-learning models should be able to identify the relationships between variables and infer any missing covariates. So, for example, the data should tell that patients in underserved communities tend to miss visits with their doctors, and hence their records show many missing diagnosis codes. For such cases, the model should be able to identify the relationship and adjust its prediction for future spending. To test this hypothesis, we ran another set of experiments. We prepared a new dataset in which we propagated forward in time all chronic condition HCCs; we did not propagate acute conditions such as sepsis. For example, if a patient had HCC19-Diabetes without Complications in 2019, we imputed the dataset to have the same HCC in future years, even without any future documentation. This dataset would be the equivalent of healthcare providers in the dataset documenting the same chronic condition in all their patients each future year without fail once the condition is detected in a given year.
Table B in the supplemental material section shows the results from the additional experiment. The results are, in fact, surprising. The performance of the baseline model improved. However, the performance of the machine learning models either remained the same or degraded. We believe there are two reasons. First, the size of the training dataset shrank as we needed to propagate the diagnosis for the following year. In other words, we needed to throw away one-year records. Another reason is that the propagated chronic conditions do not add much information to the models, as such relationships are already embedded in the models. Although we need deeper investigation on this topic, it is promising that the machine learning models can auto-correct over-and under-diagnosis cases.
Conclusion
This paper summarized our lessons from operating one of the most successful ACOs in the nation to help rebuild the RA model based on a data-driven approach. We, then, outlined the principles for an ideal RA model and proposed a framework to address such requirements. Finally, we provided experimental results using our ACO data to support our proposed framework.
Although our results are promising, we must verify that the proposed approach can produce similar results with larger datasets. Such datasets would include the IBM Marketscan Research Database and other ACO datasets. Another route is to partner with companies that have the CMS innovator license to access the entire Medicare Fee-For-Service (FFS) data.
With larger datasets, we also must carefully lay out the appropriate computing platforms. Fortunately, many open-source projects in distributed computing, such as Hadoop and Spark, enable large-scale data management and training in advanced machine learning algorithms. Moreover, it would allow us to adapt the models with various inputs and estimate the model parameters as quickly as possible. We would be able to adapt the models before program participants have the opportunity to engage in non-useful behaviors. The most straightforward path to defend against data shift is to update the underlying models as quickly as possible in a reasonable and prospective fashion.
The RA model has been under much scrutiny due to its abuse in the industry. However, RA still plays a critical role in the design of an aligned and effective reimbursement model; for example, we cannot prevent adverse selection in many value-based care programs without RA. Therefore, we must embrace that we need to enhance the RA model more accurately and make it difficult to game. This paper outlines a path using a data-driven, objective approach, but we must work in all aspects to implement a truly fair reimbursement system which aligns payers and providers in their combined mission to provide high-quality, accessible healthcare to all.
Declarations
Data and code availability
We used our ACO’s Claim and Claim Line Feed (CCLF) files received from the Centers for Medicare and Medicaid Services (CMS). The data is not and will not be publicly available. We included our code as supplemental material and will make our code available when the paper is accepted.
Institutional Review Board (IRB)
The data is collected for administrative purposes, and the research is designed for the quality evaluation and improvement of the existing payment model. This research does not require IRB approval.
Conflict of Interest Statement
The authors are executives and employees at Apollo Medical Holdings, Inc. which operates an Accountable Care Organization in the California market.
Authors Contribution Statement
Yubin Park wrote the main manuscript text. Kevin Buchan Jr., Jason Piconne and Brandon Sim were heavily involved in discussions and enhancement of the main idea. All authors reviewed the manuscript.
References
- Park Y, Everhart E, Buchan KP, Sim B. Chopra A: A proposal to enhance the health equity benchmark adjustment in ACO REACH. 2022.
- Medicare shared savings program saves medicare more than $1.6 billion in 2021 and continues to deliver high-quality care. Press release, Centers for Medicare and Medicaid Services. 2022.
- Zuvekas SH, Cohen JW. Fee-for-service, while much maligned, remains the dominant payment method for physician visits. Health Aff. 2016;35(3):411-414.
[Crossref] [Google Scholar] [PubMed]
- Pope GC, Ellis RP, Ash AS, Ayanian JZ, Bates DW, Burstin H, et al. Diagnostic cost group hierarchical condition category models for Medicare risk adjustment. Health Econ. 2000.
- Pope GC, Pearlman A, Ingber MJ, Kautter J, Drury K, Amin K, et al. Incorporating prescription drugs into affordable care act risk adjustment. Med Care. 2020;58(6):504-510.
[Crossref] [Google Scholar] [PubMed]
- Kronick R, Chua FM. Estimating the Magnitude of Medicare Advantage Coding Intensity and of the Budgetary Effects of Fully Adjusting for Differential MA Coding. SSRN.2021.
- Gilfillan R, Berwick DM. Medicare advantage, direct contracting and the medicare â??money machine,â?? part 1: The risk-score game. Health Aff. 2021.
[Crossref]
- Chopra A, Boehler A, Bacher G. Risk Adjustment: Itâ??s Time For Reform. Health Aff. 2023.
- Ash A, Porell F, Gruenberg L, Sawitz E, Beiser A. Adjusting Medicare capitation payments using prior hospitalization data. Health Care Financ Rev. 1989;10(4):17.
[Google Scholar] [PubMed]
- Ellis RP, Pope GC, Iezzoni LI, Ayanian JZ, Bates DW, Burstin H, et al. Diagnosis-based risk adjustment for Medicare capitation payments. Health Care Financ Rev. 1996;17(3):101.
[Google Scholar] [PubMed]
- Ash AS, Ellis RP, Pope GC, Ayanian JZ, Bates DW, Burstin H, et al. Using diagnoses to describe populations and predict costs. Health Care Financ Rev. 2000;21(3):7.
[Google Scholar] [PubMed]
- LaSure BC, Fowler E, Seshamani M, Tsai D. Innovation at the centers for medicare and medicaid services: A vision for the next 10 years. Health Aff.2021.
[Crossref]
- Yasaitis LC, Pajerowski W, Polsky D, Werner RM. Physiciansâ?? participation in ACOs is lower in places with vulnerable populations than in more affluent communities. Health Affairs. 2016;35(8):1382-1390.
[Crossref] [Google Scholar] [PubMed]
- Anokwa K, Kozlowski Y, Welsh P. Aco realizing equity, access, and community health (reach) model, health equity updates webinar. CMS.2022.
- Phillips RL, Liaw W, Crampton P, Exeter DJ, Bazemore A, Vickery KD, et al. How other countries use deprivation indicesâ??and why the United States desperately needs one. Health Aff. 2016;35(11):1991-1998.
[Crossref] [Google Scholar] [PubMed]
- Flanagan BE, Gregory EW, Hallisey EJ, Heitgerd JL, Lewis B. A social vulnerability index for disaster management. J Hom Sec Emer Manag. 2011;8(1).
- Robert Graham Center-Policy Studies in Family Medicine&Primary Care: Social Deprivation Index (SDI).2018.
- Park Y, Buchan K, Piconne J, Sim BA Data-driven Approach to Revamp the ACO Risk Adjustment Model. 2022.
- Knighton AJ, Savitz L, Belnap T, Stephenson B, VanDerslice J. Introduction of an area deprivation index measuring patient socioeconomic status in an integrated health system: implications for population health. EGEMs. 2016;4(3).
[Crossref] [Google Scholar] [PubMed]
- Zink A, Rose S. Fair regression for health care spending. Biometrics. 2020;76(3):973-982.
[Crossref] [Google Scholar] [PubMed]
- Zou H, Hastie T. Regularization and variable selection via the elastic net. J R Stat Soc B Stat Methodol. 2005;67(2):301-320.
- Breiman L. Ran dom forests. Machine learning. 2001;45:5-32.
- Chen T, Guestrin C. Xgboost: A scalable tree boosting system. In Proceedings of the 22nd acm sigkdd international conference on knowledge discovery and data mining. 2016;785-794.
- Friedman JH. Greedy function approximation: a gradient boosting machine. Ann Stat. 2001:1189-1232.
- Grinsztajn L, Oyallon E, Varoquaux G. Why do tree-based models still outperform deep learning on tabular data? NeurIPS Datasets and Benchmarks.
- Seyyed-Kalantari L, Zhang H, McDermott MB, Chen IY, Ghassemi M. Underdiagnosis bias of artificial intelligence algorithms applied to chest radiographs in under-served patient populations. Nature medicine. 2021;27(12):2176-2182.
- Obermeyer Z, Powers B, Vogeli C, Mullainathan S. Dissecting racial bias in an algorithm used to manage the health of populations. Science. 2019;36(64):447-453.
- Hernán MA, Robins JM. Using big data to emulate a target trial when a randomized trial is not available. Am J Epidemiol. 2016;183(8):758-764.
- McCradden MD, Joshi S, Mazwi M, Anderson JA. Ethical limitations of algorithmic fairness solutions in health care machine learning. The Lancet Digital Health. 2020;2(5):221-223.
- Chen IY, Pierson E, Rose S, Joshi S, Ferryman K, Ghassemi M. Ethical machine learning in healthcare. Annu Rev Biomed Data Sci. 2021;4(2):123-144.
- Ellis RP, Hsu HE, Siracuse JJ, Walkey AJ, Lasser KE, Jacobson BC et al. Development and Assessment of a New Framework for Disease Surveillance, Prediction, and Risk Adjustment: The Diagnostic Items Classification System. InJAMA Health Forum. 2022;3(3):220276-220276. American Medical Association.
Citation: Park Y, Buchan K, Piccone J, Sim B (2023) A Data-driven Approach to Revamp the ACO Risk Adjustment Model. J Clin Res Bioeth. 14:462.
Copyright: © 2023 Park Y, et al. This is an open access article distributed under the terms of the Creative Commons Attribution License, which permits unrestricted use, distribution, and reproduction in any medium, provided the original author and source are credited.