
Indexed In
- Academic Journals Database
- Open J Gate
- Genamics JournalSeek
- JournalTOCs
- China National Knowledge Infrastructure (CNKI)
- Scimago
- Ulrich's Periodicals Directory
- RefSeek
- Hamdard University
- EBSCO A-Z
- OCLC- WorldCat
- Publons
- MIAR
- University Grants Commission
- Geneva Foundation for Medical Education and Research
- Euro Pub
- Google Scholar
Useful Links
Share This Page
Open Access Journals
- Agri and Aquaculture
- Biochemistry
- Bioinformatics & Systems Biology
- Business & Management
- Chemistry
- Clinical Sciences
- Engineering
- Food & Nutrition
- General Science
- Genetics & Molecular Biology
- Immunology & Microbiology
- Medical Sciences
- Neuroscience & Psychology
- Nursing & Health Care
- Pharmaceutical Sciences
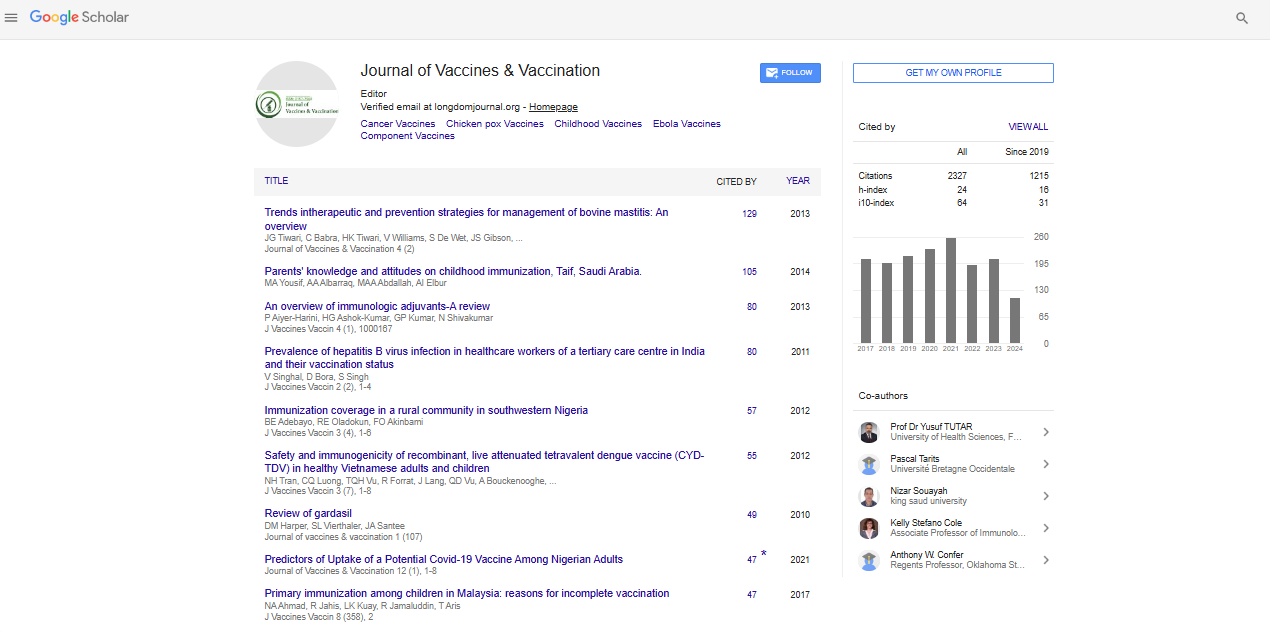
Research Article - (2021) Volume 12, Issue 2
A COVID-19 Transmission Model Informing Medication Development and Supply Chain Needs
Annabelle Lemenuel-Diot1*, Barry Clinch2, Aeron C. Hurt3, Paul Boutry3, Johann Laurent1, Mathias Leddin1, Stefan Frings3 and Jean Eric Charoin32Roche Products Ltd, Welwyn Garden City, United Kingdom
3F. Hoffmann-La Roche AG, Basel, Switzerland
Received: 10-Feb-2021 Published: 04-Mar-2021, DOI: 10.35248/2157-7560.21.12.450
Abstract
Objective: We present a country-specific, modified Susceptible, Exposed, Infectious, and Removed (SEIR) model of SARS-CoV-2 transmission aiming to provide accurate prediction of COVID-19 cases to optimize clinical trial recruitment, inform mitigation strategies, and facilitate rapid medication development.
Methods: Epidemiological data from more than 170 countries were obtained from the Johns Hopkins University COVID-19 Dashboard. Intercountry differences in initial exposure, cultural/environmental factors, and stringency of mitigation strategies were incorporated. Asymptomatic patients and “super-spreaders” were also factored into our model. Simulations were limited to a period of 2 months considering that the effects of certain parameters (e.g. seasonality of virus transmission, wearing of face masks, and deployment of vaccines) were sufficiently ambiguous to limit confidence in a longer simulation period.
Results: Using these data, our model estimated 71.5% of cases as asymptomatic. Without mitigation, a mean maximum infection rate of 1.08 cases/day (Intercountry range, 0.68–1.65) was estimated in symptomatic cases. From here, symptomatic and asymptomatic people were estimated to infect 3.39 and 7.71 other people, respectively, suggesting that asymptomatic persons could be responsible for 85% of new infections. An estimated 10.6% of cases were super-spreaders with a 2.86-fold higher transmission rate than average. Mitigation strategies with a stringency index value of ≥ 45% were estimated to be required to reduce the reproduction ratio below 1 for symptomatic cases. Simulated cases over the next 2 months differed between countries, with certain countries (eg, Argentina and Japan) likely to experience an accelerated accumulation of cases.
Conclusion: Together, results from our model can guide the distribution of diagnostic tests, impact clinical trial development, support medication development and distribution, and inform mitigation strategies to reduce COVID-19 spread. The large contribution of asymptomatic cases in the transmission also suggests that measures such as wearing masks, social distancing, testing, and vaccination deployment are foundational to slowing the spread of COVID-19.
Keywords
Coronavirus; COVID-19; Infectious disease; Epidemiology; Mathematical modeling; Pandemic; SEIR model
Introduction
As of January 31, 2021, the coronavirus disease 2019 (COVID-19) first reported in Wuhan, China, in December 2019 had resulted in more than 100 million confirmed cases globally, with infections continuing to spread [1]. This unprecedented pandemic has presented unique challenges for medical professionals, biomedical researchers, governmental and nongovernmental organizations, and members of the pharmaceutical industry, each of whom has shown an unwavering commitment to patient care and support [2,3]. Specifically, the pharmaceutical industry has increased efforts to research, develop, register, and make available solutions ranging from antiviral agents to therapies for complications of COVID-19 in record speed while also carefully managing supply lines and manufacturing sites for existing medications in high demand for the general treatment of patients with COVID-19 [4].
To support clinical trial recruitment, medication development, medication supply, and distribution strategies, it is vital for the pharmaceutical industry, national and multinational organizations, governments, and nongovernmental organizations to understand the epidemiological concept of virus transmission, the patterns and implications of Severe Acute Respiratory Syndrome Coronavirus 2 (SARS-CoV-2) viral spread, and the impact of different Non Pharmaceutical Interventions (NPIs) proposed as mitigation strategies on local, national, and international levels [5,6]. Specifically, the ability to accurately project the number of expected cases in each country over time could assist in selecting clinical trial sites with good potential for rapid patient recruitment and medication development. Furthermore, this information could guide the fair and equitable distribution of diagnostic tests, treatment options, and vaccines.
The basic reproduction number (R0) for SARS-CoV-2 infection before the implementation of mitigation strategies is estimated to range from approximately 2.0 to 3.6 [7-12], with a high risk for transmission because of high numbers of asymptomatic subjects and emerging clusters [13-15]. Transmission models based on realworld epidemiological data are important tools for understanding the dynamics of SARS-CoV-2 transmission and can be useful to guide mitigation strategies and policy decisions designed to assist patients with COVID-19 and reduce disease spread [9,16-21].
Mitigation strategies with NPIs have been effective in helping to curb the spread of SARS-CoV-2 and in reducing the Reproduction Ratio (RR) [12,22], though these are likely hindered by the relatively high proportion of asymptomatic cases of COVID-19 [15,23,24]. Although the magnitude of infectiousness in asymptomatic patients (ie, when the infector has no symptoms throughout the course of the disease) is difficult to quantify, these cases are expected to heavily impact transmission dynamics [25,26]. Indeed, non–peerreviewed mathematical modeling studies highlight the importance of accounting for asymptomatic persons when describing transmission dynamics [27,28]. As such, this analysis could support public health considerations and suggests, by quantifying their contributions, that asymptomatic persons may be major drivers of the COVID-19 pandemic. Unless asymptomatic persons happen to get tested, they may continue to socialize and work during the entire infectious period, in contrast to situations in which the vast majority of people are symptomatic and can be identified without testing and can also rapidly quarantine.
Although some components of viral transmission (eg, proportions of asymptomatic and “super-spreader” cases, duration of latency, presymptomatic and post symptomatic infectious periods, and duration of infectiousness) are likely to be consistent across countries, other components affecting patterns of viral spread are expected to differ between countries, further complicating potential models of viral transmission. In addition, cases of COVID-19 are not uniformly distributed within a country; rather, they are located primarily in “hotspots” of various sizes that, without mitigation, merge and grow, potentially including the entire population [29-31]. A proportion of super-spreaders have also been reported in the COVID-19 population, and a limitation of classical models is the use of mean parameter values across the population even though different persons may have different disease characteristics (eg, viral load, infection rate, duration of symptoms). Additional proposed modeling approaches could account for super-spreader profiles by differentiating this type of case and estimating specific transmission characteristics of super-spreaders.
Although several epidemiological transmission models exist, our model is the first to clearly quantify the effect of NPIs on COVID-19 transmission in individual countries while also accounting for the expected contribution of asymptomatic cases to COVID-19 transmission and distinguishing potential super-spreaders. Given that these components are crucial for robust, country-specific projections, we aimed to implement a modified Susceptible, Exposed, Infectious, Removed (SEIR) model of SARS-CoV-2 transmission incorporating those components, with the objectives of supporting the development of medications, optimizing clinical trial recruitment, and facilitating a fast-to-market strategy for medications that have the potential to reduce symptoms and complications in patients with COVID-19.
Methods
Data sources
Real-world epidemiological data from 175 countries were obtained from the Johns Hopkins University COVID-19 Center for Systems Science and Engineering COVID-19 Dashboard on January 31, 2021 [1]. Included were data from national and state government health departments and local media reports. In addition, countrylevel mitigation data from the Coronavirus Government Response Tracker, collected and validated by Oxford University [32], were used to investigate the potential mitigation impact of NPIs on the transmission of SARS-CoV-2, with the objective of building country-specific quantitative relationships between NPIs and transmission model parameters.
Model development
Development of the initial modified SEIR model was based on the susceptible population (S), exposed patients not yet infectious (E), infected infectious patients who are asymptomatic (Ia), infected infectious patients (I), recovered patients (R), and death (D) (Figure 1). Additional components, detailed below, were added to account for reporting rates of individual countries, incorporate hotspots and emerging clusters, include asymptomatic and super-spreader profiles, and evaluate the impact of various mitigation strategies on transmission rate. The model was used to estimate the expected total number of symptomatic and asymptomatic cases regardless of whether they were reported.

Figure 1: Initial COVID-19 transmission model. Note: S, susceptible population; E, exposed patients not yet infectious; Ia, infected infectious patients who are asymptomatic; I, infected infectious patients; R, recovered; D, death. λ, median incubation period; α, start of infectious period; δ, duration of infectious period.
To account for regional differences in initial exposure, we started with a set date of January 1, 2020, and estimated a country-specific lag time to the first infected case in each country. To forecast accurately, it was essential to properly incorporate the population at risk for infection in each country and to avoid overestimating or underestimating the transmission rate because this could impact the model’s outcomes and ultimately misinform subsequent decisions regarding medication development and deployment. To account for non-uniform geographic distribution of cases within a country, the size of a susceptible population was initially estimated by mimicking the size and distribution of COVID-19 hotspots and was inflated every 15 days using an estimation of the inflation parameter for that country.
The asymptomatic population was included in our SEIR model by estimating the proportion of asymptomatic cases and assuming a daily infection rate half that of symptomatic cases. This rate assumption was based on reports of reduced viral load in asymptomatic persons, a potential surrogate marker of the infection rate [23,33,34]. The infectious period of asymptomatic cases was fixed at 10 days based on the observed viral load time course [23,33]. These characteristics of asymptomatic cases were then further refined using sensitivity analysis. The super-spreaders were accounted for in our SEIR model in the same way asymptomatic cases were. However, both the proportion of super-spreaders in the population and the increase in their infection rate could be estimated in our model.
The effect of mitigation strategies on the RR (number of new cases per subject during the entire infectious period) was evaluated using the Oxford COVID-19 Government Response Tracker [32], which calculates a stringency index to score the strength of mitigations. This tool systematically collects country-specific policy responses to COVID-19, including indicators such as school closures and travel restrictions (Figure 2). The value of an index on any given day is calculated as the average of nine sub-indices pertaining to individual policy indicators assigned a value between 0 and 100, where the stronger the mitigation, the higher the stringency index. In our model, the relationship between the stringency index and the daily infection rate was characterized using an Emax model from which a maximum infection rate could be estimated considering no mitigation (stringency index of 0), and then a decrease in the infection rate could be estimated depending on the stringency index, the magnitude of the decrease, and the stringency index value that would correspond to 50% of the decrease. We also assumed a similar relationship between the stringency index and the daily infection rate for symptomatic and asymptomatic cases, considering that different NPIs constituting the stringency index (eg, school or public transport closing) would impact both infection rates. The policy most specific to symptomatic cases is to quarantine starting soon after the emergence of symptoms; we included this in the model as directly impacting the infectious period of symptomatic cases only.

Figure 2: Stringency index for mitigation strength scoring. Note: Cj, ordinal value of the indicator; Gj, general value; Ij, subindex; Nj, maximum value of the indicator.
Between-country variability
Because our objective was to describe and forecast the number of cases in each country, we had to consider which parameters would be similar across countries (virus specific) and which parameters would vary between countries (country specific). Therefore, we included a certain amount of intercountry variability in our model to account for country-specific factors, among them potential differences in transmission resulting from cultural and environmental differences and differences in the way cases were reported. Similarly, the impact of mitigation strategies on the rate of transmission was considered country specific.
Simulations
Our model was used to project the mid- to long-term expected number of cases in each country according to different scenarios. We fixed the stringency index at the latest reported value for each country at the cut-off date (January 31, 2021) because it appeared to reflect the maximum number of sustainable mitigations countries could implement without jeopardizing economic factors. However, different scenarios could account for specific viral spread according to the size of the target population (to mimic the occurrence of new clusters). We defined two possible scenarios. In scenario 1, which corresponds to low viral spread, the susceptible population was increased every 15 days using country-specific means of the inflation parameter values estimated during the period with strong mitigations, such as during the lockdown period (mid-March to mid-May). Scenario 2 corresponds to high viral spread with a biweekly increase of the susceptible population implemented using country-specific means of the inflation parameter values estimated over the recent months with no travel restrictions (mid-September to mid-January).
We limited the simulation period to 2 months because we considered the effects of certain parameters (eg, seasonality of virus transmission, effects of wearing face masks, test strategy, vaccine deployment, and new viral strains) sufficiently ambiguous to limit confidence in a longer simulation period.
Results
Tailored model for understanding virus spread characteristics per country
Parameter estimates are shown in Table 1. Across countries, our model estimated that it takes an average of 2.59 days after a person contracts the virus to become infectious and another 4.28 days before the onset of symptoms, resulting in an incubation period of almost 7 days. Estimates indicate that 71.6% of all cases are asymptomatic and 10.6% of all cases are super-spreaders, with a transmission rate 2.86-fold higher than average.
| Model parameter | Description | Value | Precision, % | Variability between countries, % |
|---|---|---|---|---|
| λ | Time to becoming infectious after contracting virus, days | 2.59 | 0.074 | None |
| α | Time to development of symptoms after becoming infectious, days | 4.28 | 0.407 | None |
| kq | Time to starting quarantine after symptom onset, days | 1 | Fixed | None |
| Pra | Proportion of asymptomatic cases, % | 71.6 | 0.048 | None |
| Pss | Proportion of super-spreaders, % | 10.6 | 0.239 | None |
| βss | Transmission rate increase in super-spreaders | 2.86 | 10.2 | 134 |
| lagD | Time to the first two infected persons, days | 33.2 | 4.78 | 62.8 |
| βMax | Maximum infection rate | 1.08 | 5.36 | 70.6 |
| βmin | Minimum daily infection rate | 0.135 | 10.5 | 136 |
| S50_pop | Stringency index needed to reach 50% of the maximum effect on the infection rate | 34.9 | 6.1 | 79.9 |
Table 1: Population parameter estimates.
The stringency index, derived from the Oxford COVID-19 Government Response Tracker [32], was used for scoring initiated mitigations. In our model, the maximum infection rate in the absence of specific policies (other than self-imposed quarantine in response to symptoms) was estimated as 1.08 cases per subject per day of symptoms, with a range between 0.689 and 1.65, depending on the country. Assuming a reduction in the infection rate of 50% for presymptomatic and asymptomatic cases, the average RR was computed as shown in Table 2. Based on this, without any mitigation strategy in place, a symptomatic person is predicted to infect a total of 3.4 people – approximately 2.3 during the presymptomatic period and 1.1 during the symptomatic period. An asymptomatic person is predicted to infect 7.7 people in total. After accounting for the proportion of asymptomatic cases estimated by the model, it can be derived that asymptomatic persons are responsible for 85% of new infections. In addition, the relationship between the stringency index and the daily infection rate could be estimated within the model; an example based on global-level data is shown in Figure 3. A stringency index value of 34.9% was estimated as required to result in a 50% decrease in daily infection rate, with a range between 23.2% and 65.9%, depending on the country. Therefore, the stringency index must exceed 45% to result in the RR in symptomatic cases dropping below 1 (Figure 3).
| Symptomatic cases | Asymptomatic cases | |||||
|---|---|---|---|---|---|---|
| Days | Daily infection rate | New cases, n | Days | Daily infection rate | New cases, n | |
| Presymptomatic | 4.28 | 0.54 | 2.31 | 4.28 | 0.54 | 2.31 |
| Symptomatic | 1 | 1.08 | 1.08 | — | — | — |
| Asymptomatic | — | — | — | 10 | 0.54 | 45.4 |
| Total RR | — | — | 3.39 | — | — | 7.71 |
A 50% reduction in the infection rate for presymptomatic and asymptomatic cases was assumed. Note: RR, reproduction ratio (number of new cases per subject during their entire infectious period).
Table 2: Estimated RR of symptomatic and asymptomatic cases.

Figure 3: Relationship between the stringency index and the reproduction ratio.
Most of the parameters were well estimated. Data fitting to describe the observed cumulative cases are shown in Figure 4 for representative countries. Between-country differences observed in cumulative cases over time were well captured with the model and could be explained by changes in the stringency index and the potential geographic spread of the virus, which are the two time-dependent variables in the model [33,34].

Figure 4: Data fitting for representative countries. Blue dots represent observed data; black lines represent model prediction.
Supporting questions around clinical development and future supply
The simulation was also able to illustrate the projection of expected cases for the next 2 months (Figure 5). These projections may help inform clinical operation considerations with regard to site locations for new COVID-19 clinical trials and allow companies to anticipate future demands for medications and prioritize supplies in territories with the highest current or future needs. For each of the scenarios tested, certain countries (such as Argentina and Japan) are likely to have more accelerated accumulations of cases than countries (such as the United Kingdom, Iran, and Indonesia) that expect only moderate increases, especially as strict mitigations/ lockdowns are put in place. Some countries, such as India and Brazil, appear “flat” with almost no new cases predicted. The ability to predict where this acceleration will occur may allow for a more appropriate selection of clinical trial sites for new COVID-19 medications and may increase patient participation in these clinical trials. This, in turn, will ensure that medications that are safe and effective can be rapidly distributed to the patients who need them. Such simulation results, if regularly revised, could also allow for increased availability of medications where the need is likely to be high while identifying countries that may be less relevant targets.

Figure 5: Simulation results by country. Black dots indicate observed data; blue shaded areas indicate simulated time course for each scenario with low viral spreading (eg, lockdown continues); red shaded areas indicate simulated time course for each scenario with high viral spreading (eg, winter conditions); gray rectangles highlight the forecasted period.
Discussion
The objective of this analysis was to tailor a transmission model to address the current issue faced by pharmaceutical companies, governments, and multinational organizations: how to best identify countries that can facilitate faster and more efficient development of potential COVID-19 therapies, with the ultimate goal of getting potentially life-saving medications to those in need. The model presented here has the potential to help support the selection of clinical trial sites, the initiation of mitigation strategies, and the distribution of COVID-19 diagnostics, treatments, and vaccines.
This modeling study of COVID-19 transmission, based on total global cases reported as of January 31, 2021, demonstrated disease model parameters consistent with those that have been reported in the literature, such as an incubation period of 7 days [35-37]. In addition, our model was able to estimate similar rates of asymptomatic cases and proportions of super-spreaders across all countries. The estimated proportion of asymptomatic cases reported here (71.6%) appears somewhat higher than reported in the literature [15,23,38-40], perhaps because of the strong correlation between the proportion of asymptomatic cases and the relatively reduced transmission rate in the asymptomatic population (estimated at half that of symptomatic cases in our model). Sensitivity analyses around this reduced transmission rate in asymptomatic persons could impact the estimation of the proportion of asymptomatic cases but should not impact any other results or simulation outcomes. A better assessment of the reduced transmission rate in asymptomatic persons could potentially provide a proportion of asymptomatic cases closer to the other reported values. Another alternative could be to fix the proportion of asymptomatic cases in order to estimate the expected reduction of transmission in such a population. In addition, the estimated proportion of super-spreaders identified here (almost 10%) is similar to the expected proportion identified in other studies [41]. According to their daily infection rate, super-spreaders are expected to infect 2.86 times the number of people average spreaders infect. In the absence of mitigation, this would lead to one symptomatic super-spreader infecting approximately 9.7 people and one asymptomatic super-spreader infecting almost 22 people, highlighting the large contribution this small proportion of people can make to virus transmission, which is consistent with previous reports [42]. Furthermore, our model confirms that most new cases result from asymptomatic transmission, either during the presymptomatic period (by persons who later become symptomatic) or by asymptomatic persons [27,28,43]. In general, these data highlight the importance of incorporating asymptomatic persons in transmission models to obtain more accurate projections of future cases.
To better describe country-specific data, identify which countries are likely to experience large numbers of emerging cases, and help inform decisions surrounding future clinical trial locations, our strategy incorporated intercountry variability into the model. This variability was considered for parameters that may differ, depending on social, cultural, and societal factors (such as the rate of infection and the strength of NPIs), allowing for appropriate country-specific forecasts. These parameters could indirectly account for the number of contacts each person may have (eg, household context, place of work) and the level of adherence to NPIs, with an effect that could differ between countries despite a similar stringency index. Notably, the amplitude of the intercountry variability was large, suggesting considerable heterogeneity between countries.
With this model, we were able to simulate the expected number of COVID-19 cases over time using different scenarios of mitigation. Our model can be used to project the future profile of the pandemic based on current data to investigate the effect of mitigation specific to each country. It also allows for the simulation of potential new clusters though a country-specific stringency index (ie, last stringency index carried forward in the simulation), accounting for an increase in the target population over time based on country-level estimates. Together these data can provide important information for the identification of promising new sites for COVID-19 clinical trials and may help support global supply chain networks by identifying potential supply-and-demand challenges arising in different countries during the pandemic.
Our model does have certain limitations. First, it was based on observed infected cases. Given that some patients are asymptomatic or show only mild symptoms, however, it is likely that the true number of cases is higher than captured here. In addition, changes in the reporting rate because of local testing policies and potential seasonality differences are not incorporated or investigated in this model. As data on these factors are gathered over time, it may be possible to integrate them into our model to support future forecasting. Nevertheless, it is worth noting that this model has remained relatively stable since September 2020, with biweekly updates only minimally impacting the forecasting results. Finally, the model does not account for the availability of a vaccine. When an efficacious vaccine is widely available, our model must be adjusted to account for the reduced size of the susceptible population and the limited possibility of transmission. As with all predictive models, additional data on each of these factors will improve our understanding of SARS-CoV-2 transmission; integrating these data into our model can support more accurate forecasting in the future.
Conclusion
In summary, our model can support and inform the development of clinical trials and the supply and distribution of future medications. By updating and adjusting the model as new data are received, our model could potentially inform longer term considerations as well. Finally, our model also represents a possible framework for describing transmission characteristics of other diseases, estimating viral spread, and refining country-specific estimates of disease impact.
Acknowledgements
Third-party editorial assistance was provided by Sara Duggan, PhD, and Stacie Dilks, PhD, of ApotheCom and was funded by F. Hoffmann-La Roche Ltd.
Author contributions
Conceptualization, writing review, and editing: ALD, PB, JEC, BC, SF, AH
Data curation: ALD
Formal analysis: ALD
Investigation: PB, AH
Methodology: ALD, PB, BC, AH, JEC
Resources: ML
Software: JL
Supervision: JEC
Data availability statement
Qualified researchers may request access to individual patient level data through the clinical study data request platform (https:// vivli.org/). Further details on Roche's criteria for eligible studies are available here (https://vivli.org/members/ourmembers/). For further details on Roche's Global Policy on the Sharing of Clinical Information and how to request access to related clinical study documents, see here (https://www.roche.com/research_ and_development/who_we_are_how_we_work/clinical_trials/ our_commitment_to_data_sharing.htm).
Financial support
This study was funded by F. Hoffmann-La Roche Ltd.
Conflict of interest
ALD and JEC are employees of F. Hoffmann-La Roche Ltd and receive salary and stock options. BC is an employee of Roche Products Ltd and receives salary and stock options. ACH, PB , JL, ML and SF are employees of F. Hoffmann-La Roche AG and receive salary and stock options.
REFERENCES
- Johns Hopkins University. COVID-19 Dashboard by the Center for Systems Science and Engineering (CSSE) at Johns Hopkins University (JHU). 2020.
- Ayati N, Saiyarsarai P, Nikfar S. Short and long term impacts of COVID-19 on the pharmaceutical sector. DARU J Pharmaceut Sci. 2020;28(2):799-805.
- Asaad M, Habibullah NK, Butler CE. The impact of COVID-19 on clinical trials. Ann Surg. 2020;272(3):e222-e223.
- Kelleher K, Kumar K, Patel P, Schrader U. Pharma operations: The path to recovery and the next normal. 2020.
- Centers for Disease Control and Prevention. COVID-19 mathematical modeling. 2020.
- Buchwald AG, Adams J, Bortz DM, Carlton EJ. Infectious disease transmission models to predict, evaluate, and improve understanding of COVID-19 trajectory and interventions. Ann Am Thorac Soc. 2020;17(10):1204-1206.
- Lemaitre JC, Perez-Saez J, Azman AS, Rinaldo A, Fellay J. Assessing the impact of non-pharmaceutical interventions on SARS-CoV-2 transmission in Switzerland. Swiss Med Wkly. 2020;150:w20295.
- Davies NG, Kucharski AJ, Eggo RM, Gimma A, Edmunds WJ, Jombart T, et al. Centre for the Mathematical Modelling of Infectious Diseases COVID-19 Working Group. Effects of non-pharmaceutical interventions on COVID-19 cases, deaths, and demand for hospital services in the UK: A modelling study. Lancet Public Health. 2020;5:e375-e385.
- Zhu Y, Chen YQ. On a statistical transmission model in analysis of the early phase of COVID-19 outbreak. Stat Biosci. 2020;1-17.
- Wu JT, Leung K, Leung GM. Nowcasting and forecasting the potential domestic and international spread of the 2019-nCoV outbreak originating in Wuhan, China: A modelling study. Lancet. 2020;395(10225):689-697.
- Li Q, Guan X, Wu P, Wang X, Zhou L, Tong Y, et al. Early transmission dynamics in Wuhan, China, of novel coronavirus-infected pneumonia. N Engl J Med. 2020;382:1199-1207.
- Gatto M, Bertuzzo E, Mari L, Miccoli S, Carraro L, Casagrandi R, et al. Spread and dynamics of the COVID-19 epidemic in Italy: Effects of emergency containment measures. Proc Natl Acad Sci. 2020;117(19):10484-10491.
- Tan J, Liu S, Zhuang L, Chen L, Dong M, Zhang J, et al. Transmission and clinical characteristics of asymptomatic patients with SARS-CoV-2 infection. Future Virol. 2020;15(6): 373-380.
- Leclerc QJ, Fuller NM, Knight LE, Funk S, Knight GM. What settings have been linked to SARS-CoV-2 transmission clusters? Wellcome Open Res. 2020;5.
- Oran DP, Topol EJ. Prevalence of asymptomatic SARS-CoV-2 infection: A narrative review. Ann Intern Med. 2020;173:362-367.
- Prem K, Liu Y, Russell TW, Kucharski AJ, Eggo RM, Davies N, et al. The effect of control strategies to reduce social mixing on outcomes of the COVID-19 epidemic in Wuhan, China: A modelling study. Lancet Public Health. 2020;5(5):e261-e270.
- Hellewell J, Abbott S, Gimma A, Bosse NI, Jarvis CI, Russell TW, et al. Feasibility of controlling COVID-19 outbreaks by isolation of cases and contacts. Lancet Global Health. 2020;8:e488-e496.
- Chinazzi M, Davis JT, Ajelli M, Gioannini C, Litvinova M, Merler S, et al. The effect of travel restrictions on the spread of the 2019 novel coronavirus (2019-nCoV) outbreak. Science. 2020;368(6489):395-400.
- Karako K, Song P, Chen Y, Tang W. Analysis of COVID-19 infection spread in Japan based on stochastic transition model. Biosci Trends. 2020 ;14:134-138.
- Zhang J, Litvinova M, Liang Y, Wang Y, Wang W, Zhao S, et al. Changes in contact patterns shape the dynamics of the COVID-19 outbreak in China. Science. 2020;368(6498):1481-1486.
- Zhang Y, Li Y, Wang L, Li M, Zhou X. Evaluating transmission heterogeneity and super-spreading event of COVID-19 in a metropolis of China. Int J Environ Res Public Health. 2020;17(10):3705.
- Cowling BJ, Ali ST, Ng TW, Tsang TK, Li JC, Fong MW, et al. Impact assessment of non-pharmaceutical interventions against coronavirus disease 2019 and influenza in Hong Kong: an observational study. Lancet Public Health. 2020;5(5):e279-e288.
- Yang R, Gui X, Xiong Y. Comparison of clinical characteristics of patients with asymptomatic vs symptomatic coronavirus disease 2019 in Wuhan, China. JAMA Netw Open. 2020;3(5):e2010182.
- Koh WC, Naing L, Rosledzana MA, Alikhan MF, Chaw L, Jamaludin SA, et al. What do we know about SARS-CoV-2 transmission? A systematic review and meta-analysis of the secondary attack rate and associated risk factors. PLoS One. 2020;15(10):e0240205.
- Arons MM, Hatfield KM, Reddy SC, Kimball A, James A, Jacobs JR, et al. Presymptomatic SARS-CoV-2 infections and transmission in a skilled nursing facility. N Engl J Med. 2020;382(22):2081-2090.
- Zhao H, Lu X, Deng Y, Tang Y, Lu J. COVID-19: Asymptomatic carrier transmission is an underestimated problem. Epidemiol Infect. 2020;148:e116.
- Aguilar JB, Faust JS, Westafer LM, Gutierrez JB. A model describing COVID-19 community transmission taking into account asymptomatic carriers and risk mitigation. medRxiv. 2020.
- Huang L-S, Li L, Dunn L, He M. Taking account of asymptomatic infections in modeling the transmission potential of the COVID-19 outbreak on the Diamond Princess cruise ship. medRxiv. 2020.
- Oster AM, Caruso E, DeVies J, Hartnett KP, Boehmer TK. Transmission dynamics by age group in COVID-19 hotspot counties—United States, April-September 2020. Morb Mortal Wkly Rep. 2020;69(41):1494-1496.
- Cito F, Amato L, Di Giuseppe A, Danzetta ML, Iannetti, Petrini A, et al. A COVID-19 hotspot area: Activities and epidemiological findings. Microorganisms. 2020;8(11):1711.
- Varsavsky T, Graham MS, Canas LS, Ganesh S, Pujol JC, Sudre CH, et al. Detecting COVID-19 infection hotspots in England using large-scale self-reported data from a mobile application: A prospective, observational study. Lancet Public Health. 2020;6:e21-e29.
- University of Oxford. Coronavirus government response tracker. 2020.
- Zou L, Ruan F, Huang M, Liang L, Huang H, Hong Z, et al. SARS-CoV-2 viral load in upper respiratory specimens of infected patients. N Engl J Med. 2020;382(12):1177-1179.
- Ferguson NM, Cummings DAT, Cauchemez S, Fraser C, Riley S, Meeyai A, et al. Strategies for containing an emerging influenza pandemic in Southeast Asia. Nature.2005;437(7056):209-214.
- Linton NM, Kobayashi T, Yang Y, Hayashi K, Akhmetzhanov AR, Jung SM, et al. Incubation period and other epidemiological characteristics of 2019 novel coronavirus infections with right truncation: A statistical analysis of publicly available case data. J Clin Med. 2020;9(2):538.
- Pak D, Langohr K, Ning J, Cortes Martinez J, Gomez Melis G, Shen Y. Age associated coronavirus disease 2019 incubation period: impact on quarantine policy. medRxiv. 2020.
- Lauer SA, Grantz KH, Bi Q, Jones FK, Zheng Q, Meredith HR, et al. The incubation period of coronavirus disease 2019 (COVID-19) from publicly reported confirmed cases: estimation and application. Ann Intern Med. 2020;172(9):577-582.
- Heneghan C, Brassey J, Jefferson T. COVID-19: what proportion are asymptomatic? 2020.
- Buitrago-Garcia D, Egli-Gany D, Counotte MJ, Hossman S, Imeri H, Ipekci AM, et al. Occurrence and transmission potential of asymptomatic and presymptomatic SARS-CoV-2 infections: A living systematic review and meta-analysis. PLoS Med. 2020;17(9):e1003346.
- Byambasuren O, Cardona M, Bell K, Clark J, McLaws ML, Glasziou P. Estimating the extent of asymptomatic COVID-19 and its potential for community transmission: Systematic review and meta-analysis. JAMMI. 2020;5(4):223-234.
- Stein RA. Super-spreaders in infectious diseases. Int J Infect Dis. 2011;15:e510-e513.
- Endo A, Abbott S, Kucharski AJ, Funk S. Estimating the overdispersion in COVID-19 transmission using outbreak sizes outside China. Wellcome Open Res. 2020;5:67.
- Johansson MA, Quandelacy TM, Kada S, Venkata Prasad P, Steele M, Brooks JT, et al. SARS-CoV-2 transmission from people without COVID-19 symptoms. JAMA Netw Open. 2021;4(1): e2035057.
Citation: Lemenuel-Diot A, Clinch B, Hurt AC, Boutry P, Laurent J, Leddin M, et al. (2021) A COVID-19 Transmission Model Informing Medication Development and Supply Chain Needs. J Vaccines Vaccin. 12:450.
Copyright: © 2021 Lemenuel-Diot A, et al. This is an open-access article distributed under the terms of the Creative Commons Attribution License, which permits unrestricted use, distribution, and reproduction in any medium, provided the original author and source are credited.