Indexed In
- Open J Gate
- RefSeek
- Hamdard University
- EBSCO A-Z
- OCLC- WorldCat
- Publons
- International Scientific Indexing
- Euro Pub
- Google Scholar
Useful Links
Share This Page
Journal Flyer

Open Access Journals
- Agri and Aquaculture
- Biochemistry
- Bioinformatics & Systems Biology
- Business & Management
- Chemistry
- Clinical Sciences
- Engineering
- Food & Nutrition
- General Science
- Genetics & Molecular Biology
- Immunology & Microbiology
- Medical Sciences
- Neuroscience & Psychology
- Nursing & Health Care
- Pharmaceutical Sciences
Research Article - (2025) Volume 14, Issue 4
Watershed Prioritization through Morphometric Analysis Using Remote Sensing and GIS Techniques: A Case Study from Tawi Basin, Jammu and Kashmir
Adil Butt*Received: 17-May-2024, Manuscript No. JGRS-24-25733; Editor assigned: 22-May-2024, Pre QC No. JGRS-24-25733 (PQ); Reviewed: 05-Jun-2024, QC No. JGRS-24-25733; Revised: 11-Jul-2025, Manuscript No. JGRS-24-25733 (R); Published: 18-Jul-2025
Abstract
Watershed prioritization plays a vital role in watershed conservation and management. Morphometric analysis has been commonly used for the prioritization of watersheds. In this present study, prioritization of watershed based on morphometric parameters has been performed for the Tawi catchment of Jammu, J and K. Various morphometric parameters have been computed in the present study using the GIS technique for each sub-watershed including area, perimeter, stream order, stream length, stream number and elevation, which were obtained from the digital elevation model coverage of the drainage network map. Whereas the other parameters like bifurcation ratio, circulatory ratio, drainage density, stream frequency, elongation ratio, texture ratio, form factor and compactness ratio were calculated by using their standard formulae. From these parameters, compound values have been calculated by assigning their respective relation with erodibility, vulnerability and structural disturbances. Based on morphometric analysis, the sub-watersheds have been categorized into high, medium and low in terms of priority for the management and conservation of natural resources.
Keywords
Prioritization; Morphometric; Tawi; Catchment; Drainage
Introduction
Morphometric analysis in geomorphology means a detailed examination of landforms through quantitative measurement. Mathematical or quantitative measurement helps us in examining and analyzing the landforms accurately for any planning and development purposes. A major thrust in the geomorphology over last few decades has been on the development of quantitative physiographic methods of analyzing landforms and describing the evolution and behaviour of surface drainage. It plays a significant role in understanding the geohydrological characteristics of a drainage basin about the terrain feature and its flow patterns. Most of the previous morphometric analyses were based on arbitrary areas or individual channel segments. Using watersheds as a basic unit in morphometric analysis allows a clear geographical and hydrological definition of an area to be managed. A watershed is the surface area drained by a part or the whole stream or several given water courses. Earlier, the term watershed was used for the divide of a drainage basin. Since the UN conference on water at Mar del Plata, Argentina in 1977, the term watershed has come to mean also the drainage catchment itself. Accordingly, “a watershed is defined as any surface area from which runoff resulting from rainfall is collected and drained through a common point. It is often used interchangeably with the terms 'drainage basin' or 'catchment area'. A watershed may be only a few hectares as in small ponds or hundreds of square kilometres as in rivers. All watersheds can be divided into smaller subwatersheds” [1].
In watershed management, especially in the case of large watersheds, it is not possible to treat the entire watershed area with land treatment measures, therefore the watershed is divided into sub-watersheds. Few sub-watersheds having relatively more degradation problems are identified and selected, for development, planning and implementation of conservationactivities. These few selected areas or sub-watersheds within a large watershed are called priority watersheds. Watershed prioritization is a prerequisite to operationalize any major scheme as it allows the planners to policymakers to adopt a selective approach considering the vastness of the catchment area, severity of problems, and constraints of funds. Morphometric analysis could be used for the prioritization of micro watersheds by studying different linear and areal parameters of the watershed even without the availability of soil maps. Morphometric analysis of a drainage basin requires delineation of all existing streams. The stream delineation is done in GIS using a Digital Elevation Model (DEM) either prepared from a contour map or directly taking DEM from reliable sources, e.g., ASTER 30 m DEM. Morphometric parameters such as area, perimeter, stream order, form factor, stream length, stream number, bifurcation ratio, stream frequency, drainage texture, length of basin, circulatory ratio, elongation ratio, drainage density etc. are computed. The morphometric linear parameters have a direct relationship with erodibility and structural disturbances. Thus, for prioritization of sub-watersheds, the highest value of linear parameters is ranked 1, the second highest value is ranked 2 and so on and the least value is rated last in rank. Whereas shape parameters have an inverse relationship with the erodibility. The lower the value, the more the erodibility. Hence the lowest value of shape parameters is ranked 1, the next lower value is ranked 2 and so on and the highest value is rated last in the rank. Then the priority of the sub-watersheds is determined by assigning the highest priority based on the highest value in the case of linear parameters and the lowest value in the case of areal parameters [2].
Materials and Methods
The prioritization is carried out by allocating ranks to the individual indicators and a Compound value (Cp) is calculated. Watersheds with the highest compound value are of low priority while those with the lowest compound value are of high priority. Thus, an index of high, medium and low is produced.
Study area
Tawi catchment of Jammu and Kashmir (Figure 1) is located in the northern part of India between 32°39′ to 33°8′ N and 74°48′to 75°40′ E. It covers an area of 2303 km² and is one of the major tributaries of the river Chenab in the Shiwaliks of the Himalayas. The river originates from the Kali Kundi glacier, southwest of Bhaderwah town of the Doda district and flows through the Doda, Udhampur and Jammu districts of Jammu and Kashmir before entering Pakistan. Before joining the Indus River in Pakistan, the Tawi River covers about 177 km. The elevation of the entire Tawi watershed varies between 4282 meters near Kailash Kund glacier to 207 meters above mean sea level in the plains. The Tawi watershed is further subdivided into five sub-watersheds for watershed prioritization and the river flows through the two main cities of Jammu and Kashmirthe most populous city and winter capital Jammu and Udhampur. It is the only source of drinking water and irrigation in these cities. A larger part of the catchment is either degraded or barren, resulting in floods laden with heavy loads of sediment/debris that cause extensive damage to the life and properties of inhabitants along both the banks and in the lowlying areas [3].
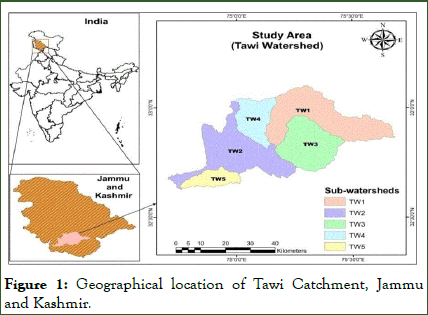
Figure 1: Geographical location of Tawi Catchment, Jammu and Kashmir.
Climate change, as well as anthropogenic land cover changes, have increased the frequency and intensity of floods and any attempt to gain control over the situation requires a detailed and holistic understanding of the basin and sub-basin regions.
Database and methodology
In the present study, the Tawi watershed was demarcated based on the researcher's needs and convenience. The study area consisted of three southeastern districts of Jammu and Kashmir and a Digital Elevation Model (DEM) of 30 m resolution was used for watershed delineation. Further actions like river basin demarcation and morphometric analysis like stream order, bifurcation ratio, etc. were carried out on GIS software ArcGIS 10.8. The Tawi Watershed has been further subdivided into five sub-watersheds, namely TW1, TW2, TW3, TW4 and TW5, for watershed prioritization. The parameters computed in the present study using the GIS technique include area, perimeter, stream order, stream length, stream number and elevation, which were obtained from the digitized coverage of the drainage network map. Other parameters like bifurcation ratio, drainage density, stream frequency, texture ratio, form factor, circulatory ratio, elongation ratio and compactness ratio were calculated by standard formulas as given in the texts of morphometric analysis [4].
Results and Discussion
Morphological parameters are the quantitative measurements of the shape and form of a landscape. In the context of the Tawi watershed, these parameters were computed using digital elevation models and GIS tools to analyze the area's topography. The study area has undergone elaborate morphometric analysis for each of the 5 sub-watersheds and the different parameters have been determined. For analysis and discussion, the morphometric parameters of the Tawi watershed are divided into three categories: Linear, shape and relief.
Morphometric analysis of linear parameters
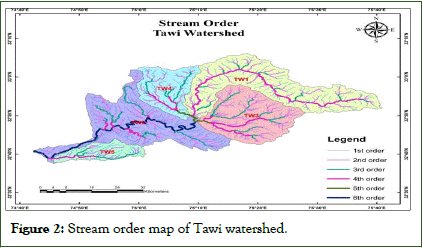
Stream number (Nu and stream order (u: The morphometric analysis of a drainage basin begins with the stream order designation. This study uses Strahler's stream ordering technique, which classifies streams based on their order (Figure 2) [5].
Figure 2: Stream order map of Tawi watershed.
First-order streams are those that originate from a source. When two first-order streams combine, they form a second-order stream. When two streams of different orders meet, the downstream segment's order is higher than the joining streams' highest order.
The basin's order is the highest stream's order. According to Strahler's method, the Tawi Catchment has a total of 972 streams. Out of those streams, 741 are first-order streams, 175 are second-order, 42 are third-order, 11 are fourth-order, 2 are fifth-order, and 1 is sixth-order. The study also reveals that subbasin TW2 has the most streams, followed by sub-basin TW1, while sub-basin TW5 has the fewest streams. In almost all subbasins, the first-order streams are the most numerous. The stream number refers to the number of stream segments of various orders and is inversely proportional to the stream order (Table 1) [6].
| Sub- watersheds | Stream numbers in different orders | Total number of streams | Percentage of stream numbers of different stream orders to the total number of streams | ||||||||||
| 1st | 2nd | 3rd | 4th | 5th | 6th | 1st | 2nd | 3rd | 4th | 5th | 6th | ||
| TW1 | 212 | 49 | 12 | 1 | - | - | 274 | 77.37 | 17.88 | 4.38 | 0.36 | - | - |
| TW2 | 215 | 52 | 11 | 4 | - | 1 | 283 | 75.97 | 18.37 | 3.89 | 1.41 | - | 0.35 |
| TW3 | 154 | 37 | 9 | 3 | 1 | - | 204 | 75.49 | 18.13 | 4.41 | 1.47 | 0.49 | - |
| TW4 | 102 | 23 | 6 | 2 | 1 | - | 134 | 76.11 | 17.16 | 4.48 | 1.49 | 0.74 | - |
| TW5 | 58 | 14 | 4 | 1 | - | - | 77 | 75.32 | 18.18 | 5.19 | 1.3 | - | - |
| Tawi Watershed | 741 | 175 | 42 | 11 | 2 | 1 | 972 | 76.23 | 18 | 4.32 | 1.13 | 0.2 | 0.1 |
Table 1: Order-wise stream number analysis.
Total stream length and main stream length
It is the length of all the streams having order u. It indicates the contributing area of the basin of that order. The main stream length refers to the length of the longest stream in the area. The stream length was computed based on the law proposed by Horton [7] for all the sub-basins. Based on the results, it was observed that the stream length generally decreases as the stream order increases. This change in stream length could be attributed to factors such as the altitude, lithological variations and the slope gradient of the area (Table 2).
| Sub-water sheds | Stream length in different orders (km) | Total length of streams (km) | Percentage of stream length of different stream orders to the total length of streams | ||||||||||
| 1st | 2nd | 3rd | 4th | 5th | 6th | 1st | 2nd | 3rd | 4th | 5th | 6th | ||
| TW1 | 272.15 | 128.68 | 36.44 | 86.57 | - | - | 523.84 | 51.95 | 24.56 | 6.95 | 16.52 | - | - |
| TW2 | 307.97 | 152.9 | 74.49 | 19.01 | - | 81.17 | 635.54 | 48.45 | 24.05 | 11.72 | 2.99 | - | 12.7 |
| TW3 | 184.58 | 80.57 | 65.4 | 38.53 | 4.84 | - | 373.92 | 49.36 | 21.54 | 17.49 | 10.3 | 1.29 | - |
| TW4 | 114.02 | 62.25 | 37.93 | 19.99 | 9.68 | - | 243.87 | 46.75 | 25.52 | 15.55 | 8.19 | 3.96 | - |
| TW5 | 101.22 | 36.14 | 23.54 | 15.93 | - | - | 176.83 | 57.24 | 20.44 | 13.32 | 9 | - | - |
| Tawi water shed | 979.9 | 460.55 | 237.82 | 180.07 | 14.54 | 81.17 | 1954.05 | 50.14 | 23.56 | 12.17 | 9.21 | 0.74 | 4.15 |
Table 2: Order-wise stream length analysis.
Drainage texture (Dt)
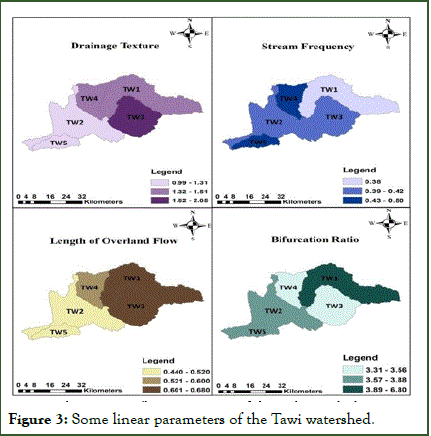
The texture of drainage depends on various natural factors such as climate, rainfall, vegetation, rock and soil type, infiltration capacity, relief and stage of development. Drainage textures can be divided into five categories: Very coarse (<2), coarse (2-4), moderate (4-6), fine (6-8) and very fine (>8). In this study, the drainage texture values range from 0.99 to 2.05 per km, which indicates that almost all the sub-watersheds fall under the category of very coarse texture. This means that there is good permeability of sub-surface material and infiltration capacity, lower run-off rate and significant recharge of the groundwater, except for the area occupied by the first-order streams. The drainage texture for the Tawi watershed is 3.06. Among all the sub-watersheds, TW5 has the lowest drainage texture value of 0.99 and TW3 has the highest drainage texture value of 2.05 [7].
Length of overland flow (Lg)
A higher value of Lg typically indicates low relief, while a lower value of Lg suggests high relief. Lg can be classified into three categories: Low value (<0.2), moderate value (0.2-0.3) and high value (>0.3). If Lg has a low value, it means high relief, short flow paths, more runoff and less infiltration. This can make an area more vulnerable to flash flooding. On the other hand, a high value of Lg implies gentle slopes and long flow paths, more infiltration and reduced runoff. The Lg value for the entire Tawi basin is 0.59. The sub-basins within the Tawi basin have computed values of Lg ranging from 0.44 for TW5 to 0.68 km for TW1. The high Lg value of the Tawi basin indicates longer flow paths with low reliefs and gentle slopes.
Bifurcation ratio (Rb)
The bifurcation ratio (Rb) is the ratio of the number of streams of a particular order (u) to the number of streams of a higher order (u+1). The Rb varies from 3 to 6 in the study area. Lower Rb values suggest less structural disturbance in sub-watersheds, while higher values indicate structurally controlled drainage patterns in sub-basins.
The mean bifurcation ratio is the average of bifurcation ratios of all orders. In the entire Tawi watershed, the mean Rb is 3.94. The mean Rb in sub-basins ranges from 3.31 (TW4) to 6.8 (TW1) and all the sub-basins fall under medium structural disturbance. The mean Rb for each sub-watershed is calculated by averaging the Rb for all the orders of streams (Figure 3 and Table 3).
Figure 3: Some linear parameters of the Tawi watershed.
| Sub- watersheds | Bifurcation Ratio (Rb) | Mean Rb | Stream Frequency (FS) | Drainage Density (DD) | Drainage Texture (DT) | Length of overland flow (LO) |
||||
| Rb1 | Rb2 | Rb3 | Rb4 | Rb5 | ||||||
| TW1 | 4.32 | 4.08 | 12 | - | - | 6.8 | 0.38 | 0.73 | 1.51 | 0.68 |
| TW2 | 4.13 | 4.72 | 2.75 | - | - | 3.86 | 0.42 | 0.95 | 1.31 | 0.52 |
| TW3 | 4.16 | 4.11 | 3 | 3 | - | 3.56 | 0.42 | 0.76 | 2.05 | 0.65 |
| TW4 | 4.43 | 3.83 | 3 | 2 | - | 3.31 | 0.47 | 0.86 | 1.44 | 0.58 |
| TW5 | 4.14 | 3.5 | 4 | - | - | 3.88 | 0.5 | 1.14 | 0.99 | 0.44 |
| Tawi watershed | 4.23 | 4.17 | 3.82 | 5.5 | 2 | 3.94 | 0.42 | 0.84 | 3.06 | 0.59 |
Table 3: Some more linear parameters.
Stream frequency (Fs)
Stream frequency refers to the number of streams per unit area of a basin. This frequency is primarily determined by the lithology of the basin and reflects the texture of the drainage network. In general, sub-basins with a large area covered by dense forest have a lower drainage frequency, while areas with more agricultural land have a higher drainage frequency. The stream frequency for the entire basin is quite low, at 0.42. However, the sub-basin TW5 has a higher value of drainage frequency at 0.5, which results in more runoff compared to the other sub-basins [8].
Drainage density (Dd)
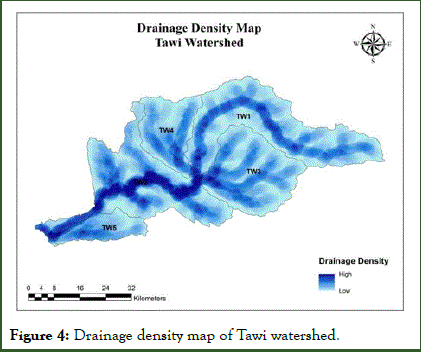
Drainage density is an important measure of the linear scale of landforms in stream-eroded topography. It is calculated by dividing the total length of all streams in a basin by the area of the basin. The resulting number, which is usually expressed in km/km2, can tell us about the physical characteristics of the rocks that make up the subsurface of the basin. Low drainage density is found in areas where the rocks are highly resistant and permeable, the vegetation is dense and the terrain is flat. High drainage density is found in areas where the rocks are weak and impermeable, the vegetation is sparse and the terrain is steep. There are five categories of drainage density, ranging from "very coarse" (less than 2 km/km2) to "very fine" (greater than 8 km/km2). In this case, the drainage density for the entire basin is 0.84, which is quite low. The highest drainage density is found in the TW5 area, where it is 1.14 (Figure 4).
Figure 4: Drainage density map of Tawi watershed.
Morphometric analysis of shape parameters
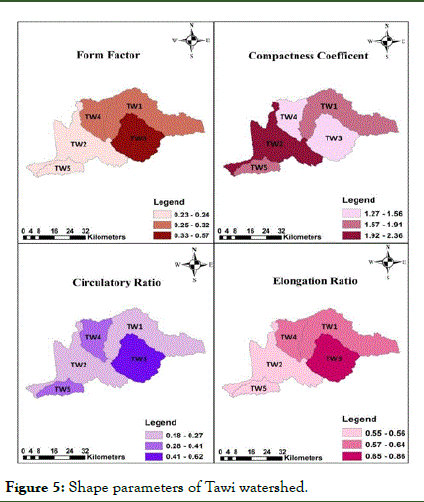
Form factor (Ff): The form factor is a ratio of the basin area (A) to the square of the maximum length of the basin (Lb). Its values range from 0 (elongated) to 1 (circular). In the current study, the Ff values varied between 0.23 (TW5) and 0.57 (TW3). This suggests that all sub-basins are more or less elongated, with less side flow for a longer duration. Flood flows of such elongated basins are easier to manage than circular basins (Figure 5).
Figure 5: Shape parameters of Tawi watershed.
Circulatory ratio (Rc): The Rc value represents the ratio of the watershed area to the area of a circle with the same perimeter as the watershed's perimeter (Pr). A higher Rc value indicates that the sub-basins are circular, have high to moderate relief and have a structurally controlled drainage system. On the other hand, lower Rc values suggest that the sub-watersheds are elongated in shape. The Rc for the entire Tawi basin is 0.29. In this study, Rc values for all sub-watersheds range from 0.18 (TW2) to 0.41 (TW4), except for TW3, which is an anomaly because it shows an elongated sub-basin that is more or less circular. This anomaly is due to the slope, relief and structural conditions prevailing in these sub-basins [9].
Elongation ratio (Re): The elongation ratio is a measurement of the shape of a basin, defined as the ratio between the diameters of a circle with the same area as the basin to its maximum length. This ratio ranges from 0.6 to 1.0 in various geological and climatic environments, with values nearing 1.0 being typical of regions with low relief and values between 0.6 and 0.8 being typical of regions with high relief and steep slopes. In the Tawi watershed, the Re is 0.58, indicating that the sub-basins are more or less elongated or oval-shaped with high relief and steep slopes, high infiltration capacity and low runoff. The sub-basins in this study have Re varying from 0.55 (TW5) to 0.86 (TW3) (Table 4) [10].
| Sub-watersheds | Form factor (Ff) | Circulatory ratio (Rc) | Elongation ratio (Re) | Compactness coefficient (Cc) |
| TW1 | 0.29 | 0.27 | 0.6 | 1.91 |
| TW2 | 0.24 | 0.18 | 0.56 | 2.36 |
| TW3 | 0.57 | 0.62 | 0.86 | 1.27 |
| TW4 | 0.32 | 0.41 | 0.64 | 1.56 |
| TW5 | 0.23 | 0.32 | 0.55 | 1.77 |
| Tawi Watershed | 0.26 | 0.29 | 0.58 | 1.86 |
Table 4: Areal parameters.
Compactness coefficient (Cc)
The compactness coefficient is an important factor for assessing the risk of erosion. A lower value of Cc indicates less vulnerability to risk factors, while a higher value indicates greater vulnerability. This means that if the value of Cc is high, conservation measures should be implemented to prevent erosion. A low value of Cc suggests that the basin is more elongated and less prone to erosion, while a high value of Cc suggests that the basin is less elongated and more prone to erosion. In the study area, the values of Cc vary from 1.27 (TW3) to 2.36 (TW2), with an overall Cc value of 1.86 for the entire watershed. The wide variation of high values across the sub-basins indicates great vulnerability to erosion [11].
Morphometric analysis of relief parameters
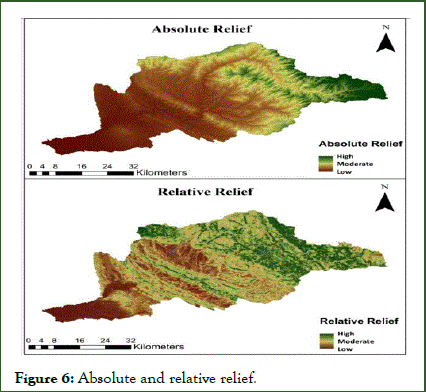
Absolute (Ar) and Relative Relief (Rr): Absolute relief refers to the highest point of elevation of a particular area above sea level. On the other hand, relative relief is the difference between the highest and lowest altitudes within a specific cell [8]. In the Tawi basin, the Ar is 4282 meters, while the Rr is 4075 meters. The sub-basinTW1 has the highest Ar and Rr, with Ar standing at 4282 m and Rr at 3817 meters.
Relief ratio (Rt): The relief ratio of a drainage basin can be calculated by dividing its basin relief (Bh) by the maximum basin length (Lb) (SCHUMM 1956) [3]. This ratio is a useful indicator of the intensity of erosion processes and the overall steepness of the basin's terrain. In this case, the relief ratio of the river basin is 0.044. However, the sub-basin TW3 stands out with a relatively high relief ratio of 0.076 compared to other subwatersheds. This is due to its steep slope and high relief, while other sub-basins have low relief ratios due to hard rock and a low degree of slope.
Ruggedness index (Ri): The ruggedness index is a measure of the drainage density and relative relief in an area. When both of these factors are high, Ri is also high. For the Tawi basin and TW1 sub-basin, the Ri value is particularly high, indicating a youthful or rejuvenated stage of geomorphic development. On the other hand, the TW5 sub-basin has a very low Ri value of 0.60, which is indicative of a mature and maximum denudation stage of erosion (Figure 6 and Table 5) [11].
Figure 6: Absolute and relative relief.
| Sub-watersheds | Relative relief (Rr) (m) | Absolute relief (Ar) (m) | Relief ratio (Rt) | Dissection index (Di) | Ruggedness index (Ri) |
| TW1 | 3817 | 4282 | 0.077 | 0.89 | 2.8 |
| TW2 | 2206 | 2413 | 0.074 | 0.91 | 2.1 |
| TW3 | 2219 | 2638 | 0.076 | 0.84 | 1.7 |
| TW4 | 2019 | 2438 | 0.042 | 0.83 | 1.74 |
| TW5 | 533 | 765 | 0.021 | 0.7 | 0.6 |
| Tawi catchment | 4075 | 4282 | 0.044 | 0.95 | 3.46 |
Table 5: Relief parameters.
Dissection index (Di): The dissection index is a term used to describe the ruggedness of a surface that is formed by numerous valleys or ravines. A high Di value is typically associated with a youthful stage, while low values indicate a more mature stage. In the case of the Tawi basin, it has a high Di value of 0.95, which indicates that it is heavily dissected by streams. Within the basin, TW2 is the most dissected, with a Di value of 1.34, while TW5 is the least dissected, with a Di value of 0.7 [12].
Prioritization of sub-watersheds
Watershed prioritization is a process to determine critical areas with high erosion activities. This helps to implement appropriate conservation measures to minimize soil erosion in the region. The prioritization is carried out by assigning ranks to the individual indicators and a Compound parameter value (Cp) is calculated. The highest value of linear parameters is ranked as 1, the second highest is ranked as 2 and so on. The lowest value of shape parameters is ranked as 1, the next lowest is ranked as 2 and so on. The prioritization is done by assigning ranks to individual indicators and calculating a compound parameter value. Compound parameter value is calculated by adding all the assigned ranks of linear and shape parameters and then dividing by the number of parameters. The sub-basin with the lowest Cp is given the highest priority according to Vandana (Table 6) [4].
| Sub- watersheds | Mean bifurcation ratio (Rank) | Stream frequency (Rank) | Drainage density (Rank) | Drainage texture (Rank) | Length of overland flow (Rank) | Form factor (Rank) | Circulatory ratio (Rank) | Elongation ratio (Rank) | Compactness coefficient (Rank) | Compound parameter value (Rank) | Overall priority rank |
| TW1 | 6.8 (1) | 0.38 (5) | 0.73 (5) | 1.51 (2) | 0.68 (1) | 0.29 (3) | 0.27 (2) | 0.60 (3) | 1.91 (4) | 2.89 | 2nd |
| TW2 | 3.86 (3) | 0.42 (3.5) | 0.95 (2) | 1.31 (4) | 0.52 (4) | 0.24 (2) | 0.18 (1) | 0.56 (2) | 2.36 (5) | 2.95 | 3rd |
| TW3 | 3.56 (4) | 0.42 (3.5) | 0.76 (4) | 2.05 (1) | 0.65 (2) | 0.57 (5) | 0.62 (5) | 0.86 (5) | 1.27 (1) | 3.39 | 5th |
| TW4 | 3.31 (5) | 0.47 (2) | 0.86 (3) | 1.44 (3) | 0.58 (3) | 0.32 (4) | 0.41 (4) | 0.64 (4) | 1.56 (2) | 3.33 | 4th |
| TW5 | 3.88 (2) | 0.5 (1) | 1.14 (1) | 0.99 (5) | 0.44 (5) | 0.23 (1) | 0.32 (3) | 0.55 (1) | 1.77 (3) | 2.44 | 1st |
Table 6: Depicts final prioritization result of Tawi Basin.
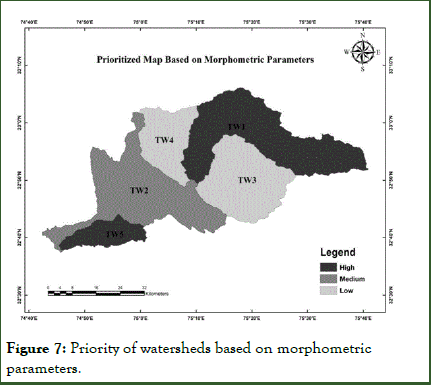
The sub-basins are then broadly classified into three priority zones based on their compound value (Cp): High (<1.060), medium (1.060-1.155 and low (1.155 and above):
High priority: The sub-basins falling under the high priority zone have the greatest degree of soil erosion and should be provided with immediate soil and water conservation measures. The two sub-basins grouped under the high priority class are likely to be subjected to maximum soil erosion.
Medium priority: The medium priority zone consists of two sub-basins characterized by moderate slopes, high to moderate values of drainage density, stream frequency, drainage texture, form factor, circulatory ratio and compactness coefficient.
Low priority: The low priority zone consists of two sub-basins with slight erosion susceptibility zones and may require agronomical measures to protect the sheet and rill erosion.
Sub-basins that fall under the high-priority category are at a very high risk of erosion. To prevent topsoil loss, there is a need for immediate attention to take up mechanical soil conservation measures such as gully control structures and grass waterways. On the other hand, sub-basins that fall under the low- priority category have a very low risk of erosion and may only require agronomical measures to protect against sheet and rill erosion. TW5 and TW1 sub-watersheds have the highest compound parameter value (Cp) and are ranked 1st and 2nd respectively and are classified as high-priority zones. Similarly, the TW2 subwatershed is ranked 3rd and is placed under the medium priority zones. Finally, the TW4 and TW3 are ranked 4th and 5th respectively, and are put under low-priority zones. The highest priority indicates the greater degree of soil erosion in the particular sub-basin, hence calls for urgent attention (Figure 7).
Figure 7: Priority of watersheds based on morphometric parameters.
Conclusion
The study demonstrates the use of remote sensing and GIS techniques to prioritize watersheds, which can assist planners and decision-makers in planning at the watershed level. The study carried out quantitative morphometric analysis on six subwatersheds of the Tawi catchment using GIS techniques to determine the linear and aerial aspects such as stream order, bifurcation ratio, stream length, Drainage density (Dd), stream frequency (Fs), form factor (Rf), circulatory ratio (Rc) and elongation Ratio (Re). Traditional methods of morphometric analysis are time-consuming and prone to errors, while the use of the GIS technique allows for more reliable and accurate estimation of similar parameters of watersheds. The morphometric analysis of different sub-watersheds shows their relative characteristics concerning the hydrologic response of the watershed. The results of morphometric analysis indicate that sub-watershed TW5 and TW1 are more vulnerable to erosion and soil loss. Geological field verification also supports the present morphological-based prioritization. Therefore, appropriate soil erosion control and water conservation measures are necessary in these sub-watersheds.
References
- Ahmed F, Rao KS. Prioritization of sub-watersheds based on morphometric analysis using remote sensing and geographic information system techniques. Int J Remote Sens GIS. 2015;4(2):51-65.
- Heathcote IW. Integrated watershed management: Principles and practice. 1998;4.
- Stanley AS. Evolution of drainage systems and slopes in badlands at Perth Amboy, New Jersey, GSA Bulletin. 1956;67:597-646.
- Vandana M. Morphometric analysis and watershed prioritisation: A case study of Kabani river basin, Wayanad District, Kerala, India. Ind J Mar Sci. 2013;42:211-222.
- Newell SA. Quantitative geomorphology of drainage basin and channel networks. 1964.
- Horton RE. Erosional development of streams and their drainage basins; hydrophysical approach to quantitative morphology. GSA Bulletin. 1945;56:275-370.
- Oguchi T. Drainage density and relative relief in humid steep mountains with frequent slope failure. Earth Sur Pro Landform. 2021;22:107-120.
- Yeshodha L, Vinithra R. Watershed based morphometric analysis of South Pennar River Basin, Krishnagiri District, Tamil Nadu using Remote Sensing and GIS. 2016.
- Mohd I, Haroon S. Watershed prioritization using morphometric and land use/land cover parameters of Dudhganga catchment Kashmir Valley India using Spatial Technology. 2014;12:15.
- Nanjundi P. Morphometric analysis for Bangalore north watersheds. Water Energ Int. 2022;12:15.
- Akram J, Mohd K, Rizwan A. Prioritization of sub-watersheds based on morphometric and land use analysis using remote sensing and GIS techniques. J Ind Soc Remote Sens. 2009;37.
- Kiran VSS, Srivastava YK. Check dam construction by prioritization of micro watershed, using morphometric analysis as a perspective of remote sensing and GIS for Simlapal Block, Bankura, W.B. Int J Indust Eng Manag Sci. 2019;2:20-31.
Citation: Butt A (2025) Watershed Prioritization through Morphometric Analysis Using Remote Sensing and GIS Techniques: A Case Study from Tawi Basin, Jammu and Kashmir. J Remote Sens GIS. 14:388.
Copyright: © 2025 Butt A. This is an open-access article distributed under the terms of the Creative Commons Attribution License, which permits unrestricted use, distribution, and reproduction in any medium, provided the original author and source are credited.
