

Indexed In
- Open J Gate
- Genamics JournalSeek
- Academic Keys
- ResearchBible
- Cosmos IF
- Access to Global Online Research in Agriculture (AGORA)
- Electronic Journals Library
- RefSeek
- Directory of Research Journal Indexing (DRJI)
- Hamdard University
- EBSCO A-Z
- OCLC- WorldCat
- Scholarsteer
- SWB online catalog
- Virtual Library of Biology (vifabio)
- Publons
- Geneva Foundation for Medical Education and Research
- Euro Pub
- Google Scholar
Useful Links
Share This Page
Journal Flyer
Open Access Journals
- Agri and Aquaculture
- Biochemistry
- Bioinformatics & Systems Biology
- Business & Management
- Chemistry
- Clinical Sciences
- Engineering
- Food & Nutrition
- General Science
- Genetics & Molecular Biology
- Immunology & Microbiology
- Medical Sciences
- Neuroscience & Psychology
- Nursing & Health Care
- Pharmaceutical Sciences
Research Article - (2021) Volume 10, Issue 7
Variations in Yield along a Phenological Gradient in Bread Wheat (Triticum aestivum L.)
Sajid Muhammad1*, Muhammad Afzal2, Md. Mosfeq-Ul-Hasan3, Ali Muhammad4 and Fida Mohammad52Zhejiang Provincial Key Laboratory of Agricultural Resources and Environment, Zhejiang University, Hangzhou 310058, China
3Assistant Controller of Examinations, Hajee Mohammad Danesh Science and Technology University, Dinajpur 5200, Bangladesh
4Department of Agriculture, Abdul Wali Khan University, Mardan 23200, Pakistan
5Department of Plant Breeding and Genetics, The University of Agriculture, Peshawar 25120, Pakistan
Received: 01-Jun-2021 Published: 22-Jun-2021, DOI: 10.35248/2168-9881.21.10.214
Abstract
Future food security will depend on crop adaptations to changing environment. Such adaptations can be made through genetic divergence in plants which is prerequisite for identifying superior plant traits and varieties. It is already known that plant varieties with supreme characteristics can play important roles in the enhancement of yield and production. Here, we practically assessed 36 wheat breeding lines (35 lines with Janbaz as check cultivar) across two planting dates (mid- November and mid-December) to determine the genetic differences and inheritance contributing production traits. For this purpose, heritability (h2), genotype by environment interaction (GEI) and correlation coefficients were studied. Data were recorded on days to heading (DH), flag leaf area (FLA), plant height (PH), days to maturity (DM), spike length (SL), grain yield (GY) and harvest index (HI). Pooled ANOVA showed significant differences among genotypes for all traits studied while GEI interactions were significant for some traits finding a significant gap for genotypes. Genotype DN-84 took less number of DH while, V-09136 had minimum values for DH and DM. Interestingly, maximum FLA, PH and SL were observed for a single genotype NR- 408. High GY and HI were recorded for genotype V-07096 and WRIS-12, respectively. Heritability (h2) estimates for DH, PH, DM, SL, ranged between 60 and 74%, illustrating strong flow of genetic makeup among genotypes, while 37 to 54% for FLA, GY and HI. Correlation coefficients were significant for various traits indicating robust association among genotypes. PCA analysis showed that dates clustered the variables differently but in a similar pattern. Based on our findings, we suggest genotypes V-09136, PR-103, NR-400, V-08BT016 and V-07096 for further investigation. Further, it is suggested to find out optimum time of sowing for each variety whereas, late sowing affect crop production.
Keywords
Normal sowing; late sowing; genotype; heritability; correlation
Introduction
The development of annual crops from emergence through flowering to maturity determines the timing and duration of critical periods for growth severely impacting yield quality and quantity. The phenological development of cereals is largely controlled by temperature, but also affected by day length and potential physiological stresses; however, responses may vary between species and varieties. Climate change is affecting agricultural crop production systems in multiple ways and the impacts are expected to be highly regionally specific depending on climatic conditions, soils, and farming and cropping systems [1].
During some phenological phases, crop development rate also responds to day length; particularly during the time until flowering in many plant species. Varieties of plant species that originate from high latitudes such as those of wheat (Triticum aestivum L.) is a long-day plant that flowers under long days and the rate of crop development increases with increasing day length [2].
Wheat (Triticum aestivum L.) is widely cultivated principal food crop in most parts of the world. Being an important cereal, it provides food to 36% of the global population and contributes 20% of the food calories [3]. It is a staple food crop and is known as “king” of the cereals. It is a leading grain crop of temperate climates of the world, just as rice in the tropics [4]. Climatic changes, shortage of water resources, and worsening of eco-environment has greatly affected wheat production [5]. However, due to increasing population, wheat demand is increasing day by day resulting in the intensification of existing varieties and advance lines. Therefore, we need effective and quick selection of wheat strains with desired traits. Nonetheless, there are advanced techniques that has coped the problem up to some extent; yet, most of them reported to be either expansive, time taking or unethical. Still, the world is relying on conventional methods of crop breeding and selection processes for successful production of crop varieties with desired characters [6].
Proper time of sowing helps cultivars to express their full growth patterns in diverse setting of environments beside genotype by environment interaction (GEI) as it also helps scientists of particular environment for maximizing yield potentials. Other environmental factors like temperature, rainfall, humidity, solar radiation, and soil types also contribute much towards a variety performance under a given locality [7]. In addition, during too early sowing the temperature is above the optimum which leads to irregular germination caused by frequent death of embryo and decomposition of endosperm due to bacteria or fungi. Late planting results in poor tillering and more chances of winter injury. Wheat is generally seeded early in the season to permit maximum growth and development towards maturity before the advent of hot weather, drought, and diseases. Wheat sown too early may use soil moisture accumulated in the fall. However, medium-season seeding of winter for any locality is usually most favorable, whereas wheat sown late suffers more winter injuries, produces less tillers, and may riper in less grain weight and number of grains per plant [2,8]. There are many techniques used for conservative farming system to develop advanced crop varieties.
Yield in crops is a very complex quantitative trait whose expression is the result of genotype, environment, and the genotype × environment interaction (GEI) [9]. Complexity of these traits is a result of different reactions of genotypes on changeable environmental conditions during plant development. Yield trial is one of the most common experiments in agricultural research. It is conducted by testing a number of genotypes in a number of environments. Multi-environment yield trials are commonly conducted to obtain information that supports recommendations of superior genotypes for cultivation. There are two factors included in multi-environment trials, i.e., genotypes and environments. Environment can be a set of locations, sites, and years, etc [9].
Heritability is a tool that guides plant breeders to predict the interaction of inherited genes in succeeding generations and provide a vital component of response to selection for successful breeding programs [10]. Genetic divergence plays an important role in plant breeding to generate productive recombinants. The choice of parents is of prime importance in breeding program. Thus, the knowledge of genetic divergence and relatedness in the germplasm is a pre-requisite for crop improvement programs. To evaluate and improve yield potential of cereals, e.g. wheat, various statistical approaches have been adopted [11].
Correlation is a statistical measurement of relationship between two variables. Possible correlation varies between zero and one. Zero correlation indicates that there is no relationship between the variables, while 1 indicates a perfect correlation, meaning that both variables are moving in similar direction and vise verse if negative. Statistically, correlation refers to a quantifiable relationship between two variables describing a measure of strength and direction of that relationship. Relationships between pairs of characters help to decide upon the appropriate selection criteria for a breeding program [12].
Every breeding program aims to develop high yielding cultivar securing future of the crop. For plant breeders, it is very important to produce potential lines subjected to effective practices in a series of diverse environmental conditions to identify the best stable yielding genotypes [13]. Therefore, in this study we planned to ascertain the performance of wheat breeding lines under normal and late plantings. Data of various traits were subjected to ANOVA for determining significant differences among genotypes, genotype × environment interactions (GEI), heritability (h2) estimates, and correlation.
Methods
Plant materials and experimental layout
This research was conducted in the Department of Plant Breeding and Genetics, The University of Agriculture, Peshawar (34.0206° N, 71.4815° E). The experimental material comprised 35 advance wheat lines received as National Uniform Yield Trial (NUYT) from National Agriculture Research Center (NARC), Islamabad-Pakistan and Janbaz was included as check cultivar. Experiment was laid out in Randomized Complete Block Design (RCBD) with three replications. Each entry was planted in 6 rows per plot. Row to row space was 30 cm and the row length was kept 5 m. The experiments were planted on November 14 and December 11, as normal and late trials, respectively. All cultural practices were applied to all treatments uniformly. Fertilizers @ 150-120-90 kg NPK ha-1 in the form of Urea, Di-Ammonium Phosphate, and Potassium Sulphate were applied to all treatments. All the phosphorous and ½ of the nitrogen were applied at the time of sowing and remaining ¼ nitrogen was top dressed with first irrigation and ¼ with second irrigation. The crop was sown with single row hand drill on a well prepared seedbed using recommended seed rate of 100 kg ha-1. The soil of site was silty clay with pH = 7.78. Meteorological data at the experimental site revealed the highest temperature (35.5°C) in May and the lowest (4°C) in January. The crop received rain showers from December to April.
Data recording
Data were recorded on ten randomly selected plants in each plot for days to heading (days from the date of planting to the date when 50% plants completed heading), flag leaf area (cm2) according to formula (Flag leaf area = Leaf length × Leaf width × 0.75), days to maturity (number of days from the date of planting till physiological maturity in about 50% plants in each plot), plant height (the distance in centimeters from the soil surface to the tip of the spike excluding awns), spike length (cm) (from first spikelet to the tip of the spike excluding the awns), grain yield (kg ha-1) (weight of grains obtained after threshing plants from each plot) and harvest index (the ratio of grain yield to biomass) according to the following formula (Harvest index (%) = [Grain yield plot- 1 / Biological yield plot-1] ×100).
Statistical Analysis and heritability estimation
Data were analyzed using STATISTIX software. Genotype by environment interaction (GEI) was determined using the ANOVA (Table 1) [14]. Heritability (broad sense) was calculated accordingly [15].
h2 = Vg
Where:
Where as
R= Replication
E= Environment
| Parameters | Environment | Repsw/nEnv | Genotypes | Gx E | Error | CV% |
|---|---|---|---|---|---|---|
| Daystoheading | 14016.66** | 2.218 | 8.90** | 1.98NS | 3.40 | 1.62 |
| Flagleafarea | 1.466NS | 288.689 | 74.19** | 34.54NS | 32.12 | 16.97 |
| Plantheight | 5420.01** | 25.26 | 104.49** | 37.34* | 22.77 | 4.80 |
| Daysto maturity | 20184.00** | 3.88 | 3.48** | 1.02NS | 1.56 | 0.81 |
| Spikelength | 19.40NS | 9.63 | 3.22** | 1.12NS | 1.01 | 9.35 |
| Grain yield | 40.28* | 3.07 | 0.96** | 0.63* | 0.41 | 19.06 |
| Harvestindex | 473.75NS | 467.24 | 127.08** | 75.27* | 49.69 | 19.10 |
Table 1: Mean squaresforvariousmorpho-yieldtraits acrosstwoplantingdates.
Principal components (PC) and correlation analysis
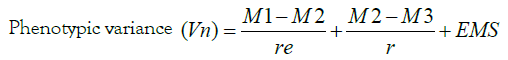
PCA analysis and presentation of the data were performed using R version (3.4.2). Genotypic (rG) and phenotypic (rP) correlations among various traits were worked out from genotypic, phenotypic and environmental co-variances using the procedure of [16] as under:
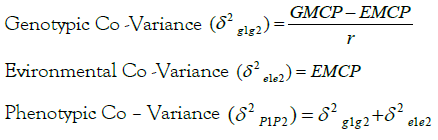
While,
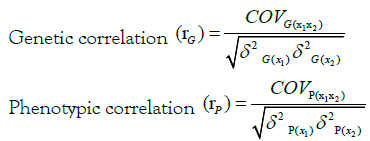
Where,
GMCP = Genotypic mean cross product EMCP = Environmental mean cross product
COVG(x1x2) = Genetic covariance among traits x1 and x2
δ 2 g (x1) = Genotypic variance of trait x1
δ 2 g (x2) = Genotypic variance of trait x2
COVP(x1x2) = Phenotypic covariance among traits x1 and x2
δ 2 p (x1)= Phenotypic variance of trait x1
δ 2 p (x2)= Phenotypic variance of trait x2
Results
Differences in sowing dates can lead to variegated performance of genotypes
The integral component of every breeding program is to develop high yielding cultivar determining future of the crop. For plant breeders, besides other challenges, high productivity and effective practice is to subject potential lines to a series of diverse environmental conditions to identify the best stable yielding genotypes [13]. Therefore, we assessed the genetic performance of 36 wheat genotypes for computing significance of these genotypes under normal (N) and late (S) sowing. Data of various traits were subjected to ANOVA for determining significant differences among genotypes, genotype × environment interactions (GEI), heritability (h2) estimates, and correlation. The combined ANOVA depicted highly significant differences (P ≥ 0.01) for most of the traits among all genotypes under study, indicating the existence of great genetic variability among genotypes (Table 1). However, GEI showed significant differences at P ≥ 0.05 for yield contributing traits like, PH, GY and HI. Temperature and level of humidity in the field were recorded throughout experiment (Figure 1).

Figure 1. Meteorological data recorded at the experimental site. (A) Temperature and (B) Relative humidity.
Analysis of variance across two planting dates for DH showed highly significant (P≤0.01) differences among genotypes and environments, while NS differences were observed for GEI (Table 1). Average DH values across planting dates ranged from 111 to 116 days with the mean value of 114 days. Maximum DH (116 days) were observed for genotypes V-076346, DN-93, NR- 421, NR-408, V-7/2011 and Aas-2011 while minimum DH (111 days) were exhibited by V-09136. Statistical analysis showed highly significant (P≤0.01) differences for FLA among genotypes and non-significant differences for GEI indicated no variation among lines over different planting dates. Averaged over both planting dates, FLA ranged from 25.2 to 40.3 cm2 with the mean value of 33.4 cm2. Maximum FLA (40.3 cm2) was observed for genotype NR- 408 and minimum while genotype NR-400 exhibited minimum FLA (25.2 cm2).
Plant height (PH) is another yield contributing trait of plants depicted highly significant (P≤0.01) differences among genotypes showing variation in PH across environments, while significant (P≤0.05) GEI indicated variability over different planting dates (Table 1). Averaged over both planting dates, PH values ranged from 88.3 and 107.1 cm with the mean value 99.4 cm. Maximum PH (107.1 cm) was observed for genotype Fsd- 2008 and minimum PH (88.3 cm) was observed for genotype V-7/2011. Highly significant (P ≤ 0.01) differences were illustrated among genotypes and environments, while non-significant GEI was observed for DM across two sowing dates. Ranges for DM were 152 to 156 days with the mean value 154 days. Maximum DM (156 days) was observed for genotypes V-7/2011 and NIA-Sunehri, whereas, less days (152 days) were observed for genotype V-09136.
Highly significant (P ≤ 0.01) differences were observed for SL among genotypes, while non- significant (P>0.05) differences were recorded for environments and GEI (Table 1). Data for SL ranged from 9.2 to 12.5 cm across plantings for genotypes NR-408 and V-10306 with an average of 10.8 cm. GY across both planting dates revealed significant (P ≤ 0.05) differences among genotypes, environments, and GEI (Table 1). Data for GY was taken in kg plot-1, converted into kg ha-1, and ton ha-1, respectively. GY across environments ranged from 2.76 to 4.33 ton ha-1 for genotypes Aas-2011 and V-07096 respectively with an average of 3.40 ton ha-1. Analysis of variance for HI across both planting dates revealed significant (P ≤ 0.05) differences among genotypes and GEI (Table 2). Mean HI across the two cropping systems (normal and late) was 36.9% with a range of 27.6 to 47.4%.
Normalsowing |
||||
|---|---|---|---|---|
| Parameters | Replication | Genotypes | Error | CV% |
| Daystoheading | 2.37 | 6.89* | 4.31 | 1.70 |
| Flagleafarea | 37.38 | 61.35** | 21.56 | 13.94 |
| Plantheight | 22.38 | 81.89** | 18.04 | 4.06 |
| Daysto maturity | 3.58 | 2.60* | 1.59 | 0.77 |
| Spikelength | 18.16 | 3.07** | 1.03 | 9.17 |
| Grain yield | 2.58 | 0.97** | 0.46 | 17.87 |
| Harvestindex | 717.71 | 107.22** | 48.62 | 18.17 |
Table 2: Mean squaresforvariousmorpho-yieldtraits undernormalplanting.
Performance of wheat lines under normal sowing
Since, we get significant results for the studied genotypes across environments; we wonder whether these genotypes can show the same significance in the independent analysis? Therefore, we carried out independent ANOVA for normal planting which revealed significant high (P≤0.01) differences among genotypes for DH under normal planting (Table 2). DH ranged between 119 (genotype V-09136) and 125 days for genotypes V-076346 and V-7/2011 respectively, with mean value of 122 days. Highly significant (P≤0.01) differences among genotypes were observed for FLA under normal planting. Mean values for FLA under normal sowing was 33.3 cm2. Maximum FLA was observed for genotype NR-408 (42.5 cm2), while minimum FLA was recorded for genotype TW96010 (23.4 cm2) (Figure 2).

Figure 2. Frequency distribution of the studied traits under normal sowing. (A) Days to Heading (B) Flag Leaf Area (C) Plant Height (D) Days to Maturity (E) Spike Length (F) Grain Yield and (G) Harvest Index.
Highly significant (P ≤ 0.01) differences were observed for PH among genotypes under normal sowing (Table 2). PH ranged from 91.8 to 114.6 cm for genotypes V-7/2011and NR-408 (114.6 cm), respectively with the mean value of 104.4 cm. ANOVA for DM revealed significant (P≤0.05) differences among genotypes for normal planting. Maximum DM (166 days) were observed for genotype NIA-Sunehri, while minimum days (162 days) were attained by genotypes V-08BT016, V-09136, SD-998 and Fsd- 2008 (Figure 2).
Data for SL showed significant differences among genotypes under normal sowing. Maximum SL (13.8 cm) was attained by genotype NR- 408 whereas, minimum SL was acquired by genotype V-10306 (9.1 cm) under normal sowing. GY showed highly significant (P≤0.01) differences among genotypes under normal sowing (Table 2). Average GY under normal planting was 3.83 ton ha-1. Maximum GY under normal planting was exhibited by genotype V-07096 (5.34 ton ha-1), while minimum value was achieved by genotype NN-Gandam-2 (2.94 ton ha-1) with mean value 3.83 ton ha-1 under normal sowing. Independent ANOVA for HI showed significant (P ≤ 0.01) differences among genotypes under normal sowing. Independent mean was 38.4% with ranges from 28.1 to 51.7% under normal sowing. Maximum HI was perceived by genotype V-07096 (51.7%), while minimum HI was achieved by genotype NN-Gandam-2 (28.1%) under normal sowing (Figure 2).
Late sowing affects crop productivity
ANOVA for DH under late sowing depicted significance (P ≤ 0.05) differences among genotypes (Table 3). DH ranged from 103 days (genotype V-09136) to 108 days for genotypes NR-421, NR- 408, NR- 400, V-07096 and Aas-2011 with a mean of 106 days. Non-significant differences for FLA were observed under late planting (Table 3). Mean value for late plantings was 33.5 cm2 with maximum value achieved by genotype Aas-2011 (41.6 cm2) while, minimum value was observed for genotype NR-400 (23.1 cm2) (Figure 3).
| Latesowing | ||||
|---|---|---|---|---|
| Parameters | Replication | Genotypes | Error | CV% |
| Daystoheading | 2.06 | 3.99* | 2.50 | 1.49 |
| Flagleafarea | 539.99 | 47.38NS | 42.67 | 19.51 |
| Plantheight | 28.13 | 59.94** | 27.50 | 5.55 |
| Daysto maturity | 4.19 | 1.90NS | 1.52 | 0.85 |
| Spikelength | 1.11 | 1.27NS | 1.00 | 9.54 |
| Grain yield | 3.57 | 0.61* | 0.37 | 20.52 |
| Harvestindex | 216.78 | 95.12** | 50.76 | 20.11 |
Table 3: Mean squaresforvariousmorpho-yieldtraitsunderlateplanting.

Figure 3. Frequency distribution of the studied traits under late sowing. (A) Days to Heading (B) Flag Leaf Area (C) Plant Height (D) Days to Maturity (E) Spike Length (F) Grain Yield and (G) Harvest Index.
Independent ANOVA for PH revealed highly significant (P≤0.01) differences among genotypes. PH ranged from 84.7 to 102.3 cm with the mean value 94.4 cm. Maximum PH (102.3 cm) was achieved by genotype Fsd-2008, while minimum plant height was observed for genotype V-7/2011 (84.7 cm) under late planting. Non-significant differences were observed among genotypes for DM under late planting. Maximum DM (146 days) were achieved by genotypes NR-409, V-7/2011 and NIA-Sunehri, while minimum (142 days) were achieved by genotype V-09136 with the mean value of 144 days under late planting. Spike length under late sowing showed non-significant differences among genotypes (Table 3). Maximum SL was achieved by genotypes DN-84 and Aas-2011 (11.8 cm) while, V-10306 exhibited minimum (9.3 cm) SL accordingly (Figure 4).

Figure 4. Minimum and maximum values of the studied traits under normal and late sowing. (A) Days to Heading (B) Flag Leaf Area (C) Plant Height (D) Days to Maturity (E) Spike Length (F) Grain Yield and (G) Harvest Index.
Independent analysis showed significant (P ≤ 0.05) differences for GY among genotypes. Maximum GY under this planting time was recorded for V-09082 (4.15 ton ha-1) while, minimum GY (2.15 ton ha-1) was achieved by genotype TW96009 with the mean value 2.96 under late planting, respectively. Data for HI under late sowing showed significant high (P ≤ 0.01) differences among genotypes (Table 3). Mean value observed was 35.4% with ranges from 24.8 to 49.2% for genotypes TW96009 and V-09082, respectively (Figure 4).
Heritability (h2) estimates for production traits in bread wheat
Heritability can predict the interaction of inherited genes in succeeding generations and provide a vital component of response to selection for successful breeding programs [10]. As for as our results are considered, GEI showed significant differences in genotypes across environments; yet, we didn’t know whether these changes in yield were because of sowing dates or genotypes. Therefore, we performed h2 estimates for all the studied traits. Genotypic, phenotypic variances, and heritability (h2) for DH across two planting dates were 1.15, 1.56, and 0.74, respectively showing high trend of genetic material transformation. Genotypic variances for DH under normal and late conditions were 0.86 and 0.50, while phenotypic variances were 5.17 and 3.00, with h2 estimates of 0.17 and 0.17, respectively (Table 4). Genetic, environmental variances and h2 for FLA across two planting dates were 6.61, 32.12 and 0.54, respectively. Genotypic, phenotypic variances and h2 for FLA under normal conditions were 13.26, 34.83 and 0.38, respectively.
| Traits | Acrosstwoplantings | Normal | Late | |||||||
|---|---|---|---|---|---|---|---|---|---|---|
| δ2g | δ2ge | δ2p | h2BS | δ2g | δ2p | h2BS | δ2g | δ2p | h2BS | |
| Daystoheading | 1.15 | -0.48 | 1.56 | - | 0.86 | 5.17 | 0.17 | 0.50 | 3.00 | 0.17 |
| Flagleaf area | 6.61 | 0.81 | 12.23 | - | 13.26 | 34.83 | 0.38 | 1.57 | 44.25 | - |
| Plantheight | 11.19 | 4.86 | 16.61 | 0.67 | 21.28 | 39.33 | 0.54 | 10.81 | 38.32 | 0.28 |
| Daystomaturity | 0.41 | -0.18 | 0.61 | - | 0.34 | 1.93 | 0.18 | 0.13 | 1.65 | - |
| Spike length | 0.35 | 0.04 | 0.53 | - | 0.68 | 1.71 | 0.40 | 0.09 | 1.09 | - |
| Grainyield | 0.06 | 0.07 | 0.15 | 0.37 | 0.17 | 0.64 | 0.27 | 0.08 | 0.45 | 0.18 |
| Harvestindex | 8.64 | 8.53 | 19.76 | 0.44 | 19.54 | 68.16 | 0.29 | 14.79 | 65.55 | 0.23 |
Table 4: Heritabilityestimatesofadvancelinesofwheatforvarioustraitsundernormal,late,and across two planting dates.
Genetic, environmental variances, and h2 for PH across two planting dates were 11.19, 22.77, and 0.67, respectively. Genotypic variances for PH under normal and late conditions were 21.28 and 10.18, while phenotypic variances were 39.33 and 38.32, with h2 values of 0.54 and 0.28, respectively. Heritability estimates for DM across two planting dates were 0.41, 1.56 and 0.67, respectively. Genotypic, phenotypic variances and h2 values for DM under normal planting were 0.34, 1.93 and 0.18, respectively (Table 4). Genetic, environmental variances and h2 for SL across two planting dates were 0.35, 1.02 and 0.66, respectively. Genotypic, phenotypic variances and h2 for SL under normal planting were 0.68, 1.71 and 0.40. Genetic, environmental variances and h2 for GY across two planting dates were 0.06, 0.42 and 0.37, respectively. Genotypic variances for GY under normal and late sowing conditions were 0.17 and 0.08, while phenotypic variances were 0.64 and 0.45, with h2 values of 0.27 and 0.18.Values of genetic, environmental variances and h2 for HI two planting dates were 8.64, 49.70 and 0.44 respectively. Genotypic variances for HI under normal and late sowing conditions were 19.54 and 14.79, while phenotypic variances were 68.16 and 65.55, with h2 values of 0.29 and 0.23, respectively (Table 4).
Correlation analysis
Correlation is another tool other than heritability to find out the relativeness of the studied traits with each other. Therefore, we carried out correlation analysis of all traits included in our study. Correlation analysis for DH under normal sowing revealed its significant (P ≤ 0.01) association with DM (r=0.46) only, whereas, NS association was noticed with the rest of the traits. Under late sowing significant (P ≤ 0.01) correlation of DH with DM (r=0.28) and significant negative association with SL (r=-0.21) was observed, while no association was observed with the rest of the traits (Table 5). Correlation analysis for FLA under normal sowing revealed that it was highly significantly (P ≤ 0.01) correlated with PH (r=0.40) and SL (r=0.52) whereas, no association was observed with the rest of the traits. FLA under late sowing revealed that it was positive and significantly correlated with DM (r=0.20), SL (r= 0.31) and negatively with GY (r=-0.25) and HI (r=-0.22). Non-significant correlation was observed with the rest of the traits under late planting. Correlation analysis for PH under normal sowing revealed that it was significantly (P ≤ 0.01) correlated with FLA (r=0.40) and SL (r=0.52) while, NS correlation was observed for the rest of the traits. On the other hand under late sowing it was significantly (P ≤ 0.01) correlated with SL (r=0.33) and no association was found with the rest of the traits (Table 5). Correlation analysis carried out for DM under normal sowing indicated that it was positive and significantly (P ≤ 0.01) correlated with DH (r=0.46), while NS correlation was observed for the rest of the traits. Under late sowing correlation analysis for DM showed positive and significant correlation with DH (r=0.28) and FLA (r=0.20) (Table 5).
| DTH | FLA | PH | DM | SL | GY | HI | |
|---|---|---|---|---|---|---|---|
| DTH | - | -0.048 | 0.052 | 0.281** | -0.215* | 0.065 | 0.051 |
| FLA | 0.149 | - | 0.148 | 0.203* | 0.317** | -0.253** | -0.224* |
| PH | -0.095 | 0.408** | - | -0.029 | 0.330** | 0.006 | -0.035 |
| DM | 0.462** | 0.143 | -0.028 | - | -0.027 | 0.028 | -0.037 |
| SL | -0.077 | 0.525** | 0.521** | -0.004 | - | -0.159 | -0.053 |
| GY | 0.061 | 0.000 | 0.024 | 0.125 | 0.089 | - | 0.904** |
| HI | 0.081 | 0.032 | -0.021 | 0.111 | 0.117 | 0.940** | - |
Table 5: Phenotypic correlation coefficients of wheat advance lines for various traitsundernormal (belowdiagonal) andlate(above diagonal) sowing.
Data for SL in current research under normal sowing showed significant (P≤0.01) correlation with FLA (r=0.52) and PH (r=0.52). On the other hand under late sowing data for SL was significantly correlated with FLA (r=0.31), PH (r=0.33) and negatively associated with DH (r=-0.21) while non- significant association was observed with the rest of the traits. Correlation analysis under normal sowing indicated significant association of GY with HI (r=0.94) whereas, NS association was observed for the rest of the traits. Correlation analysis carried out for GY under late sowing showed negative and significant correlation with FLA (r=-0.25), and HI (r = 0.90) whereas, non-significant association was observed for the rest of the traits. Correlation analysis for HI under normal planting indicated its significant correlation with GY (r=0.94). Correlation analysis for HI under late planting was significantly correlated with GY (r=0.90) and it was negatively associated with FLA (r=-0.22) (Table 5).
PCA analysis was used other than correlation to identify the associations of variables in both normal and late sown plants. Altogether, both PCs explain 67.2% of the total variance of all the analyzed variables (Figure 5), where PC1 has the largest variance due to the orthogonal transformation. According to the PCA calculated for both planting dates, PC1 explains 44.6% of the total variance of the variables and the second factor (PC2) explains about 22.6%. The correlations between the variables were shown via the bi-plot analysis. The acute angle means a positive, the obtuse angle negative, and the right angle means no correlation between the measured parameters. Positive correlation was recorded among of FLA, SL and PH while FLA showed negative correlation with HI and GY. Furthermore, a very strong positive correlation was observed between DH and DM (Figure 5).

Figure 5. Graphical representation of PCA showing interrelationship among traits under two sowing dates in bread wheat genotypes.
Discussion
This study was conducted to analyze wheat genotypes with varying responses to two sowing dates revealing sufficient genetic divergence for various quantitative traits. Although, we detected most of the genotypes included in the study performed well, our study overall depicted that recommended time of sowing is effective in increasing crop production. Our results for DH are supported by the findings of [17] who also reported highly significant (P ≤ 0.01) differences among genotypes and NS (P>0.05) differences for GEI. There had been reduction in DH as a result of late planting supported by the findings [8]. Statistical analysis showed highly significant (P ≤ 0.01) differences for FLA among genotypes which confirmed the previous work of [18] and NS differences for GEI indicated no variation among lines over different planting dates supported by the findings of [19] who also reported significant differences among genotypes and NS differences for GEI (Table 1). Independent ANOVA for FLA revealed significant high (P ≤ 0.01) differences among genotypes under normal planting and NS differences were observed under late planting. Highly significant (P ≤ 0.01) differences among genotypes for PH showing variation in PH were compatible with the findings of [17, 20]. The significant (P ≤ 0.01) GEI for PH indicated variability over different planting dates was in conformity with the findings [17] (Table 1). Independent ANOVA revealed significant (P ≤ 0.01) differences among genotypes for both planting dates supported by the findings of [21] (Table 2 and 3). Results of the present study were confirmed by the findings of [8, 20] who also reported non-significant GEI for DM.
Differences among genotypes for SL were significant (P ≤ 0.01) showing differences among lines while, NS (P>0.05) differences were observed for environments and GEI, confirming the previous findings [19] (Table 1). Statistical analysis for GY across both planting dates revealed significant (P≤0.05) differences among genotypes, environments, and GEI as earlier reported by [19,22]. HI across both planting dates revealed significant (P≤0.05) differences among genotypes and GEI showing variation for HI in lines over different planting dates (Table 1). Similar results were obtained by [22].
Heritability was high for DH which is in line with the findings of [19, 20]. Furthermore, we confirmed the finding of [23] who also documented moderate value of h2 for FLA. Moreover, PH, DM and SL exhibited high h2 value across two planting dates supported by the findings of [19,20,24]. Heritability for GY and HI across two planting dates were 0.37 and 0.44, respectively which were in line with the findings of [18,19,24] who also found medium value of heritability for these traits (Table 4).
Our results validated the findings of [25] who also reported relationship of DH with SL but no relationship with yielding traits. Further, [17,26] reported significant positive correlation of FLA and PH with SL. Our results are in support with that of [25] who also reported NS association of DM with yield and yield contributing traits. In case of GY, significant correlation was noticed with HI confirming [27], while contrasting results were reported for association of GY with FLA and yield related traits [28]. For HI, [27] reported significant correlation with GY while, NS and negative association between HI and yielding traits were reported [29] supporting our results (Table 5).
Conclusion
To conclude, this study provides analysis of wheat genotypes with varying responses to two sowing dates revealing sufficient genetic divergence for various quantitative traits. Although, we detected most of the genotypes included in the study performed well, our study overall depicted that recommended time of sowing is effective in increasing crop production. Genotype DN-84 took less number of DH while, V-09136 had minimum values for DH and DM. Maximum FLA, PH, and SL were observed for a single genotype NR-408. High GY and HI were recorded for genotype V-07096 and WRIS-12, respectively. Heritability (h2) estimates for DH, PH, DM, and SL ranged between 60 and 74% while 37 to 54% for FLA, GY and HI. Correlation coefficients were significant for various traits. PCA analysis showed that dates clustered the variables differently but in a similar pattern. Based on our findings, we suggest genotypes V-09136, PR- 103, NR-400, V-08BT016, and V-07096 for further investigation. Further, the genetic potential of the mentioned lines for the desired traits can be utilized in future wheat breeding programs to get promising results.
Author Contributions
All authors contributed to the study conception and design. Material preparation and data collection were executed by Sajid Muhammad and Fida Mohammad. Ali Muhammad and Muhammad Afzal analyzed the data. The first draft of the manuscript was written by Sajid Muhammad and Md Musfeq-Ul Hasan. All authors commented on previous versions of the manuscript and approved the final version.
REFERENCES
- Olesen JE, Børgesen CD, Elsgaard L, Palosuo T, P. Rötter R, Skjelvåg AO, et al. Changes in time of sowing, flowering and maturity of cereals in Europe under climate change. Food Additives & Contaminants: Part A. 2012;29(10):1527-1542.
- Thapa S, Thapa A, Thapa B, Ghimire A, Adhikari J. Impacts of sowing and climatic conditions on wheat yield in Nepal. Malaysian Journal of Halal Research. 2020;3(1):38-40.
- Laskowski W, Górska-Warsewicz H, Rejman K, Czeczotko M, Zwolińska J. How Important are Cereals and Cereal Products in the Average Polish Diet? Nutrients. 2019;11(3):679.
- Fahad S, Bajwa AA, Nazir U, Anjum SA, Farooq A, Zohaib A, et al. Crop production under drought and heat stress: plant responses and management options. Frontiers in plant science. 2017;8:1147.
- Raza A, Razzaq A, Mehmood SS, Zou X, Zhang X, Lv Y, et al. Impact of climate change on crops adaptation and strategies to tackle its outcome: A review. Plants. 2019;8(2):34.
- Ahmar S, Gill RA, Jung KH, Faheem A, Qasim MU, Mubeen M, et al. Conventional and Molecular Techniques from Simple Breeding to Speed Breeding in Crop Plants: Recent Advances and Future Outlook. International Journal of Molecular Sciences. 2020;21(7):2590.
- Singh MK, Mishra A, Khanal N, Prasad SK, et al. Effects of sowing dates and mulching on growth and yield of wheat and weeds (Phalaris minor Retz.). Bangladesh Journal of Botany. 2019;48(1):75-84.
- Poudel MR, Poudel HK, Pandey MP, Thapa DB, Dhakal HR, et al. Evaluation of Wheat Genotypes under Irrigated, Heat Stress and Drought Conditions. Journal of Biology and Today's World. 2020;9(1):1-12.
- Nowosad K, Tratwal A, Bocianowski J. Genotype by environment interaction for grain yield in spring barley using additive main effects and multiplicative interaction model. Cereal Research Communications. 2018;46(4):729-738.
- Fasoula DA, Ioannides IM, Omirou M. Phenotyping and Plant Breeding: Overcoming the Barriers. Frontiers in plant science. 2020;10:1713.
- Siddiqui KA, Mustafa G, Arain MA, Jafri KA. Realities and possibilities of improving cereal crops through mutation breeding, in Plant mutation breeding for crop improvement. 1991.
- Engqvist GM, Becker HC. Correlation studies for agronomic characters in segregating families of spring oilseed rape (Brassica napus). Hereditas. 1993;118(3):211-216.
- Khan MAU, Mohammad F. Effect of genotype× environment interaction on grain yield determinants in bread wheat. Sarhad Journal of Agriculture. 2018;34(1):54-62.
- Gomez KA, Gomez AA, Statistical procedures for agricultural research. John Wiley & Sons. 1984.
- Panse V. Statistical methods for agricultural workers. Indian council of agricultural research new delhl. 1967.
- Singh RK, Chaudhary BD. Biometrical methods in quantitative genetic analysis. Biometrical methods in quantitative genetic analysis. 1977.
- Khan A, Mohammad F, Hassan G, Khalil IH. Genotypic competition among elite wheat breeding lines under irrigated and rainfed conditions. Sarhad Agric. 2012;28(1):47-52.
- Azam, S.M., et al., Divergence in F3 segregating bread wheat populations. Int. J. Basic and App. Sci, 2013. 13(3): p. 94-99.
- Khan, N. and F. Naqvi, Heritability of morphological traits in bread wheat advanced lines under irrigated and non-irrigated conditions. Asian Journal of Agricultural Sciences, 2011. 3(3): p. 215- 222.
- Zare-kohan M, Heidari B. Estimation of genetic parameters for maturity and grain yield in diallel crosses of five wheat cultivars using two different models. Journal of Agricultural Science. 2012;4(8):74.
- Khan F, Khan MI, Khan S, uz Zaman MA, Rasheed H, Khan AR. Evaluation of agronomic traits for yield and yield components in wheat genotypes with respect to planting dates. Malays J Sustain Agric. 2018;2(1):7-11.
- Gholamin R, Zaeifizadeh M, Khayatnezhad M. Factor analysis for performance and other characteristics in durum wheat under drought stress and without stress. Middle-East Journal of Scientific Research. 2010;6(6):599-603.
- Khan SA, Hassan. Heritability and correlation studies of yield and yield related traits in bread wheat. Sarhad Journal of Agriculture. 2017;33(1):103-107.
- Abinasa M, Ayana A, Bultosa G. Genetic variability, heritability and trait associations in durum wheat (Triticum turgidum L. var. durum) genotypes. African Journal of Agricultural Research. 2011;6(17):3972-3979.
- Anwar J, Ali MA, Hussain M, Sabir W, Khan MA, Zulkiffal M, et al. Assessment of yield criteria in bread wheat through correlation and path analysis. Journal of Animal and Plant Sciences. 2009;19(4):85-188.
- Chen W, Zhang J, Deng X. The spike weight contribution of the photosynthetic area above the upper internode in a winter wheat under different nitrogen and mulching regimes. The Crop Journal. 2019;7(1):89-100.
- Ali S, Shah SMA, Hassnain A, Shah Z, Munir I, et al. Genotypic variation for yield and morphological traits in wheat. Sarhad Journal of Agriculture. 2007;23(4):943.
- Munir M, Chowdhry MA, Malik T. Correlation studies among yield and its components in bread wheat under drought conditions. International Journal of Agriculture and Biology . 2007;9(2):287-290.
- Khayatnezhad M, Evaluation of the reaction of durum wheat genotypes (Triticum durum Desf.) to drought conditions using various stress tolerance indices. African Journal of Microbiology Research. 2012;6(20):4315-4323.
Citation: Muhammad S, Afzal M, Hasan MMU, Muhammad A, Mohammad F (2021) Variations in Yield along a Phenological Gradient in Bread Wheat (Triticum aestivum L.). Agrotechnology 10: 214.
Copyright: © 2021 Muhammad S, et al. This is an open-access article distributed under the terms of the Creative Commons Attribution License, which permits unrestricted use, distribution, and reproduction in any medium, provided the original author and source are credited.