20+ Million Readerbase
Indexed In
  • Open J Gate
  • Cosmos IF
  • RefSeek
  • Hamdard University
  • EBSCO A-Z
  • OCLC- WorldCat
  • Publons
  • Geneva Foundation for Medical Education and Research
  • Euro Pub
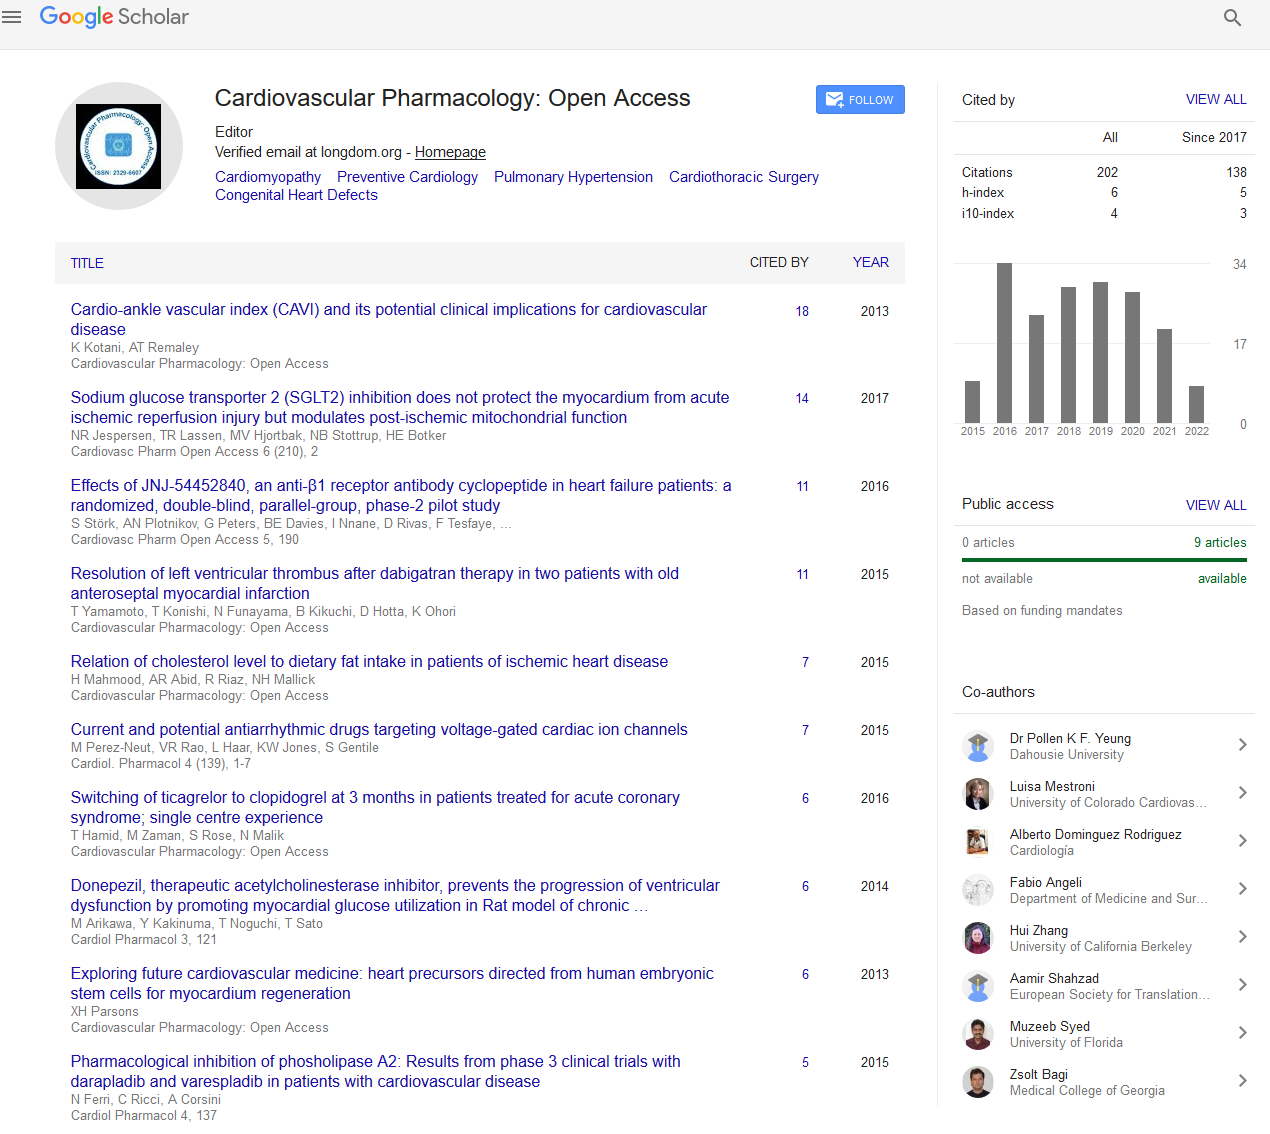
  • Google Scholar
Share This Page
Journal Flyer
Flyer image

Research Article - (2017) Volume 6, Issue 5

The Link between Early Biomarker Analysis and the Neurological Outcome in Stroke Patients

De Waele S1 and Hachimi-Idrissi S1,2*
1UGent University, Faculty of Medicine and Health Sciences, Belgium
2Ghent University Hospital, de Pintelaan, 185, 9000, Ghent, Belgium
*Corresponding Author: Hachimi-Idrissi S, Department of Emergency Medicine, Ghent University Hospital, De Pintelaan 185, 9000 Ghent, Belgium, Tel: +32 93324409, Fax: +329332 Email:

Abstract

Stroke patients have an uncertain prognosis. It has been postulated that biomarkers’ concentrations upon admission could be linked to the neurological outcome. This meta-analysis reviewed the literature and collected data for 65 biomarkers. To increase power of evidence, only biomarkers who were:

• Significant in the meta-analysis,

• Reported by two or more studies conducted by different authors,

• Displaying more than 300 patients and

• Displaying less or equal to 60% heterogeneity were retained.

Eight biomarkers were found to be relevant; TNFα, white blood cell count, non-fasting glucose, GPT, D-dimer, fT3, cortisol and MRproANP. These except for GPT and fT3 show the same trend: a low concentration at admission is linked to a good outcome. For GPT and fT3 the reverse was observed; a low concentration in the acute phase was linked to an adverse outcome. Early biomarker analysis would help the physician to determine the extent of the neurological deficit in stroke patients. This can guide them to implement new treatment strategies such as intensive rehabilitation or a more aggressive treatment.

Keywords: Biomarkers; Stroke prognosis; TNFα; White blood cell count; Hyperglycemia; GPT; D-dimer; FT3; Cortisol; MRproANP

Abbreviations

25(OH)D: 25-hydroxyvitamin D; BNP: Brain Natriuretic Peptide; CD40L: Cluster of Differentiation 40 Lind; CRP: C-reactive Protein; END: Early Neurological Deterioration; FDP: Fibrin Degradation Products;Ft3: Free Thriiodothryonine; GDF-15: Growth Differentiation Factor 15; GOT:Glutamate-oxaloacetate Transaminase; GPT:Glutamatepyruvate Transaminase; HCY:Homocysteine; HDL-c: High-density Lipoprotein Cholesterol; hFABP: Heart-type Fatty Acid Binding protein; HMGB-1: High Mobility Group Box1; HS: Haemorrhagic Stroke; hsCRP: High Sensitivity C-Reactive Protein; HSP-27: Heat Shock Protein 27; HT: Haemorrhagic Transformation; IGF-1: Insulinlike Growth Factor-1; Il-6: Interleukin-6; Il-8: Interleukin-8; Il-10: Interleukin-10; IQR: Interquartile Range; IS: Ischemic Stroke; LDL-c: Low-density Lipoprotein Cholesterol; Lp(A): Lipoprotein A; MACO: Major Adverse Clinical Outcome; MCP-1: Monocyte Chemotactic Protein 1; miR16: microRNA 16; miR-124-3p: microRNA 124 3p; MM-9: Matrix Metalloproteinase 9; MRproANP: Midregional Pro- Atrial Natriuretic Peptide; mRs: Modified Rankin Scale;NgB: Neuroglobin; NSE: Neuron Specific Enolase; NTproBNP: N-terminal prohormone of BNP; OPN: Osteopontin; PAI-1: Plasminogen Activator Inhibitor-1; PCT: Procalcitonin; PRGN: Progranulin; proCPU: Procarboxypeptidase U; rtPA: Recombinant Tissue Plasminogen Activator; S100β: Calcium Binding Protein β; SD: Standard Deviation; T3: Thriiodothryonine; T3/fT4: Ratio of Thriiodothyronine and Free thryoxine; TC: Total Cholesterol; TG: Triglycerides; TNFα: Tumor Necrosis Factor Alpha; t-PA: Tissue Plasminogen Activator; WBC: White Blood Cell Count.

Introduction

Stroke is the 2nd most common cause of death and the 3rd most common cause of disability worldwide [1]. Daily, many stroke patients are admitted to the emergency room (ER), their prognosis remains uncertain. A stroke’s outcome is estimated through various clinical variables. Stroke severity upon admission is the most important predictive factor. The more severe the neurological impairment, the more likely the chance of an adverse outcome [2]. The extent of the neurological deficits at admission is usually measured by the National Institute of Health Stroke Scale (NIHSS). Scores range from 0 to 42 with 0 representing no neurological impairment, 42 representing the most severe stroke possible [3]. Other predictors of adverse outcomes are advanced age (>65 years), previous stroke, peripheral artery disease, increasing time between onset and admission and diabetes [4,5]. There are two subtypes of stroke: ischemic strokes (IS) and haemorrhagic strokes (HS). An IS occurs when the blood supply to a part of the brain is interrupted or insufficient. They account for 80% of strokes. A HS occurs when a blood vessel is ruptured and represents 20% of all strokes [6]. HS are usually more severe than IS and have worse survival rates [7]. Complications may further aggravate a patient’s functional prognosis, such as haemorrhagic transformation (a known complication following recombinant tissue plasminogen activator (rtPA) therapy), fluid depletion, hyper- or hypoglycemia and fever [2].

In stroke survivors most recovery occurs in the first six months though improvement may be observed up until 18 months [5]. Some sources state that regain of function can occur till 2 years after a stroke [2]. 40% to 60% of all stroke patients regain functional independence between 3 months and 10 years [5]. 44% of stroke survivors report no or light disabilities. This means that more than half of stroke victims suffer medium to severe disabilities. These range from physical problems e.g. hemiparesis, difficulty speaking, reduced cognitive capacity to emotional difficulties [2]. The modified Rankin Scale (mRS) is used to depict a patient’s capabilities and handicaps after a stroke insult. This score ranges from 0 to 6. Scores from 0-2 means the patient is independent in activities of daily living; 3-5 depicts dependence in daily life, 6 represents death [8].

Some authors have studied clinical variables (such as age, sex, comorbidities, etc.) and their relation to the outcome [9]. Others have implemented these clinical variables into predictive models and both studies found age and severity of stroke to be associated with the outcome and suitable for use in a predictive model [10,11]. Reid included other variables such as ability to lift both arms, pre-stroke ability, ability to walk independently etc. and found that these variables improved the predictive capabilities of their model [10]. Swarowska attempted to improve their predictive model based on stroke severity and age by addition of fibrinogen levels. They did not find that this addition significantly increased the discrimination ability of their model [11]. This further proves that, although there is evidence that biomarkers correlate to the outcome, actually implementing biomarkers into predictive models remains a challenge due to conflicting results [10,12,13].

Our meta-analysis will highlight the most important biomarkers analysed upon admission and correlate them with the patient’s prognosis. Also, we highlight which early biomarkers could be of interest in a clinical setting.

Methodology

The literature of the last six years was analysed using the MeSH terms ‘stroke, ‘prognosis’ and ‘biomarkers’ on Pubmed. Only studies published between 01/01/210 and 01/01/2017 in English pertaining human subjects were considered. Articles were excluded if they focussed on the effect of a therapy or intervention, used death as the primary outcome instead of neurological prognosis, focused on cardiovascular events other than stroke, focused on the pathogenesis of a stroke or were reviews, case reports or study protocols. In Figure 1, the flow chart of the literature selection is shown as are the exclusion criteria. 121 articles were retained as relevant within the scope of this article yet many did not have their data available. In total 37 studies were included in the meta-analysis, highlighting 65 different biomarkers. From all eligible reports, data was extracted and input into Revman 5.3 for further analysis. Two groups of patients were defined; good outcome and poor outcome patients. These groups were divided based on NIHSS score or mRS score. The cut-off value of the NIHSS score was usually set at 12, with the group having a score of 12 or more being defined as the poor outcome group. When using the mRS, patients with a score of 3 or higher were defined as the adverse outcome group. Mean biomarker’s concentrations at admission were compared between these groups. When the median and IQR were reported instead of the mean and SD, the method suggested by Wan was used to derive the mean and SD [14].

cardiovascular-pharmacology-Literature-search

Figure 1: Literature search.

Because of the limited number of patients included in different studies, extra criteria for significance were applied in this meta-analysis to increase power of evidence. Only the biomarkers that were

• Significant in the meta-analysis,

• Reported in two or more studies analysed by different authors,

• Displaying a large number of patients (300 or more) and

• Displaying a mild amount of heterogeneity (≤ 60% defined by the Cochrane Handbook) was considered significant [15].

A biomarker was considered statistically significant if the P-value was equal to or less than 0.05.

Results

All 65 biomarkers were further divided into different groups to facilitate reporting. These categories are; inflammatory biomarkers, metabolic biomarkers, haemostatic biomarkers, endocrine biomarkers, neuronal biomarkers, astroglial biomarkers, anti-apoptotic biomarkers and anti-angiogenic biomarkers. This method of reporting was based on Park [16].

Table 1 is an overview of all biomarkers per category. This table includes the studies references, sample size, heterogeneity and P-value per biomarker.

Biomarker (references) Sample size Heterogeneity P-value
Inflammatory
CRP [16,32,39,53,54] 776 87% 0.0002
hsCRP [23,32] 501 88% 0.003
IL-6 [16,17,55] 697 92% 0.23
IL-8 [17] 105 - 0.08
IL-10 [18] 135 - 0.00001
MMP-9 [16,56] 263 96% 0.68
TNFα [16-18] 415 0% 0.01
OPN [57] 130 - 0.33
Procalcitonin [58] 378 - 0.00001
CD40L [17] 105 - 0.11
HCY [23,32] 501 88% 0.0002
WBC [16,18,21-25] 1755 43% 0.001
HMGB-1 [59] 338 - 0.00001
GDF-15 [54,55] 321 67% 0.03
MCP-1 [60] 30 - 0.62
Monocytes [60] 30 - 0.86
Metabolic
TC [23,25,32,54,59,61,62] 3211 34% 0.12
TG [28-30,36,38,39,41] 3211 14% 0.59
LDL-c [16,32,54,59,61,62] 2801 0% 0.79
HDL-c [23,32,54,59,61,62] 2672 61% 0.05
Fasting glucose [16,62] 1668 67% 0.04
Non-fasting glucose [22,23,25,32,57,59,61,63] 2218 0% 0.00001
Uric acid [32,63] 378 0% 0.51
Adiponectin [64] 82 - 0.42
Creatinine [16,18,32,63] 962 55% 0.82
Lp(a) [25] 153 - 0.00001
Glutamate [21] 347 - 0.00001
Calcium [62] 1493 - 0.20
Magnesium [62] 1493 - 0.005
Potassium [62] 1493 - 0.02
Bilirubin [65] 44 - 0.24
GOT [21,32] 554 94% 0.05
GPT [21,32] 554 0% 0.0001
BUN [32] 189 - 1.00
Haemostatic
FDP [17] 105 - 0.01
Fibrinogen [17,22,25,32,61] 1080 92% 0.10
D-dimer [16,17,32,36] 1642 60% 0.0005
PAI-1 [16,17] 280 86% 0.31
t-PA [17] 105 - 0.98
Platelets [21,22,24,25] 1133 59% 0.80
Decrease proCPU [66] 136 - 0.17
Endocrine
TSH [39,40,44] 767 86% 0.75
fT3-fT4 [39] 88 - 0.08
T3 [44] 281 - 0.0001
fT3 [39,40] 486 16% 0.01
fT4 [39,40,44] 767 0% 0.32
T3-fT4 [44] 281 - 0.02
GH [44,67] 321 33% 0.07
IGF-1 [68] 168 - 0.00001
Cortisol [32,44,45] 693 59% 0.00001
25(OH)D [69] 326 - 0.00001
Copeptin [22,32,70] 650 81% 0.00001
BNP [32] 189 - 0.00001
NTproBNP [32] 189 - 0.0003
MRproANP [49,50] 4002 0% 0.00001
Neuronal
NSE [16] 175 - 0.11
NgB [16] 175 - 0.0001
hFABP [16] 175 - 0.00001
Astroglial
S100β [16,55] 232 0% 0.00001
Anti-apoptotic
Thioredoxin [23] 312 - 0.00001
HSP-27 [71] 123 - 0.56
mi-R16 [72] 84 - 0.19
miR-124-3p [72] 84 - 0.52
PRGN [73] 216 - 0.00001
Anti-angiogenic
Endostatin [74] 109 - 0.003

Table 1: Overview of biomarkers.

Figure 2 displays a forest plot of all biomarkers which remained significant after applying the four extra criteria. From this forest plot the nature of the association between a biomarker’s measure and the neurological outcome can be derived.

cardiovascular-pharmacology-Forest-plot-biomarkers

Figure 2: Forest plot of biomarkers.

Inflammatory biomarkers

In this group, C-reactive protein (CRP), high-sensitive C-reactive protein (hsCRP), interleukin-6 (IL-6), interleukin-8 (IL-8), interleukin-10 (IL-10), matrix metalloproteinase 9 (MMP-9), tumor necrosis factor α (TNFα), osteopontin (OPN), procalcitonin (PCT), cluster of differentiation 40 ligand (CD40L); homocysteine (HCY), white blood cell count (WBC), high-mobility-group box-1 (HMGB-1), growth differentiation factor 15 (GDF-15), monocyte chemoattractant protein 1 (MCP-1) and monocyte count were reported. As it is showed in Table 1; CRP, hsCRP, IL-10, TNFα, PCT, HCY, WBC, HMGB-1 and GDF-15 were significantly correlated with the outcome. CRP, hsCRP, IL-6, MMP-9 HCY, GDF-15 all had a heterogeneity of more than 60%. IL-8, IL-10, OPN, Procalcitonin, CD40L, HMGB-1, MCP-1 and monocytes were reported in only one study. After applying the extra criteria only TNFα and WBC remained significant. Both biomarkers are depicted in Figure 2. As it can be seen in the forest plot; a low concentration of these biomarkers at admission was associated with a good neurological outcome.

Metabolic biomarkers

Here total cholesterol (TC), triglycerides (TG), low-density lipoprotein-cholesterol (LDL-c), high density lipoprotein- cholesterol (HDL-c), fasting glucose, non-fasting glucose, uric acid, adiponectin, creatinine, lipoprotein a (Lp(a)), glutamate, calcium, magnesium, potassium, bilirubin, glutamate-oxaloacetate transaminase (GOT), glutamate-pyruvate transaminase (GPT) and blood urea nitrogen (BUN) were analysed. Glucose (both fasting and non-fasting), Lp (A), glutamate, magnesium, potassium and GPT were statistically significant. When applying the four criteria, only non-fasting glucose and GPT remained. The analysis of fasting glucose showed a large amount of heterogeneity. The other significant biomarkers were reported in but one study. Figure 2 depicts both non-fasting glucose and GPT. A low concentration of non-fasting glucose at admission was associated with a good neurological outcome. However, when GPT concentration was low a poor neurological prognosis was observed.

Haemostatic biomarkers

In this group fibrin degradation products (FDP), fibrinogen, D-dimer, plasminogen activator inhibitor-1 (PAI-1), tissue plasminogen activator (tPA), platelet count and procarboxypeptidase U (proCPU) were evaluated. Both FDP and D-dimer were statistically significant however FDP is reported in only one study. D-dimer showed a clear association with the outcome; a low concentration was linked to a good outcome.

Endocrine biomarkers

Thyroid stimulating hormone (TSH), ratio of thriiodothyronine and free thryoxine (T3/fT4), thriiodothryonine (T3), free thriiodothryonine (fT3), free thryroxine (fT4), ratio of thriiodothyronine and free thryoxine T3/fT4, growth hormone (GH), insulin-like growth factor-1 (IGF-1), cortisol, 25-hydroxyvitamin D (25(OH)D), copeptin, brain natriuretic peptide (BNP), N-terminal prohormone of BNP (NTproBNP) and midregional pro-atrial natriuretic peptide (MRproANP) were evaluated. These biomarkers except for TSH, fT3/T4, fT4 and GH were significant. T3, T3/fT4, IGF-1, 25(OH)D, BNP and NTproBNP were all reported in only one study. Copeptin’s analysis contains too much heterogeneity (I2=81%). Only fT3, cortisol and MRproANP fulfil all extra criteria. As showed in Figure 2, low concentrations of fT3 were linked to a bad neurological outcome. Low concentrations of cortisol and MRproANP however were linked to a good neurological outcome.

Neuronal biomarkers

Neuron specific enolase (NSE) in serum, neuroglobin (NgB) and heart-type fatty acid binding protein (hFABP) were reported in this group with statistical significance reached for NgB and hFABP. These were only reported in one study and could not fulfil the extra criteria.

Astroglial biomarkers

S100 calcium binding protein β (S100β) as a biomarker was analysed in this subgroup. This biomarker reached statistical significance but because of its small size, it was excluded.

Anti-apoptotic biomarkers

In this category five biomarkers were analysed: thioredoxin, heat shock protein 27 (HSP-27), microRNA 16 (miR-16), microRNA 124-3p (miR-124-3p) and progranulin (PRGN). Thioredoxin and PRGN reach statistical significance in our meta-analysis, but both were reported in one study and therefore were not retained.

Anti-angiogenic biomarkers

Endostatin was statistically significant but only reported in one study. In conclusion TNFα, WBC, non-fasting glucose, GPT, D-dimer, fT3, cortisol and MRproANP could be related to stroke outcome. These except GPT and fT3 showed the same trend; a low concentration was linked to a good neurological outcome. For GPT and fT3 a reverse association was seen; a low concentration at admission was linked to a bad neurological outcome. Generally, the strongest evidence presents itself for non-fasting glucose. This biomarker is reported in eight different studies conducted by different authors, has a sample size of 2218, a heterogeneity of 0% and a P-value of less than 0.00001.

Discussion

A low mean concentration of TNFα was associated with a good neurological outcome (Figure 2). Park and Zeng measured the outcome at three months, based on the mRs [16,17]. Chang measured the outcome at 48h through the use of the NIHSS [18]. A review by Laborde also found a link between low concentrations of TNFα at admission and good outcomes, further strengthening our conclusions [19]. A possible explanation for this association is that inflammation following brain ischemia upregulates cytokines and chemokines leading to secondary brain damage. TNFα is closely related to these upregulated molecules and can further increase their detrimental effects [17]. Interesting to mention is that Rothstein noticed a possible link between a high concentration of TNFα and Early Neurological Deterioration (END). END being defined as worsening of the neurological status 48-72 h after admission [12]. END can possibly be linked to a worse clinical outcome [20]. The question remained if TNFα is linked to the prognosis or linked to END, which could in turn complicate the patient’s outcome.

In our meta-analysis, a low WBC count was linked to a better outcome. Four studies measured the outcome at three months, but could not confirm a link with the prognosis in their own analyses [21-24]. In the studies that did reach significance, two measured the outcome at three months, one at discharge and one at 48 h [16,18,24,25]. The difference in time of end points cannot explain the discrepancies in conclusions between the studies. Furthermore, a study by Zhou whose data could not be included also found high WBC counts to be associated with a bad outcome [26]. Another study conducted by Tsai did not look into the relation between WBC counts and the outcome but did find that WBC counts are linked to major adverse clinical outcomes (MACO; recurrent stroke or death) [27]. The question remains in this case whether WBC counts are merely a risk indicator of MACO or if they are in fact related to the outcome, independent from a recurrent stroke.

A lower concentration of non-fasting glucose was linked to a good outcome. Hasan concluded in their report that high levels of glucose were a strong predictor for poor outcome following an ischemic stroke [28]. Another study from 2015 by Masrur found that both acute and chronic hyperglycemia were associated with worse post-stroke outcome, regardless whether diabetes was diagnosed before occurrence of the stroke or not [29]. Both studies reached the same conclusion as this meta-analysis. What should be considered is that this biomarker is severely influenced by the patient’s last meal but also by their level of insulin resistance. This resistance could in turn be part of the etiology of a stroke and cause hyperglycemia which ultimately could exacerbate the stroke [30,31]. In our meta-analysis, the most robust evidence was collected for this biomarker.

Low GPT concentrations were significantly associated with a bad stroke outcome in our meta-analysis. Both studies were independently significant. Both measured the outcome at three months [21,32]. It can be assumed that low GPT concentrations at admission predict a bad neurological outcome at three months post stroke. However, no studies researched the link between GPT and the outcome at other points and as such this remains an assumption. GPT metabolizes glutamate in the peripheral blood, possibly reducing the risk of excitotoxicity [21,33]. In rats, GPT was proven to exert neuroprotective effects due to breakdown of glutamate in the peripheral blood [34,35].

D-dimer was the only biomarker significant in the group of the haemostatic biomarkers. As can be observed in the forest plot, three studies were significant and independently associated with the outcome, the study by Zeng was not. This study measured the outcome at three months [17]. Wang measured the mRS at one month post stroke, the other two significant studies also measured the outcome at three months [16,32,36]. A study by Matsumoto whose data could not be included found a link between low D-dimer concentrations and a good outcome at discharge. They did not mention the length of stay in the hospital [37]. The discrepancy in individual findings cannot be explained by different measuring points in time. Interesting to note is that Yuan analysed the D-dimer levels between the different subtypes in strokes and found that this biomarker most clearly relates to strokes of cardio-embolic origin. They also concluded that low D-dimer levels correlate with a better prognosis [38]. This further supports our conclusion.

Low fT3 concentrations were linked to poorer outcome. Both included studies reached significance [39,40]. Ambrosius split 377 patients into tertiles based on fT3 levels; ≤ 1.95 pg/mL, >1.95 pg/mL and 41]. A recent study by Liu found a link between low fT3 levels and a poorer outcome at discharge [42]. Ma found that fT3 negatively correlates to CRP and the NIHSS and positively correlates to albumin concentrations. They postulate that fT3 might be involved in the inflammatory process following a stroke and might be able to predict stroke severity [43]. This could suggest that fT3 is linked to other inflammatory biomarkers, but is not an independent biomarker by itself.

A lower cortisol concentration at admission is associated with a good outcome. All three included studies measured the outcome at three months [32,44,45]. Low cortisol levels are possibly linked to a good outcome at three months. Reports by Katan and Bustamante came to the same conclusion as in our meta-analysis [46,47]. A review by Barugh found that cortisol levels should be linked to the patient dependency, morbidity and mortality but they emphasized that it is not clear whether cortisol relates to these outcomes or relates to the initial stroke severity [48]. Cortisol is a stress-related hormone, and may reflect the degree of severity of the cerebral insult and hence the neurological outcome. Stroke severity is known to be a good predictor of the outcome [5].

We found that a lower MRproANP concentration at admission was linked to a good outcome [49,50]. Bustamante supports our finding [47]. A review by Katan found that a low concentration of MRproANP was a good biomarker for a favourable outcome and notices that MRproANP was proportionally more elevated in strokes of cardioembolic origin than in other subtypes [46]. These support our findings. A prospective cohort study concluded that people with an elevated MRproANP are at a higher risk to experience a cardio-embolic stroke. The risk of other stroke subtypes is not elevated [51]. MRproANP is a precursor hormone of atrial natriuretic peptide (ANP) which regulates blood pressure [52].

Prognostication is paramount in ER. Early biomarkers analysis would help the physician to determine the extent of the neurological deficit in stroke patient and hence guiding them to implement new treatment strategies such as intensive rehabilitation or a more aggressive treatment. Also valid biomarkers could be implemented into predictive models and to further delignate the type of stroke.

Conclusion

We can conclude that many biomarkers in the literature were proposed as being relevant, however only a very few were significant or provide enough evidence. The evidence was most robust for TNFα, WBC, non-fasting glucose, GPT, D-dimer, fT3, cortisol and MRproANP. Especially non-fasting glucose stands out due to its strong evidence. Some other biomarkers such as CRP, though frequently reported, failed to confirm their association in our meta-analysis. These biomarkers are associated to the neurological prognosis however many studies individually did not reach statistical significance. Not all of these discrepancies can be caused by population bias, small sample sizes or different end points in time and therefore more research is needed.

Future research should focus on reporting the biomarkers in categories of low, medium and high concentrations and correlating these to the outcome of the patients. This might be more adequate in finding a potential link between concentration and outcome. Trials should further focus on biomarkers’ temporal profiles and the consequences thereof for the predictive model. Follow-up of patients should be longer. Ultimately a follow-up at three months, six months and one year would be ideal to fully determine a biomarker’s predictive capacities.

Finally, more research is needed before we can fully understand the link between biomarkers and the stroke prognosis. The eight biomarkers found in our meta-analysis should each be re-evaluated with special attention to non-fasting glucose.

Limitations

This meta-analysis was a non-exhaustive review of the literature, only the last six years were evaluated. Extending the period might increase the number of articles, and hence the relevance and the significance. Only 37 clinical trials could be included because several trials did not publish their data.

This paper included both IS and HS but made no differentiation between them in the meta-analysis. Because of their inherent differences in etiology, splitting these would’ve further provided more robust evidence and perhaps more clear findings for certain biomarkers. Few articles however analysed HS and as such the influence on the results would be limited.

Articles reported neurological impairment usually through use of the mRS scale and NIHSS scale. The NIHSS scale however is more suitable for evaluating the stroke severity; less so for the prognosis. Also, these scales are inherently difficult to assess and as such may introduce some bias. Other articles also included the fatal cases in their poor outcome group, other studies did not.

Financial Disclosure/Acknowledgement

The authors have no relevant affiliations or financial involvement with any organization or entity with a financial interest in or financial conflict with the subject matter of materials discusses in the manuscript. This includes employment, consultancies, honoraria, stock ownership or options, expert testimony, grants or patents received or pending, or royalties.

References

  1. Lozano R, Naghavi M, Foreman K, Lim S, Shibuya K, et al. (2010) Global and regional mortality from 235 causes of death for 20 age groups in 1990 and 2010. Global Burden of Disease Study 380: 2095-2128.
  2. Kuks JB, Snoek JW (2016) Leerboek Klinische Neurologie. Bohn Stafleu van Longhum.
  3. Kwah LK, Diong J (2014) National Institutes of Health Stroke Scale (NIHSS). J Physiother 60: 61.
  4. Vogt G, Laage R, Shuaib A, Schneider A (2012) Initial lesion volume is an independent predictor of clinical stroke outcome at day 90. Virtual International Stroke Trials Archive (VISTA) 43: 1266-1272.
  5. Hankey GJ, Spiesser J, Hakimi Z, Bego G, Carita P, et al. (2007) Rate, degree, and predictors of recovery from disability. Ischemic Stroke Neurology 68: 1583-1587.
  6. Andersen KK, Olsen TS, Dehlendorff C, Kammersgaard LP (2009) Hemorrhagic and ischemic strokes compared: Stroke severity, mortality, and risk factors. Stroke 40: 2068-2072.
  7. Sulter G, Steen C, De Keyser J (1999) Use of the Barthel index and modified Rankin scale in acute stroke trials. Stroke 30: 1538-1541.
  8. Ojagbemi A, Owolabi M (2013) Predictors of functional dependency after stroke in Nigeria. J Stroke Cerebrovasc Dis 22: e381-387.
  9. Reid JM, Dai D, Christian C, Reidy Y, Counsell C, et al. (2012) Developing predictive models of excellent and devastating outcome after stroke. Age Ageing 41: 560-564.
  10. Swarowska M, Ferens A, Pera J, Slowik A, Dziedzic T (2016). Can Prediction of Functional Outcome after Stroke Be Improved by Adding Fibrinogen to Prognostic Model. J Stroke Cerebrovasc Dis 25: 2752-2755.
  11. Rothstein L, Jickling GC (2013) Ischemic stroke biomarkers in blood. Biomark Med 7: 37-47.
  12. Simats A, García BT, Montaner J (2016) Neuroinflammatory biomarkers: From stroke diagnosis and prognosis to therapy. Biochim Biophys Acta 1862: 411-424.
  13. Wan X, Wang W, Liu J, Tong T (2014) Estimating the sample mean and standard deviation from the sample size, median, range and/or interquartile range. BMC Med Res Methodol 14: 135.
  14. Higgins J, Green S (2011) Cochrane Handbook for Systematic Reviews of Interventions: Version 5.1.0. (5thedn). The Cochrane Collaboration.
  15. Park SY, Kim J, Kim OJ, Kim JK, Song J, et al. (2013) Predictive value of circulating interleukin-6 and heart-type fatty acid binding protein for three months clinical outcome in acute cerebral infarction: multiple blood markers profiling study. Crit Care 17: 45.
  16. Zeng L, Liu J, Wang Y, Wang L, Weng S, et al. (2013) Cocktail blood biomarkers: prediction of clinical outcomes in patients with acute ischemic stroke. Eur Neurol 69: 68-75.
  17. Chang LT, Yuen CM, Liou CW, Lu CH, Chang WN, et al. (2010) Link between interleukin-10 level and outcome after ischemic stroke. Neuro Immuno Modulation 17: 223-228.
  18. Laborde CM, Mourino AL, Akerstrom F, Padial LR, Vivanco F, et al. (2012) Potential blood biomarkers for stroke. Expert Rev Proteomics 9: 437-449.
  19. Kwon HM, Lee YS, Bae HJ, Kang DW (2014) Homocysteine as a predictor of early neurological deterioration in acute ischemic stroke. Stroke 45: 871-873.
  20. Campos F, Rodríguez YM, Castellanos M, Arias S, Pérez MM, et al. (2011) Blood levels of glutamate oxaloacetate transaminase are more strongly associated with good outcome in acute ischaemic stroke than glutamate pyruvate transaminase levels. Clin Sci (Lond) 121: 11-17.
  21. Dong X, Tao DB, Wang YX, Cao H, Xu YS, et al. (2013) Plasma copeptin levels in Chinese patients with acute ischemic stroke: a preliminary study. Neurol Sci 34: 1591-1595.
  22. Qi A, Li Y, Liu Q, Si JZ, Tang XM, et al. (2015) Thioredoxin is a novel diagnostic and prognostic marker in patients with ischemic stroke. Radic Biol Med 80: 129-135.
  23. Carbone F, Satta N, Montecucco F (2016) Anti-ApoA-1 IgG serum levels predict worse poststroke outcomes. Eur J Clin Invest 46: 805-817.
  24. Zhang B, Gao C, Yang N, Zhang W, Song X, et al. (2010) Is elevated SUA associated with a worse outcome in young Chinese patients with acute cerebral ischemic stroke. BMC Neurol 10: 82.
  25. Zhou J, Wu J, Zhang J, Xu T, Zhang H, et al. (2015) Association of stroke clinical outcomes with coexistence of hyperglycemia and biomarkers of inflammation. J Stroke Cerebrovasc Dis 24: 1250-1255.
  26. Tsai TH, Chen YL, Lin HS, Liu CF, Chang HW, et al. (2012) Link between lipoprotein-associated phospholipase A2 gene expression of peripheral-blood mononuclear cells and prognostic outcome after acute ischemic stroke. J Atheroscler Thromb 19: 523-531.
  27. Hasan N, McColgan P, Bentley P, Edwards RJ, Sharma P (2012) Towards the identification of blood biomarkers for acute stroke in humans: a comprehensive systematic review. Br J Clin Pharmacol 74: 230-240.
  28. Masrur S, Cox M, Bhatt DL, Smith EE, Ellrodt G, et al. (2015) Association of Acute and Chronic Hyperglycemia With Acute Ischemic Stroke Outcomes Post-Thrombolysis: Findings From Get With The Guidelines-Stroke. J Am Heart Assoc 4: e002193.
  29. Morigi M, Angioletti S, Imberti B, Donadelli R, Micheletti G, et al. (1998). Leukocyte-endothelial interaction is augmented by high glucose concentrations and hyperglycemia in a NF-kB-dependent fashion. J Clin Invest 101: 1905-1915.
  30. Baumgartner PSM, Wagner L, Pettermann M, Grillari J, Gessl A, et al. (1995) High-glucose-triggered apoptosis in cultured endothelial cells. Diabetes 44: 1323-1327.
  31. Tu WJ, Dong X, Zhao SJ, Yang DG, Chen H (2013) Prognostic value of plasma neuroendocrine biomarkers in patients with acute ischaemic stroke. J Neuroendocrinol 25: 771-778.
  32. Teichberg VI, Cohen KMK, Cooper I, Zlotnik A (2009) Homeostasis of glutamate in brain fluids: an accelerated brain-to-blood efflux of excess glutamate is produced by blood glutamate scavenging and offers protection from neuropathologies. Neuroscience 158: 301-308.
  33. Boyko M, Zlotnik A, Gruenbaum BF, Gruenbaum SE, Ohayon S, et al. (2011) Pyruvate’s blood glutamate scavenging activity contributes to the spectrum of its neuroprotective mechanisms in a rat model of stroke. Eur J Neurosci 34: 1432-1441.
  34. Boyko M, Stepensky D, Gruenbaum BF, Gruenbaum SE, Melamed I, et al. (2012) Pharmacokinetics of glutamate-oxaloacetate transaminase and glutamate-pyruvate transaminase and their blood glutamate-lowering activity in naive rats. Neurochem Res 37: 2198-2205.
  35. Wang J, Ning R, Wang Y (2016) Plasma D-dimer Level, the Promising Prognostic Biomarker for the Acute Cerebral Infarction Patients. J Stroke Cerebrovasc Dis 25: 2011-2015.
  36. Matsumoto M, Sakaguchi M, Okazaki S, Furukado S, Tagaya M, et al. (2013) Relationship between plasma (D)-dimer level and cerebral infarction volume in patients with nonvalvular atrial fibrillation. Cerebrovasc Dis 35: 64-72.
  37. Yuan W, Shi ZH (2014) The relationship between plasma D-dimer levels and outcome of Chinese acute ischemic stroke patients in different stroke subtypes. J Neural Transm 121: 409-413.
  38. Bunevicius A, Kazlauskas H, Raskauskiene N, Janusonis V, Bunevicius R (2014) Ischemic stroke functional outcomes are independently associated with C-reactive protein concentrations and cognitive outcomes with triiodothyronine concentrations. A pilot study Endocrine 45: 213-220.
  39. Suda S, Muraga K, Kanamaru T, Okubo S, Abe A, et al. (2016) Low free triiodothyronine predicts poor functional outcome after acute ischemic stroke. J Neurol Sci 368: 89-93.
  40. Ambrosius W, Kazmierski R, Gupta V, Warot AW, Adamczewska KD, et al. (2011) Low free triiodothyronine levels are related to poor prognosis in acute ischemic stroke. Exp Clin Endocrinol Diabetes 119: 139-143.
  41. Liu J, Wang D, Xiong Y, Yuan R, Tao W, et al. (2016) Low free triiodothyronine levels are related to symptomatic intracranial hemorrhage and poor functional outcomes after intravenous thrombolysis in acute ischemic stroke patients. Neurol Res 38: 429-433.
  42. Ma L, Zhu D, Jiang Y, Liu Y, Ma X, et al. (2016) Low triiodothyronine: A new facet of inflammation in acute ischemic stroke. Clin Chim Acta 458: 63-67.
  43. Neidert S, Katan M, Schuetz P, Fluri F, Ernst A, et al. (2011) Anterior pituitary axis hormones and outcome in acute ischaemic stroke. J Intern Med 269: 420-432.
  44. Zi WJ, Shuai J (2013) Cortisol as a prognostic marker of short-term outcome in chinese patients with acute ischemic stroke. PLoS One 8: e72758.
  45. Katan M, Elkind MS (2011) Inflammatory and neuroendocrine biomarkers of prognosis after ischemic stroke. Expert Rev Neurother 11: 225-239.
  46. Bustamante A, Garcia BT, Llombart V, Simats A, Giralt D, et al. (2014) Neuroendocrine hormones as prognostic biomarkers in the setting of acute stroke: overcoming the major hurdles. Expert Rev Neurother 14: 1391-1403.
  47. Barugh AJ, Gray P, Shenkin SD, MacLullich AM, Mead GE (2014) Cortisol levels and the severity and outcomes of acute stroke: a systematic review. J Neurol 261: 533-545.
  48. Katan M, Fluri F, Schuetz P, Morgenthaler NG, Zweifel C, et al. (2010) Midregional pro-atrial natriuretic peptide and outcome in patients with acute ischemic stroke. J Am Coll Cardiol 56: 1045-1053.
  49. Fischer M, Katan M, Morgenthaler NG, Seiler M, Müller B, et al. (2014). The prognostic value of midregional proatrial natriuretic peptide in patients with hemorrhagic stroke Cerebrovasc Dis 37: 128-133.
  50. Berntsson J, Zia E, Borné Y, Melander O, Hedblad B, et al. (2014) Plasma natriuretic peptides and incidence of subtypes of ischemic stroke. Cerebrovasc Dis 37: 444-450.
  51. Sonderer J, Katan KM (2015) Aetiological blood biomarkers of ischaemic stroke. Swiss Med Wkly 145: 14138.
  52. Abubakar S, Okubadejo N, Ojo O, Oladipo O, Ojini F, et al. (2013) Relationship between admission serum C-reactive protein and short term outcome following acute ischaemic stroke at a tertiary health institution in Nigeria. Niger J Clin Pract 16: 320-324.
  53. Gröschel K, Schnaudigel S, Edelmann F, Niehaus CF, Weber KM, et al. (2012) Growth-differentiation factor-15 and functional outcome after acute ischemic stroke. J Neurol 259: 1574-1579.
  54. Worthmann H, Kempf T, Widera C, Tryc AB, Goldbecker A, et al. (2011). Growth differentiation factor 15 plasma levels and outcome after ischemic stroke. Cerebrovasc Dis 32:72-78.
  55. Brouns R, Wauters A, De Surgeloose D, Mariën P, De Deyn PP (2011) Biochemical markers for blood-brain barrier dysfunction in acute ischemic stroke correlate with evolution and outcome. Eur Neurol 65: 23-31.
  56. Mendioroz M, Fernández CI, Rosell A, Delgado P, Domingues MS, et al. (2011). Osteopontin predicts long-term functional outcome among ischemic stroke patients. J Neurol. 258: 486-493.
  57. Deng WJ, Shen RL, Li M, Teng JF (2015) Relationship between procalcitonin serum levels and functional outcome in stroke patients. Cell Mol Neurobiol 35: 355-361.
  58. Huang JM, Hu J, Chen N, Hu ML (2013) Relationship between plasma high-mobility group box-1 levels and clinical outcomes of ischemic stroke. J Crit Care 28: 792-797.
  59. Bonifacic D, Toplak A, Benjak I, Tokmadzic VS, Lekic A, et al. (2016) Monocytes and monocyte chemoattractant protein 1 (MCP-1) as early predictors of disease outcome in patients with cerebral ischemic stroke. Wien Klin Wochenschr 128: 20-27.
  60. Carbone F, Vuilleumier N, Burger F, Roversi G, Tamborino C, et al. (2015). Serum osteopontin levels are upregulated and predict disability after an ischaemic stroke. Eur J Clin Invest 45: 579-586.
  61. Feng P, Niu X, Hu J, Zhou M, Liang H, et al. (2013) Relationship of serum magnesium concentration to risk of short-term outcome of acute ischemic stroke. Blood Press 22: 297-301.
  62. Chiquete E, Ruiz SJL, Murillo BLM, Arauz A, Orozco VDR, et al. (2013). Serum uric acid and outcome after acute ischemic stroke: Premier study. Cerebrovasc Dis 35: 168-174.
  63. Marousi SG, Theodorou GL, Karakantza M, Zampakis P, Papathanasopoulos P, et al. (2010) Acute post-stroke adiponectin in relation to stroke severity, progression and 6 month functional outcome. Neurol Res 32: 841-844.
  64. Arsalan IM, Khattak MB, Khan F, Anwar MJ (2011) Prognostic significance of serum bilirubin in stroke. J Ayub Med Coll Abbottabad 23: 104-107.
  65. Brouns R, Heylen E, Willemse JL, Sheorajpanday R, De Surgeloose D, et al. (2010) The decrease in procarboxypeptidase U (TAFI) concentration in acute ischemic stroke correlates with stroke severity, evolution and outcome. J Thromb Haemost 8: 75-80.
  66. Zweifel C, Katan M, Schuetz P, Ernst A, Mariani L, et al. (2011) Growth hormone and outcome in patients with intracerebral hemorrhage: a pilot study. Biomarkers 16: 511-516.
  67. Tang JH, Ma LL, Yu TX, Zheng J, Zhang HJ, et al. (2014) Insulin-like growth factor-1 as a prognostic marker in patients with acute ischemic stroke. PLoS One 9: e99186.
  68. Wang HC, Lin WC, Yang TM, Lin YJ, Tsai NW, et al. (2011). The association between symptomatic delayed cerebral infarction and serum adhesion molecules in aneurysmal subarachnoid haemorrhage. Neurosurgery 68: 1611-1617.
  69. Urwyler SA, Schuetz P, Fluri F, Morgenthaler NG, Zweifel C, et al. (2010) Prognostic value of copeptin: one-year outcome in patients with acute stroke. Stroke 41: 1564-1567.
  70. Azarpazhooh MR, Mobarra N, Parizadeh SMR, Tavallaie S, Bagheri M, et al. (2010). Serum High-Sensitivity C-Reactive Protein and Heat Shock Protein 27 Antibody Titers in Patients With Stroke and 6-Month Prognosis. Angiology 61: 607-612.
  71. Rainer TH, Leung LY, Chan CPY, Leung YK, Abrigo JM, et al. (2016) Plasma miR-124-3p and miR-16 concentrations as prognostic markers in acute stroke. Clin Biochem 49: 663-668.
  72. Xie S, Lu L, Liu L, Bi G, Zheng L (2016) Progranulin and short-term outcome in patients with acute ischaemic stroke. Eur J Neurol 23: 648-655.
  73. Navarro SM, Rosell A, Hernández GM, Penalba A, Boada C, et al. (2011). A large screening of angiogenesis biomarkers and their association with neurological outcome after ischemic stroke. Atherosclerosis 216: 205-211.
Citation: De Waele S, Hachimi-Idrissi S (2017) The Link between Early Biomarker Analysis and the Neurological Outcome in Stroke Patients. Cardiovasc Pharm Open Access 6: 219.

Copyright: © 2017 De Waele S, et al. This is an open-access article distributed under the terms of the Creative Commons Attribution License, which permits unrestricted use, distribution, and reproduction in any medium, provided the original author and source are credited.
bellicon