Indexed In
- Open J Gate
- Genamics JournalSeek
- Academic Keys
- ResearchBible
- Cosmos IF
- Access to Global Online Research in Agriculture (AGORA)
- Electronic Journals Library
- RefSeek
- Directory of Research Journal Indexing (DRJI)
- Hamdard University
- EBSCO A-Z
- OCLC- WorldCat
- Scholarsteer
- SWB online catalog
- Virtual Library of Biology (vifabio)
- Publons
- Geneva Foundation for Medical Education and Research
- Euro Pub
- Google Scholar
Useful Links
Share This Page
Journal Flyer

Open Access Journals
- Agri and Aquaculture
- Biochemistry
- Bioinformatics & Systems Biology
- Business & Management
- Chemistry
- Clinical Sciences
- Engineering
- Food & Nutrition
- General Science
- Genetics & Molecular Biology
- Immunology & Microbiology
- Medical Sciences
- Neuroscience & Psychology
- Nursing & Health Care
- Pharmaceutical Sciences
Research Article - (2021) Volume 10, Issue 3
The Andean Red Common Bean (Phaseolus vulgaris L.) Genotypes Yield Stability Study in Southern and Central Rift Valley of Ethiopia
Demelash Bassa1*, Hussein Mohammed2, Fekadu Gurmu3 and Berhanu Amsalu42School of Plant and Horticultural Science, College of Agriculture, Hawassa University, Hawassa, Ethiopia
3Hawassa Agricultural Research Center, Hawassa, Ethiopia
4Ethiopian Institute of Agricultural Research, Dessie, Ethiopia
Received: 01-Feb-2021 Published: 22-Feb-2021, DOI: 10.35248/2168-9881.21.10.345
Abstract
The presence of significant genotype x environment interaction (GEI) has effect on the stability of genotypes across environments. Sixteen Andean red common bean genotypes were evaluated at six sites using triple lattice design in 2017 cropping season. The objective of the study was to evaluate seed yield stability of the genotypes using Additive Main Effects and Multiplicative Interaction (AMMI) and Genotype plus Genotype by Environment (GGE) bi-plot analyses. The AMMI ANOVA showed that the magnitude of G, E and GEI was 3.8%, 80.9% and 11.1% respectively of the total variation. The genotypes Red kidney, Melkadima and DAB 478 were identified as stable genotypes using AMMI bi-plot analysis. Based on GGE bi plot analysis, genotypes DAB 544, Red kidney, DAB 478, DAB 532 and DAB 481 were adapted to all environments. Three mega-environments were identified using GGE bi-plot analysis; namely high potential and discriminating environments (Melkassa), medium potential environments (Arsi Negele and Alem Tena) and low potential and undiscriminating environments (Areka, Gofa and Kokate). Therefore, Genotypes Red kidney and DAB 478 were the most stable according to the two stability analysis models and can be recommended for production in southern region and central Rift valley areas of Ethiopia.
Keywords
AMMI; Common bean; GGE bi-plot; GEI; Genotypes; Yield
Introduction
Common bean with 2n=22 diploid chromosome number belongs to genus Phaseolus, species vulgaris,family Fabaceae. It is the most important food legume contributing50% for human consumption of the total production [1] in the world. In Africa, common bean is grown mainly for subsistence and it is a main source of dietary protein in Kenya, Tanzania, Malawi, Uganda and Zambia. In Ethiopia, the production obtained from red and white types of common beans was 14.3% (380,499.453 tons) and 6% (159,739.484 tons), of the pulse production respectively. Thus, the total area allotted for common bean production was 357, 299.89ha in Ethiopia and the yield obtained was 540,238.94 tons [2].
The main challenge for the production of common bean in Ethiopia is believed to be shortage of high yielding and stable varieties. Genotype x environment interaction (GEI) is present when the expression of any trait of genotypes is inconsistent over environments. When a significant GEI is present, researchers are interested to know the cause of the interaction in order to make accurate predictions of genotype performance under a variety of environments [3]. The current research is aimed to estimate the interaction and performance of genotypes across environments using the multivariate methods; i.e., Additive Main Effects and Multiplicative Interaction (AMMI) and Genotype plus Genotype by Environment (GGE) bi-plot analysis.
In AMMI analysis, genotype (G) and environment (E) are considered as additive main effects and the GEI as a multiplicative component and is interpreted by principal component analysis (PCA) [4]. AMMI bi-plot is identified as GEI bi-plot which combines the yield stability parameters [5]. The use of AMMI is effective to evaluate multi-environment trial with the data collected from two to five times more replications [6].
For multi-environment trials, which are not possible with the use of AMMI model, GGE bi-plot analysis is used to evaluate the environments [7]. GGE bi-plot graphically displays a GEI in a two way table [8]. It is an effective method for 1) mega-environment analysis (e.g. “which-won-where” pattern), whereby genotypes can also be recommended to specific environments [7,8], 2) genotype evaluation (the mean performance and stability of genotypes) and 3) environmental evaluation (the discriminating power of genotypes in target environments). GGE bi plot is able to identify which genotypes perform best in a given environment and also which genotype shows the highest stability across the test environments [9].
Genotype by environment interaction (GEI) is an important issue in crop breeding. When the expression of any trait of genotypes is inconsistent over environments, GEI is present. The cause of GEI needs to be known when a significant GEI is present in order to make accurate prediction of genotypes under a variety of environments. According to [10], the major objective of plant breeding is to select genotypes that are consistently high yielding (stable) over a range of environments, regardless of environment and/or season. However, GEI causes selection to be inefficient because the selected genotypes may fail to repeat their relative performance in different environments. Therefore, the relative magnitude of G, E, GEI and use of AMMI and GGE bi-plot stability analyses in the Andean red common bean genotypes have not been yet studied in common-bean-growing areas of southern and central rift valley of Ethiopia with the objective of analyzing seed yield stability using these models.
Materials and Methods
Study sites and materials used
The experiment was conducted during 2017 main cropping season at six environments (Alem Tena, Areka, Arsi Negele, Gofa, Kokate and Melkassa ) (Table 1) representing areas of Southern and Central Rift valleys of Ethiopia where common bean is widely growing. Sixteen Andean red common bean genotypes (14 advanced lines under NVT and 2 released varieties) were used for the study (Table 2). The seeds of all the genotypes were obtained from, Melkassa Agricultural Research Centre, Ethiopian Institute of Agricultural Research.
| No. | Treatment name | Status |
|---|---|---|
| 1 | DAB 317 | Under NVT |
| 2 | DAB 496 | Under NVT |
| 3 | DAB 513 | Under NVT |
| 4 | DAB 481 | Under NVT |
| 5 | DAB 540 | Under NVT |
| 6 | DAB 512 | Under NVT |
| 7 | DAB 525 | Under NVT |
| 8 | DAB 478 | Under NVT |
| 9 | DAB 482 | Under NVT |
| 10 | DAB 523 | Under NVT |
| 11 | DAB 497 | Under NVT |
| 12 | DAB 532 | Under NVT |
| 13 | DAB 544 | Under NVT |
| 14 | DAB 545 | Under NVT |
| 15 | Melkadima (Ch.) | Released (2006) |
| 16 | Red kidney (Ch.) | Released (2007) |
Table 1: Description of 16 common bean genotypes used for the study.
| Source of | Degree of | ||
|---|---|---|---|
| variation | Freedom | Sum of Squares | Mean Square |
| Environment (E) | 5 | 246.07 | 49.21** |
| Genotypes (G) | 15 | 11.76 | 0.78** |
| Block | 12 | 2.17 | 0.18* |
| GxE | 75 | 36.82 | 0.49** |
| Error | 180 | 23.17 | 0.13 |
| Total | 287 | 319.99 | |
Table 2: Combined ANOVA for seed yield (ton ha-1) of 16 common bean genotypes.
Experimental design and cultural practices
The triple lattice design was used to lay the experiment at six environments. The experimental plot length and width was 2.4 m and 4 m respectively. The gross plot size and the net plot size were 9.6 and 6.4 m2 respectively. The spacing between plots, blocks, replications, rows and seeds was 0.5 m, 1 m, 1.5 m, 40 cm and 10 cm respectively. The seed and fertilizer rate of 100 kg ha-1 and 122 kg ha-1 NPSB (18.9N-37.7P2O5-6.95S-0.1B) were used, respectively.
Data Collection and Analysis
Data collection
Seed yield and related traits were collected in the experiment. For seed yield data, four central rows were harvested from each plot and seeds obtained from them were weighed to get the seed yield in gram plot-1 and adjusted to standard moisture level (12.5 %) and finally converted into t ha-1.
Data analysis
Analysis of variance: A combined analysis of data was examined using SAS version 9.4 [11] and Gen Stat 17th version [12] statistical software. ANOVA was estimated for seed yield of individual site and combined analysis was conducted after testing error variances homogeneity over environments [4].
Stability analysis: Analysis of stability was estimated using multivariate models such as AMMI [9] and GGE bi plot [13]. The AMMI Model is given by the following formula:
Y_ger = μ +g^2 di+e^2 di+Σnλn γgnδen+ ρge+εger
Where Yger is the yield of genotype (g) in environment (e ) for replicate (r), μ is the grand mean, g^2 di is the genotype g()mean deviation (genotype mean minus grand mean), e^2 di is the environment (e) mean deviation, λn is the singular value for IPCA axis n,γgn is the genotype g value for IPCA axis n, δen isthe environment e eigenvector value for IPCA axis n, ρge is residual, and εger is the error [14]. The degrees of freedom (DF) for IPCA are given by the following formulae. DF = G + E – 1 - 2n, where G=the number of genotype, E=the number of environments n = the nth axis of IPCA.
GGE bi-plot is suggested by [15] as indicated below.
Y_(ij )- μ _j= h_(1 ) α_i1 γ_j1+h_2 α_i2 γ_j2+ε_ij
Where: Y_(ij )= mean of genotype i in environment j, μ _j = mean value of environment j, h_(1 )= the singular value of PCA1 and h_2 = the singular value of PCA2, α_i1= PCA1 score for genotype i and α_i2= PCA2 score for genotype i, γ_j1= PCA1 score for environment j and γ_j2= PCA2 score for environment j, ε_ij = error of the model related with genotype i in environment j. The stability parameters were analyzed using stability SAS syntax [15], and Gen stat version 17th software.
Results and Discussion
ANOVA for combined environments
In the analysis of individual location, significant differences (p<0.01) were observed among the genotypes in seed yield in all six environments and there was also a highly significant difference among the genotypes (p<0.01) for combined analysis. Theexistence of significant GEI in legume crops in previous studies was reported by various authors, such as common bean [14,16,17], chickpea [18], soybean [8] and pigeon pea [16].
Andean red common bean genotypes mean performance
The combined mean seed yield analysis revealed that the maximum and minimum yields for each environment obtained were 2.0 to 3.7, 1.0 to 1.6, 2.3 to 4.0, 1.0 to 2.0, 1.0 to 1.7 and 2.0 to 4.0 t ha-1 in Alem Tena, Areka, Arsi Negele, Gofa, Kokate and Melkassa respectively and with their respective environment mean yield of 2.7, 1.2, 3.3, 1.3, 1.2 and 3.2 t ha-1. Arsi Negele, Melkassa and Alem Tena were the best environments for Andean red common bean genotypes with the mean seed yield of 3.3, 3.2 and 2.7 t ha- 1respectively. In the southern environments (Areka, Gofa and Kokate) performance was relatively poor with the mean seed yield of 1.2, 1.3 and 1.2 t ha-1, respectively; even though in these environments yield was fair as compared to the national average of common bean. However, the stability of genotypes across environments has to be evaluated by stability analysis using multivariate methods such as AMMI and GGE bi-plots.
Stability analysis
Additive Main Effects and Multiplicative Interaction (AMMI), The contribution of the total variation of sum of squares accounted for 80.9%, 11.0% and 3.8% for location, genotype and interaction effects respectively. The high percentage of the environment main effects is an indication that environment was the major factor that influenced yield performance of Andean red common bean genotypes. Identifying the contribution of G, E and GEI effect from the variation of total sum of squares using AMMI was reported by different authors in stability studies of different crops at different environments, for example, common bean [7], field pea [19] and chickpea [12].
NB. - IPCA1, IPCA2, IPCA3, IPCA4 and IPCA5 are Interaction Principal Component Axes 1, 2, 3, 4 and 5 respectively.
AMMI-2 bi-plot results explained the multiplicative effects of the genotype by environment contained in the first two IPCAs (IPCA1 and IPCA2). The bi-plot showed site F (Melkassa) was the most discriminating and interactive environment for the genotypes as showed by the longest distance between the origin and the point of its end and gave information on the performance of genotypes even though its high IPCA score may not exactly show the average performance and variability of genotypes across the environmtents. The genotypes approximately near to the bi-plot origin, viz. p (Red kidney), h (DAB 478) and o (Melkadima) contributed least to the GEI and hence they were stable. Those genotypes relatively far apart from the AMMI-2 biplot such as k (DAB 497), c (DAB 513), f (DAB 512), g (DAB 525), e (DAB 540) and i (DAB 482) contributed most to the interaction and hence they were unstable. The identification of stable/unstable genotypes and discriminating/ non-discriminating environments was reported on common bean [1, 20], chickpea [12] and field pea [21].
NB. Genotypes: a = DAB 317, b = DAB 496, c = DAB 513, d = DAB 481, e = DAB 540, f = DAB 512, g = DAB 525, h = DAB 478, i = DAB 482, j = DAB 523, k = DAB 497, l = DAB 532, m = DAB 544, n = DAB 545, o = Melkadima (Ch.) and p = Red kidney (Ch.), Environments: A = Alem Tena, B = Areka, C = Arsi Negele, D = Gofa, E = Kokate and F = Melkassa
Genotype plus genotype by environment interaction (GGE) bi-plot Analysis: The GGE bi-plot graph of 14 advanced lines and two released varieties tested at six environments is presented in (Figure 1). The GGE bi-plot helps to identify which genotype performs best in which location. Accordingly, genotypes such as i (DAB 482), n (DAB 545), h (DAB 478), o (Melkadima), p (Red kidney) and j (DAB 523) performed best at Alem Tena and Arsi Negele environments whereas genotypes d (DAB 481), l (DAB 532), m (DAB 544) and p (Red kidney) performed best at Areka, Gofa and Kokate environments. However, genotypes that adapted to all test environments were m (DAB 544), p (Red kidney), h (DAB 478), l (DAB 532) and d (DAB 481). In addition, genotypes g (DAB 525), e (DAB 540), f (DAB 512) and a (DAB 317) can be produced at Melkassa location. According to GGE bi-plot analysis, F (Melkassa) was the highly performing environment for the selection of the genotypes whereas the environments such as A (Alem tena) and C (Arsi negele) were moderately performing. The low performing and stable environments relatively were B (Areka), E (Kokate) and D (Gofa). The genotypes that adapted to all test environments were m (DAB 544), p (Red kidney), h (DAB 478), l (DAB 532) and d (DAB 481) based on GGE bi plot analysis [19]. Previous authors have shown the performance of genotypes on different environments with GGE biplot, for example, [22-26,16].
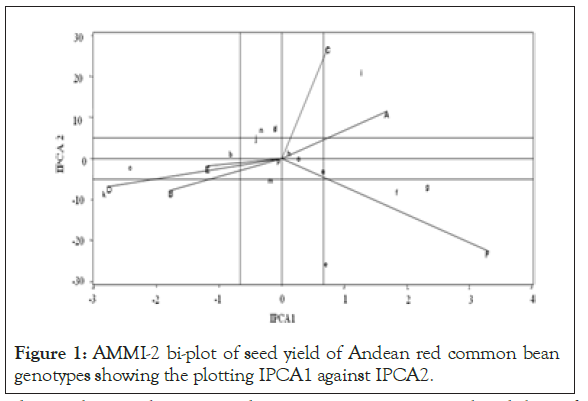
Figure 1: AMMI-2 bi-plot of seed yield of Andean red common bean genotypes showing the plotting IPCA1 against IPCA2.
The Andean red common bean genotypes score and stability of genotypes across environments is displayed in. Based on this, genotypes which had an absolute shorter projection, G4 (DAB 481), G8 (DAB 478), G13 (DAB 544), G15 (Melkadima) and G16 (Red kidney) were stable across all environments (Figure 2).
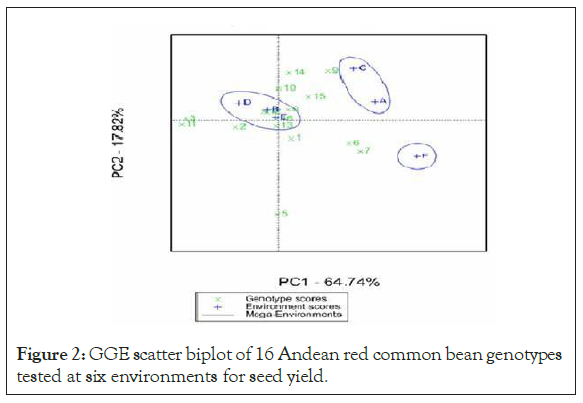
Figure 2: GGE scatter biplot of 16 Andean red common bean genotypes tested at six environments for seed yield.
NB. Genotypes: 1 = DAB 317, 2 = DAB 496, 3 = DAB 513, 4 = DAB 481, 5 = DAB 540, 6 = DAB 512, 7 = DAB 525, 8 = DAB 478, 9 = DAB 482, 10 = DAB 523, 11 = DAB 497, 12 = DAB 532, 13 = DAB 544, 14 = DAB 545, 15 = Melkadima (Ch.) and 16 = Red kidney (Ch.), Environments: A = Alem Tena, B = Areka, C = Arsi Negele, D = Gofa, E = Kokate and F = Melkassa
Conclusion
The Andean red common bean genotypes Red kidney and DAB 478 were selected as the stable genotypes which showed higher seed yield based on AMMI and GGE bi-plot analyses. Therefore, these genotypes can be recommended for southern regions and central Rift valley of Ethiopia.
Melkassa was identified as the most discriminating environment followed by Arsi Negele and Alem Tena. The southern environments, Gofa, Areka and Kokate, were non-discriminating but showed fairly acceptable yield as compared to the national average of common bean.
Acknowledgement
The southern Agricultural Research Institute, Areka Research Center, and Ethiopian Institute of Agricultural Research, Melkassa Research Center, deserve gratitude for funding the study and providing study materials.
REFERENCES
- Abel MF. Genotype by Environment Interaction on yield and micronutrient concentration bio fortified common bean (Phaseolus Vulgaris L.) in Ethiopia. MSc Thesis. 2017.
- Alemayehu D, Birru A, Zerihun A, Dagnachew L. Genotype by environment interaction and kernel yield stability of ground nut (Arachis hypogeae L.) in western Oromia, Ethiopia. Journal of Agriculture and Crops, 2016; 113-120.
- Amira JO, Ojo DK, Ariyo OJ, Oduwaye OA, Ayo-Vaughan. Relative Discriminating Powers of GGE and AMMI models in the selection of tropical soybean. International journal of plant breeding and genetics. 2013.
- Bartlett MS. Properties of sufficiency and statistical tests. Proc R Soc A. 1937; 160:268-282.
- Becker HC, Leon J. Stability analysis in plant breeding. Plant breeding. 1998: 101: 1-23.
- Central Statistics Authority of Ethiopia (CSA). Report on area and crop production of major crops for Meher season. 2016; 1.
- Chataika BYE, Bokosi JM, Kwapata MB, Chirwa RM, Mwale VM, Mnyenyembe P et al. Performance of parental genotypes and inheritance of Angular leaf spot (Phaeosariopsis griseola) resistance in common bean. Africa Jour. Horti sci. 9:4398-4406.
- Fekadu GB. Genotype by environment interaction and stability analysis for yield and yield attributes of soya bean. 2008.
- Gauche HG Jr, Zobel RW. Predictive and postdictive success of statistical analyses of yield trials. Theoretical and Applied Genetics. 1998; 76:1-10.
- Hussein MA, Bjornstad A, Aastveit AH. Sasg x Estab A SAS program for computing genotype x environment stability statistics. Agronomy Jour. Madison. 2000; 9:454-459.
- Knight R. The measurement and interpretation of genotype x environment interactions. Euphytica. 1970; 19:225-235.
- Legesse H, Hussein M, Walelign W, Bunyamin T. Genotype x Environment Interaction and Stability of chickpea (Cicer arientinum (L)). Genotypes in Southern Ethiopia. 2015.
- McClean P, Kami J, Gepts P. Genomics and Genetic diversity in common bean. Legume crop Genomics. AOCS press. Champaign. 2014; 60-82.
- Nigussie K. Genotype x Environment Interaction of Released Common Bean (Phaseolus vulgaris L.) Genotypes, In Eastern Amhara Region, Ethiopia. Thesis. 2012.
- Payne RW, Murray DA, Harding SA, Baird DB, Soutar DM. Gen Stat for windows introduction, 17th ed. Hemel Hempstead, UK: VSN International. 2012.
- Samuel MK. Utilization of Multi-Environment al Pigeon pea Performance Data for Determination of Stability Parameters. Thesis. 2013.
- SAS Institute. Statistical Analysis Software user’s guide. SAS Institute. 2017.
- Teame G, Ephrem S and Getachew B. Performance evaluation of common bean (Phaseolus vulgaris L.) genotypes in Raya Valley, Northern Ethiopia. African Jou Plant Sci. 2017; 11:1-5.
- Yan W, Hunt LA, Sheng Q, Szlavnics Z. Cultivar evaluation and mega- environment investigation based on the GGE biplot. Crop Science. 2000; 40:597-605.
- Yan W, Kang MS. GGE biplot analysis. A graphical tool for breeders, In M.S. Kang, ed. Geneticists, and Agronomist. CRC Press. 2003.
- Yan W, Kang MS, Woods BMS, Cornelius PL. GGE biplot vs. AMMI analysis of genotype by environment data. Crop Sci. 2007; 47. 643– 655.
- Yasin G, Demelash B, Genene G, Mekasha Ch. Farmers Participatory Evaluation of Chickpea Varieties in Mirab Badwacho and Damot Fullasa Districts of Southern Ethiopia. Hydrology Current Res. 2017 8:264.
- Yasin G. Genotype x Environment interaction and stability analysis for yield and yield attributes of Field pea (Pisum Sativum).Thesis. 2007.
- Yeyis R, Agidew B, Yasin G. GGE and AMMI Biplot Analysis for Field Pea Yield Stability in SNNPR State, Ethiopia. Inter Jour Sustainable Agricultur Res, 2017; 1:28-38.
- Zeleke A, Berhanu A, Kidane T, Kassaye N, Asnake F. Seed Yield Stability and Genotype x Environment Interaction of Common Bean (Phaseolus vulgaris L.) Lines in Ethiopia. Intern Jou. Plant Breed. Crop Science. 2016; 3: 135-144.
- Zobel RW, Wright MJ, Gauch HG Jr. Statistical analysis of a yield trial. Agronomy Journal. 1998; 80:388-393.
Citation: Bassa D, Mohammed H, Gurmu F, Amsalu B (2021) The Andean Red Common Bean (Phaseolus vulgaris L.) Genotypes Yield Stability Study in Southern and Central Rift Valley of Ethiopia. Agrotechnology. 10: 345.
Copyright: © 2021 Bassa D, et al. This is an open-access article distributed under the terms of the Creative Commons Attribution License, which permits unrestricted use, distribution, and reproduction in any medium, provided the original author and source are credited.
