

Indexed In
- Open J Gate
- Genamics JournalSeek
- Academic Keys
- ResearchBible
- Cosmos IF
- Access to Global Online Research in Agriculture (AGORA)
- Electronic Journals Library
- RefSeek
- Directory of Research Journal Indexing (DRJI)
- Hamdard University
- EBSCO A-Z
- OCLC- WorldCat
- Scholarsteer
- SWB online catalog
- Virtual Library of Biology (vifabio)
- Publons
- Geneva Foundation for Medical Education and Research
- Euro Pub
- Google Scholar
Useful Links
Share This Page
Journal Flyer

Open Access Journals
- Agri and Aquaculture
- Biochemistry
- Bioinformatics & Systems Biology
- Business & Management
- Chemistry
- Clinical Sciences
- Engineering
- Food & Nutrition
- General Science
- Genetics & Molecular Biology
- Immunology & Microbiology
- Medical Sciences
- Neuroscience & Psychology
- Nursing & Health Care
- Pharmaceutical Sciences
Research Article - (2025) Volume 14, Issue 2
Study on the Volatility Spillover Effect and Nonlinear Dynamic Evolution Mechanism of Economic Policy Uncertainty and Asset Prices-An Analysis of Futures Prices of Oil and Grease Agricultural Products Based on the VAR BEKK-GARCH-VS Model
Xiulian Zhou1* and Qiankun Jiang22Department of Economics and Management, Zhejiang Sci-Tech University, Hangzhou, China
Received: 29-May-2024, Manuscript No. AGT-24-25880; Editor assigned: 03-Jun-2024, Pre QC No. AGT-24-25880 (PQ); Reviewed: 17-Jun-2024, QC No. AGT-24-25880; Revised: 12-May-2025, Manuscript No. AGT-24-25880 (R); Published: 19-May-2025, DOI: 10.35248/2168-9891.25.14.407
Abstract
In this paper, we take the role path of economic policy uncertainty, securities market and futures market and construct VAR-BEKK-GARCH-VS model to explore the volatility spillover effect and nonlinear dynamic evolution of economic policy uncertainty and asset prices, and the empirical analysis results show that the oil and grease futures price and financial market have significant risk spillover effect and asymmetry and usually the oil and grease futures price is the risk transmitter of this volatility spillover; from the static spillover effect, the degree of influence of oil and grease futures price fluctuations on China's agricultural products market is the strongest; in the dynamic spillover effect, the oil and grease futures price under the impact of extreme events has significant time-varying characteristics and asymmetry, and the dependence on the fluctuation of China's futures prices is strong. Based on this, policy makers should adopt policy guidance and market subsidies, improve the futures reserve and insurance system for oil and grease agricultural products, and establish risk monitoring and early warning mechanisms to effectively prevent systemic risks.
Keywords
Fats and oils eco-agricultural products futures; Nonlinear dynamic evolution; Mean spillover; VAE-BEKKGARCH- VS model; Two-way spillover effect
Introduction
The epidemic has hit the world economy hard and seriously affected the global financial markets and countries have implemented unconventional monetary policies in order to recover the economy and stabilize the financial markets. In the "post-crisis era", China is facing unparalleled economic challenges such as overcapacity and inventory build-up, mismatch between supply and demand and debt defaults, which are typified by the serious "deconstruction" problem. With the deepening trade war between China and the United States, the downward pressure on China's economy needs to be resolved and hedged by a new round of supply-side structural reforms, while the depreciation of the renminbi, the decline of the stock market and the precariousness of the real estate market have increased the uncertainty about the future economic growth rate. This is not only a critical period of structural transformation of China's economy, the implementation of a new round of major reforms and the accumulation and release of deep-rooted problems, but also a period of rupture in the structure and order of the world economy and the complex domestic and international environments have greatly increased the uncertainty of the economy. Economic uncertainty covers macroeconomic, economic policy and financial market fundamentals, as well as economists' or investors' expectations of future uncertainty. Comprehensive and complex economic connotations have made uncertainty a powerful asset pricing factor, but can traditional asset pricing factors still adapt to the unpredictable and transmuted financial environment in a smooth economic environment? The research on economic policy uncertainty and asset pricing becomes the focus [1].
Summarizing the existing research results and related literature, it is found that the research on the relationship between economic policy uncertainty and oil futures pricing lacks sufficient theoretical support and mainly focuses on the "data+ model" type of experimental empirical analysis, which has not yet formed a scientific research paradigm. Therefore, the innovation of this paper lies in the use of VAR model cointegration theory, variance decomposition, impulse response function model and granger causality test to measure the level of volatility spillover, direction of spillover and asymmetry between economic policy uncertainty and financial market and to try to analyze and test the dynamic relationship between economic policy uncertainty and the futures price of agricultural products of oils and fats in a multi-dimensional way [2].
Many scholars at home and abroad have done a lot of research on the price spillover effect between spot and futures. Yuying yang takes China and international crude oil futures as the research object, analyzes the price volatility spillover effect of the epidemic on the crude oil market and finds that there is a volatility spillover effect between China and the international futures market and the volatility spillover effect is more significant during the epidemic and the futures market in China and the international futures market already have a high degree of correlation. Li Xinyue studies the impact of political factors and external factors such as the epidemic on the price fluctuations of bean futures and finds that there is a two-way volatility spillover effect manifested as an asymmetric "see-saw". Chun Weide and Zhu Hangcong analyze the extreme risk spillover effect between China's stock index futures and the spot market by constructing a mixed-frequency time-varying Copula model and find that there is an obvious asymmetric extreme risk spillover effect between the two. Liu and Zhang use EPU to predict realized volatility and find that high uncertainty generates high futures market volatility. Based volatility prediction model on fractal theory and pointed out that EPU index has fractal characteristics and significantly positively affects future volatility, which is a better predictor of volatility than GARCH family model. Xing, Genius and Wang, Xiaoxiao studied the dynamic correlation effect and volatility spillover effect of economic policy uncertainty in China and the U.S. with the stability of China's financial market, according to the study, the stability of China's financial market and the unpredictability of China's economic policy have a bi-directional volatility spillover effect [3].
In summary, there are in-depth studies on macroeconomic uncertainty and futures markets and futures prices, mainly focusing on macroeconomic indicators, economic growth, world economy and other factors, macroeconomics is a huge category, so this study hopes to construct macroeconomic indicators as well as futures price models, empirical testing to find out the correlation between macroeconomics and futures prices, and to provide some degree of empirical support for the possible theoretical relationship between the two. And provide a certain degree of empirical support for the possible theoretical relationship between the two [4].
Materials and Methods
Theoretical analysis and research hypothesis
Modeling the linkage between futures market prices and spot market prices: In this paper, we study the spillover effect of economic policy uncertainty on asset price volatility from the perspective of fats and oils agricultural product futures and select the EPU variable indicators that have the most significant impact on the volatility of agricultural product futures market and extend and enrich the mixed-frequency data model. Firstly, we describe the VAR-BEKK-GARCH model and the variable selection method and empirically investigate the price spillover effect of EPU variable indicators affecting oil and fat agricultural product futures. Then the ternary VAR-BEKK-GARCH-VS model is constructed to analyze the dynamic relationship between the futures prices of oil and grease agricultural products and other related factors (e.g., spot prices, macroeconomic indicators, etc.) and to reveal the mean and volatility spillovers between them. The VAR-BEKK-GARCH-VS model predicts realized volatility, describes heterogeneous volatility and investigates the spillover effects between the futures prices of oil and grease agricultural products. The spillover effect between futures prices provides important decision support and risk management strategies for market participants and hedgers, as well as suggestions for investors to formulate corresponding investment strategies and construct investment portfolios to reduce potential risks and improve investment returns (Figure 1) [5].

Figure 1: Variable passing path.
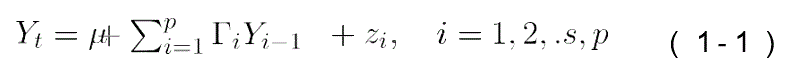
Ternary VAR-BEKK-GARCH-VS (1,1) model construction: The model constructed in this paper makes up for the shortcomings of the traditional standard VAR-GARCH model that cannot deal with too many variables, allows the variance to change over time and refines the price volatility factors implied in many variables, which provides compatibility for this paper to include a wide range of futures in the model research and analysis. The mean equation of the ternary VAR-BEKKGARCH- VS (1, 1) model is set as:
Selection and description of data: This paper collects the monthly data of agricultural commodity soybean oil (y), palm oil (p) and rapeseed oil (oi) futures indices from March 28, 2018 to March 28, 2023, as well as the monthly data of SSE composite index, monthly data of PPI, EPU, PMI. Indicator data obtained from WIND database, National Statistics Network, Flush database and EPU official website, data from Dalian commodity exchange and Zhengzhou commodity exchange.
The WALD test first estimates the original equation to get the estimates of the parameters and then substitutes the constraints to check whether they are valid. To test the volatility spillovers between financial markets original hypothesis test [4].
Hypothesis① H1: aij=bij=0, there is no volatility spillover effect from i futures market to j futures market.
Hypothesis② H2: aji=bji=0, j futures market on the i futures market does not exist volatility spillover effect.
Hypothesis③ H3: aij=bij=0 and aij=bi=0, there is no two-way volatility spillover effect between i futures market and j futures market.
Results and Discussion
Empirical results
Descriptive statistical analysis: This paper chooses to incorporate incorporate EPU multivariate indicators into the long-term volatility component of the VAR-BEKK-GARCH-VS model, empirically analyzes the spillover effects of the oil and grease price indicators and the conduction effects of related variables and tries to reveal the EPU indicators that have the greatest impact on the long-term volatility of the Chinese futures market. The final sample span period selected for the data of this study is March 2018-March 2022 (60 months in total). Descriptive statistics are shown in the table below (Table 1) [6].
| OILRET | PRET | YRET | |
| Mean | 0.020069 | 0.024183 | 0.02049 |
| Median | 0.031571 | 0.052562 | 0.064123 |
| Maximum | 5.762212 | 7.863408 | 5.235928 |
| Minimum | 6.759704 | 13.75928 | 8.273332 |
| Std. Dev | 1.311288 | 1.930832 | 1.43668 |
| Skewness | -0.43534 | 0.65795 | 0.609301 |
| Kurtosis | 5.978723 | 7.145555 | 6.327067 |
| Jarque-Bera | 496.3911 | 975.0248 | 647.0731 |
Table 1: Results of descriptive statistical analysis.
Table 1 shows the descriptive statistics of the futures returns of the three oil and grease agricultural products. It can be seen that all variables show a "spike" pattern and significant skewness, which is smooth at the 1% significance level and does not satisfy the normal distribution. Most of the variables are autocorrelated, indicating that it is necessary to choose the timevarying characteristic VAR-BEKK-GARCH model for modeling in this paper. From Table 1, it can be seen that the futures prices of the three oils and fats agricultural products have relatively strong consistency in their movements. The main reason for this is the substitution relationship between soybean oil, palm oil and vegetable oil.
As can be seen in Figure 2, the sample period is March 2018- March 2022, but the three futures of soybean oil, palm oil and rapeseed oil have higher price volatility in 2020-2022, and when the oil and fat futures market is impacted by the new crown epidemic, it is easier to have a wide range of more intensive and intense risk structure correlations dominated by risk resonance among the Chinese financial markets and the global public health events make oil and fat futures show a volatility spillover effects [7].
Analysis of static and dynamic aggregation of volatility spillovers: Aggregation of volatility means that price volatility shows different changes over time, static volatility towards smoothness, unable to judge the time-varying characteristics of the market risk level and unable to analyze the heterogeneous fluctuation of the risk of each market under the shock of an extreme event; dynamic volatility is relatively more intensive, implying that the price changes are frequent and large in magnitude and the shock of an extreme event changes only the size of the volatility overflow index of the futures price of the agricultural commodities in the category of fats and oils and fails to change the direction of its positive and negative volatility spillover. In the static spillover effect, there is a significant bidirectional spillover effect between the financial market and fats and oils futures; dynamic spillover effect, extreme event shocks to the financial system vulnerability increases, fats and oils futures market volatility and domestic financial market volatility between the bi-directional spillover effect and the state of the continuity will increase rapidly, thus increasing the risk of the domestic financial market [8].

Figure 2: Price time series of three kinds of oil and fat futures.
As shown in Figure 3, the time series of oil and grease futures market returns show more obvious volatility characteristics. Under the impact of extreme risk events, the correlation between the risk structure of the oil and fat futures market and China's financial market has obvious heterogeneity and "two-way volatility spillover effect" characteristics. Under the impact of the trade friction between China and the United States and the new crown epidemic, the equilibrium between the oil and fat futures market and the Chinese financial market has been completely broken and the focusing effect of "big wave follows small wave" is more obvious [9].

Figure 3: Time series of oil and grease eco-agricultural futures returns.
Mechanism test
Smoothness test: The smoothing test for the returns of the three oil futures using Eviews 9.0 yields the results shown in Table 2.
| Variable | 1% critical value | 5% critical value | 10%critical value | t-statistic | P-value | Conclusion |
| OILRET | 3.435428 | -2.86367 | 2.567954 | 32.68925 | 0.0000*** | Smoothly |
| PRET | 3.435428 | -2.86367 | 2.567954 | 35.25671 | 0.0000*** | Smoothly |
| YRET | 3.435428 | -2.86367 | 2.567954 | 35.04829 | 0.0000*** | Smoothly |
| Note: "*", "**" and "***" represent variables significant at 10%, 5% and 1% significance levels, respectively | ||||||
Table 2: Results of the smoothness test of the price return series.
As can be seen from Table 2, the price returns of various oil and grease sample data are all significant at the 1% level, so these sample data are all smooth time series and the validity of the model construction is guaranteed.
Selection of the optimal lag order: When using the VAR model for analysis, it is necessary to select the appropriate lag order, in order to make the VAR model better reflect the dynamic characteristics of the variables. In this paper, we synthesize the results of AIC, SC, LogL information criterion to determine the lag order and the minimum value is determined as the optimal lag order and the results are shown in Table 3 [10].
| Lag | LogL | AIC | SC |
| 1 | -2083.32 | 3.377544 | 18.33157 |
| 2 | -2077.53 | 3.375759 | 3.404773 |
| 3 | -2075.53 | 3.38012 | 3.421595 |
| 4 | -2072.99 | 3.383607 | 3.43756 |
| 5 | -2071.3 | 3.388476 | 3.454923 |
| 6 | -2068.88 | 3.392161 | 3.471118 |
Table 3: VAR model lag order test results.
From the test results in Table 3, it can be seen that at the 5% significance level, the optimal lag order of the VAR model according to the information criterion is 1, so lag order 1 should be selected.
Before carrying out the test of the nonlinear relationship between EPU and the return of the futures market of oil and grease agricultural products, the first nonlinear test of each serial model to construct the VAR (1) model, filter the linear components of the variables to be tested and use the residual term of the nonlinear test to determine whether there is a nonlinear component in it. The results are shown in Table 4.
|
|
OILRET |
PRET |
YRET |
|
OILRET(-1) |
0.102824*** |
-0.03552 |
0.056811 |
|
(0.04084) |
(0.06012) |
(0.04489) |
|
|
[2.51785] |
[-0.59082] |
[1.26560] |
|
|
PRET(-1) |
-0.066454** |
-0.122072*** |
-0.047632* |
|
(0.06012) |
(0.04084) |
(0.04489) |
|
|
[-2.04863] |
[-2.55607] |
[-1.33590] |
|
|
YRET(-1) |
0.040966 |
0.225729*** |
0.016599 |
|
(0.04735) |
(0.06971) |
(0.05205) |
|
|
[0.86517] |
[3.23795] |
[0.31892] |
|
|
c |
0.018765 |
0.023248 |
0.020239 |
|
(0.0372) |
(0.05477) |
(0.04089) |
|
|
[0.50445] |
[0.42448] |
[0.49497] |
Table 4: Estimated results of VAR (1) model for three types of oils and fats futures markets.
The estimation results in Table 4 show that there is a mean spillover effect among the three variables, but there are differences in performance. Accelerated financial integration leads to multi-dimensional heterogeneity of risk spillover among China's oil and grease futures markets and also complicates the dynamic nonlinear relationship of risk contagion within the financial system and the risk spillover effect is significantly enhanced [11].
Cointegration test: Cointegration is a linear combination between two non-stationary time series with smooth nature and the main purpose of cointegration test is to determine whether two or more variables co-evolve.
Based on the values of the cointegration statistics in Table 5, the maximum Eigenvalue test indicates that there are at least 2 cointegrating equations at the 0.05 level of significance. From the results of the sample cointegration tests at the return level and volatility level, the residual series are found to be smooth and we can conclude that there is a long term and stable cointegration relationship between the three time series of soybean oil, palm oil and vegetable oil (Figure 4) [12].
| No. of CE(s) | Eigenvalue | Statistic | Critical value | Critical value |
| None* | 0.361061 | 1516.997 | 29.79707 | 0 |
| At most 1* | 0.335928 | 963.7837 | 15.49471 | 0 |
| At most 2* | 0.309975 | 458.2181 | 3.841465 | 0 |
| Note: ***indicates significant at the 1% level, **indicates significant at the 5% level and *indicates significant at the 10% level | ||||
Table 5: Cointegration test results.

Figure 4: Graph of AR root model validation results
AR root mode test: The stability and validity of the model is proved by calculating the AR characteristic polynomials in the vector autoregressive model. By plotting the graph of the time series, all three points are located within a circle with a radius of 0.5 from the origin, showing a smooth character [13].
Nonlinear Granger causality test
In order to further explore the relationship between EPU and the price volatility of oil and fat agricultural products futures, this paper only uses the nonlinear Granger causality test (Table 6).
| Soybean oil futures and vegetable oil futures | Rapeseed oil futures and palm oil futures | Soybean oil futures and palm oil futures | ||||
| Original hypothesis | Soybean oil futures can't impact vegetable in Granger sense | Rapeseed oil futures cannot impact soybean oil in Granger sense | Rapeseed oil futures can not affect palm oil futures in the Granger sense | Palm oil futures can't impact vegetable oil futures in Granger sense | Soybean oil futures can not affect palm oil futures in the sense of Granger | Palm oil futures fail to impact soybean oil in Granger sense |
| Oil futures | Futures | Cargoes | Cargoes | Cargoes | Futures | |
| P-value | 0.5778 | 0.2982 | 0.0527 | 0.3889 | 0.2608 | 0.001 |
| Note: ***indicates significant at the 1% level, **indicates significant at the 5% level, and *indicates significant at the 10% level | ||||||
Table 6: Non-linear Granger causality test results.
The analysis of the actual data for the nonlinear Granger causality test shows that at least at 5% level of significance, the three oils and fats futures rejected the mutual Granger cause hypothesis. Soybean oil, palm oil, vegetable oil higher is closely related to many uncertainties such as politics, economic situation, major public health events, etc., which proves that the higher prices of oil and fat futures are attributed to the influence of EPU. Ludvigson et al., proposed that financial uncertainty is not related to endogenous self-economic fluctuations, which corroborates that the current "de-realization to and "virtual real deviation" characteristics of China's current economic development [14].
Impulse response analysis of variable returns
Based on the VAR model, the impulse response function is established to analyze the strength and direction of the response of one variable to another variable when the external shock system is hit (Figure 5).

Figure 5: Impulse response chart of rapeseed oil yield.
When the vegetable oil futures market is hit by a one-unit shock, there is a negative response from the vegetable oil futures themselves, which leveled off in period 3 (Figure 6).

Figure 6: Palm oil yield impulse response plot.
When the palm oil futures market was hit by a unit shock, the vegetable oil futures also responded negatively all along and leveled off in period 3 as well (Figure 7).

Figure 7: Soybean oil yield impulse response plot.
As can be seen from Figures 4-6, the impulse effect of the shock variable on the oil and grease indicators during the sample observation period shows an increase in lagged intensity and a tendency to converge at any time, with a small rebound in amplitude fluctuations and then a reversal in the subsequent time of the shock weakening to a positive response and a short-term market correction until the shock disappeared, which suggests that the market is gradually digesting the event and conducting a gradual retracement [15].
Analysis of price volatility spillover effect
BEKK-GARCH model estimation results construct: The VAR model is constructed for BEKK-GARCH analysis of the residuals is to better analyze the volatility spillovers between the futures markets of oil and fat agricultural products and the estimation results are shown in Table 7.
| Parameter | Coefficient | Standard error | t-value | Test probability |
| C(1,1) | 0.168034594 | 0.011822756 | 14.21281 | 0.00000000 |
| C(2,1) | 0.120513512 | 0.046219243 | 2.60743 | 0.00912243 |
| C(2,2) | 0.000136385 | 0.064061099 | 0.00213 | 0.99830132 |
| C(3,1) | 0.082946940 | 0.021479334 | -3.86171 | 0.00011260 |
| C(3,2) | 0.000111377 | 0.130644147 | 0.00852521 | 0.99931979 |
| C(3,3) | 0.000109102 | 0.109409764 | 0.000997189 | 0.99920436 |
| A(1,1) | 0.078449406 | 0.023488129 | -3.33996 | 0.00083791 |
| A(1,2) | 0.058822425 | 0.012860637 | -4.57383 | 0.00000479 |
| A(1,3) | 0.727794557 | 0.048668237 | -14.95420 | 0.00000000 |
| A(2,1) | 0.037945211 | 0.024094235 | -1.57487 | 0.11528719 |
| A(2,2) | 0.034227911 | 0.015195368 | -2.25252 | 0.02428926 |
| A(2,3) | 0.025382162 | 0.042895683 | 0.59172 | 0.55403921 |
| A(3,1) | 0.031253602 | 0.017999083 | -1.73640 | 0.08249318 |
| A(3,2) | 0.078393862 | 0.005626755 | -13.93234 | 0.00000000 |
| A(3,3) | 0.469637534 | 0.035475728 | 13.23828 | 0.00000000 |
| B(1,1) | 1.261576762 | 0.013144251 | 95.97936 | 0.00000000 |
| B(1,2) | 0.398941798 | 0.011545477 | 34.55395 | 0.00000000 |
| B(1,3) | 0.509589606 | 0.021532828 | 23.66571 | 0.00000000 |
| B(2,1) | 0.489269993 | 0.015229320 | -32.12684 | 0.00000000 |
| B(2,2) | 0.62597325 | 0.012788307 | 48.94888 | 0.00000000 |
Table 7: Estimated results of BEKK-GARCH model.
From the coefficient matrix A of the variance equation, A(1,1), A(2,2), A(3,3) are all different from zero at the 5% significance level and the effect of the three variables' prior period variance on their own current conditional variance is more obvious. B(1,1), B(2,2), and B(3,3) are significantly different from zero at the 5% significance level, which indicates that the YRET, PRET and OILRET variables' own lagged-period fluctuations have a positive effect on the current-period fluctuations have a significant GARCH effect; second, from the non-diagonal elements of matrices A and B, the coefficients are significant except for A(2,1), A(2,3), A(3,1) and B(3,2) which are insignificant at the 5% significance level, which implies that there is at least a significant YRET, PRET and OILRET variables' one-way volatility spillover effects (Table 8) [16].
WALD test for volatility spillover effects: Examining the direction of direct price volatility spillover effects of YRET, PRET and OILRET variables using WALD test establishes the following hypotheses:
Hypothesis 1: H1: a12=b12=0, there is no volatility spillover effect of soybean oil futures returns on vegetable oil futures returns.
Hypothesis 2: H2: a21=b21=0, there is no volatility spillover effect of rapeseed oil futures returns on soybean oil futures returns.
Hypothesis 3: H3: a12=b12=0; a21=b21=0, there is no bidirectional spillover effect between soybean oil futures returns and vegetable oil futures returns.
| Original hypothesis | Wald statistic | P-value | Conclusion |
| There is no volatility spillover effect from soybean oil futures market to vegetable oil futures market | 599.42773 | 0 | Reject H1H1A12=B12=0 |
| There is no vegetable oil futures market to soybean oil futures market volatility spillover effect | 522.05148 | 0 | Reject H2A21=B21=0 |
| Absence of spillovers from two-way volatility in the two markets | 529.1001 | 0 | Reject H3A12=B12=A21=B21=0 |
| Note: The data in the table corresponds to the Wald statistic, where ***means significant at the 1% level, **means significant at the 5% level and *means significant at the 10% level | |||
Table 8: Volatility spillover effects of soybean oil futures market and vegetable oil futures market WALD test.
From the estimation and test, the results of BEKK-GARCH(1,1) model estimation are subjected to WALD test, they all show P=0, all three original hypotheses are rejected at 1% level of significance, there is not only a volatility spillover in soybean oil futures market returns, but also a two-way volatility spillover effect (Table 9) [17].
| Original hypothesis | Wald statistic | P-value | Conclusion |
| There is no soybean oil futures market to palm oil futures market volatility spillover effect | 141.9198 | 0.00000000 | Reject H1 H1-A13=B13=0 |
| There is no palm oil futures market to soybean oil futures market volatility spillover effect | 38.55302 | 0 | Reject H2 H2-A23=B31=0 |
| Absence of spillover effects of two-way volatility in the two markets | 142.5722 | 0 | Reject H3 H3-A13=B13=A31=B31=0 |
| Note: The data in the table corresponds to the Wald statistic, where ***means significant at the 1% level, **means significant at the 5% level, and *means significant at the 10% level | |||
Table 9: WALD test of soybean oil futures market and palm oil futures market.
The parameter values estimated by the BEKK-GARCH model without infidelity are very significant and all three original hypotheses are rejected at the 1% significance level, indicating that there is a bidirectional volatility spillover effect between the soybean oil futures market return and the palm oil futures market return (Table 10) [18].
| Original hypothesis | Wald statistic | P-value | Conclusion |
| There is no vegetable oil futures market to palm oil futures market volatility spillover effect | 258.213 | 0 | Reject H1 H1-A23=B233=0 |
| There is no palm oil futures market to vegetable oil futures market volatility spillover effect | 103.999 | 0 | Reject H2 H2-A32=B32=0 |
| Absence of spillover effects of two-way volatility in the two markets | 201.2427 | 0 | Reject H3 H3-A23=B233=A32=B32=0 |
| Note: The data in the table corresponds to the Wald statistic, where ***means significant at the 1% level, **means significant at the 5% level, and *means significant at the 10% level | |||
Table 10: WALD test of vegetable oil futures market and palm oil futures market.
From the Table 10, we know that the fluctuation of oil and grease agricultural products futures has significant high and low volatility and the normal state of oil and grease agricultural products futures market yield does not have obvious volatility aggregation and risk spillover effect. In the extreme state, as the amplitude of volatility becomes larger, it shows significant phases of yield volatility and the "event-driven characteristics" of volatility spillover, which indicates that the futures market of oil and grease agricultural products has not yet realized the function of price discovery and thus is vulnerable to the influence of timevarying risk volatility spillover from economic policies and other related markets [19].
Limitations and further research
Economic policy uncertainty and asset price volatility spillover effects, nonlinear dynamic evolution mechanism research is the focus of the current academic research. However, due to the research time, author level and literature progress and other influencing factors, the research in this paper still has some deficiencies, for the deficiencies to be improved, this paper proposes to further expand the direction.
Indicator construction
This paper mainly focuses on the futures financial capital market. In the subsequent research, other types of financial markets such as forward, traditional stock market, bonds, foreign exchange, commodity market and digital currency market can be included, so as to enrich the relevant research results of the financial market. In addition, the sample selection in this paper for the oil and grease agricultural products futures market to select the market index is less. Because different futures in different economies measure different objects, it is often necessary to select multiple market indices to represent a particular economy. In order to make the research conclusions more accurate, the scientific measurement of economic uncertainty and systemic financial risk is a necessary future research direction. Future research can try to capture the dynamic evolution of high-frequency economic uncertainty and systemic financial risk based on real-time information flow using mixed-frequency dynamic factor modeling and big data methods.
Modeling choices
Although the optimal model chosen in this paper constructs a deep learning model that can accurately describe the data based on the sample data, subsequent research can further consider the RS-Copula model that combines the Markovian variable structure property on the basis of the sudden change in capital structure to better describe the correlation characteristics among variables in the futures of agricultural products of fats and oils. Therefore, the combination of high-dimensional Vine Copula model and deep learning can be used as a direction for further exploration in subsequent research and in-depth study of the application of high-dimensional Vine Copula model and deep learning in other financial problems.
Influence factors of risk contagion
In order to better understand the influencing factors of risk contagion in the volatility of economic policy uncertainty and asset prices, the ideal research method is to integrate all the potential transmission channels (e.g., futures market trade, financial capital markets, investor expectations, capital flows, etc.) into the model, but the issues of how to incorporate a larger number of influencing factors into the model and how to correctly set the transmission paths of each factor need to be addressed in subsequent research. How does economic uncertainty breed systemic financial risk by affecting the decision-making behavior of micro-individuals such as futures markets? What financial products are affected by economic uncertainty? Are different sources of economic uncertainty heterogeneous in their impact on specific futures products? The answers to these questions will be a major research direction in the future. Risk measurement and spillovers in capital markets.
Conclusion
On the basis of the model constructed in this paper, subsequent research can apply more and more typical volatility characteristics of the market to the optimization study of the volatility spillover effect of economic policy uncertainty and asset prices and the nonlinear dynamic evolution mechanism, so as to construct a more comprehensive and effective risk measurement and spillover test model. In addition, the trading timing of futures assets and the length of their holding period are also important factors affecting the volatility spillover effectand nonlinear dynamic evolution of economic policy uncertainty and asset prices, which will also become the focus of future research. Undeniably, the research on the volatility spillover effect of economic uncertainty in asset prices and the nonlinear dynamic evolution of the causes of systemic financial risk is still in its infancy and there is still a great deal of work that needs to be done for in-depth exploration, expansion and improvement.
Author Contributions
Conceptualization: X.Z. and Q.J.; Data curation: X.Z.; Formal analysis: X.Z. and Q.J.; Funding acquisition: X.Z. and Q.J.; Investigation: X.Z. and Q.J..; Methodology: X.Z. and Q.J.; Project administration: X.Z. and Q.J.; Resources: X.Z. and Q.J.; Software: X.Z; Supervision: Q.J.; Validation: X.Z.; Writing original draft: X.Z.; Writing review and editing: X.Z. and Q.J. All authors have read and agreed to the published version of the manuscript.
Institutional Review Board Statement
Not applicable.
Informed Consent Statement
Not applicable.
Data Availability Statement
We confirm that neither the manuscript nor any parts of its content are currently under consideration or published in another journal.
• All data generated or analysed during this study are included in this published article. • The datasets generated during and analysed during the current but are available from the corresponding author on reasonable request.
• All data generated or analyzed in this study are included in this published article. The datasets used and analyzed in the current study are available from the corresponding author upon reasonable request. Anyone wishing to obtain data from this study should contact corresponding author Xiulian Zhou".
No datasets were generated or analysed during the current study. The datasets used and analyzed during the current study available from the corresponding author on reasonable request. Anyone wishing to obtain data from this study.
Declaration of Interest
All authors have approved the manuscript and agree with its submission to your journal.
Disclosure Statement
No potential conflflict of interest.by the authors.
Funding
This research was funded by the Natural Science Foundation of Fujian Province China under the Grant Program of "Research on the Influence Mechanism, Contagion Effect and Countermeasures of Economic Policy Uncertainty on the Trait Volatility of China's A-shares" (No.2022Jo1986).
References
- Abel AB. Optimal investment under uncertainty. Amer Eco Rev. 1983:73(1):228-233.
- Evermann J, Rehse J R, Fettke P. Predicting process behaviour using deeplearning. Dec Sup System. 2017.
- Ballings M, Dirk V, Hespeels N. Evaluating multiple classifiers for stock price direction prediction. Expert System App. 2015;42:7046-7056.
- Fischer T, Krauss C. Deep learning with long short-term memory networks for financial market predictions. Europ J Operation Res. 2018;270:654-669.
- Saadaoui F, Messaoud OD. Multiscaled neural autoregressive distributed lag: A new empirical mode decomposition model for nonlinear time series forecasting. Int J Neur System. 2020:2050039.
- Hinton GE. Training products of experts by minimizing contrastive divergence. Neural Computat. 2002;14(8):1771-1800.
- Ivanovski Z, Ivanovska N, Narasanov K. The regression analysis of stock returns at MSE. J Mod Account Audit. 2016;12(4): 217-224.
- Carreira-Perpinan MA, Hinton GE. On contrastive divergence learning. proceed art intel statist. 2015.
- Roy SS, Mittal D, Basu A. Stock market forecasting using LASSO linear regression model. Springer Int Publish. 2015.
- Babu CN, Reddy BE. A moving-average filter based hybrid ARIMA–ANN model for forecasting time series data. Applied Soft Computing. 2014;23:27-38.
- Kim M, Sayama H. Predicting stock market movements using network science: An information theoretic approach. App Net Sci. 2017;2(1):35.
- Rundo N. Deep LSTM with reinforcement learning layer for financial trend prediction in FX high frequency trading systems. App Sci. 2019;9:1-18.
- Abid A. Economic policy uncertainty and exchange rates in emerging markets: Short and long runs evidence. Finan Res Let. 2020;37:101378.
- Aboura S, van Roye B. Financial stress and economic dynamics: The case of France. Int Econom. 2017;149:57-73.
- Amendola A, Candila V, Gallo GM. On the asymmetric impact of macro–variables on volatility. Eco Model. 2019;76:135-152.
- Anderson EW, Ghysels E, Juergens JL. The impact ofã??risk and uncertainty on expected returns. J Finan Eco. 2009;94(2):233-263.
- Antonakakis N, Chatziantoniou I, Gabauer D. Refined measures of dynamic connectedness based on time-varying parameter vector autoregressions. J Risk Finan Manag. 2020;13(4):84.
- Antoniou C, Harris RD, Zhang R. Ambiguity aversion and stock market participation: An empirical analysis. J Bank Fin. 2015;58:57-70.
- Asgharian H, Christiansen C, Hou AJ. Effects of macroeconomic uncertainty on the stock and bond markets. Fin Res Letter. 2015;13:10-16.
Citation: Zhou X, Jiang Q (2025) Study on the Volatility Spillover Effect and Nonlinear Dynamic Evolution Mechanism of Economic Policy Uncertainty and Asset Prices-An Analysis of Futures Prices of Oil and Grease Agricultural Products Based on the VAR-BEKKGARCH- VS Model. Agrotechnology. 14:.407.
Copyright: © 2025 Zhou X, et al. This is an open-access article distributed under the terms of the Creative Commons Attribution License, which permits unrestricted use, distribution, and reproduction in any medium, provided the original author and source are credited.