


Indexed In
- Open J Gate
- RefSeek
- Hamdard University
- EBSCO A-Z
- OCLC- WorldCat
- Publons
- International Scientific Indexing
- Euro Pub
- Google Scholar
Useful Links
Share This Page
Journal Flyer

Open Access Journals
- Agri and Aquaculture
- Biochemistry
- Bioinformatics & Systems Biology
- Business & Management
- Chemistry
- Clinical Sciences
- Engineering
- Food & Nutrition
- General Science
- Genetics & Molecular Biology
- Immunology & Microbiology
- Medical Sciences
- Neuroscience & Psychology
- Nursing & Health Care
- Pharmaceutical Sciences
Research Article - (2025) Volume 14, Issue 4
Spatio-Temporal Analysis of Coxâs Bazar from 1990 to 2020: Exploring the Relationship between LST, NDVI, NDBI and LULC
Mehadi Hasan*Received: 25-Jun-2024, Manuscript No. JGRS-24-25907; Editor assigned: 27-Jun-2024, Pre QC No. JGRS-24-25907 (PQ); Reviewed: 11-Jul-2024, QC No. JGRS-24-25907; Revised: 16-May-2025, Manuscript No. JGRS-24-25907 (R); Published: 23-May-2025, DOI: 10.35248/2469-4134.25.14.389
Abstract
Bangladesh, a densely populated developing nation, faces significant environmental challenges exacerbated by rapid population growth and economic development. This study focuses on Cox's Bazar district, characterized by its evolving land use patterns and susceptibility to the Urban Heat Island (UHI) effect. Using Geographic Information Science (GIS) and Remote Sensing (RS) techniques, we assess the dynamics of Land Use and Land Cover (LULC), Land Surface Temperature (LST), Normalized Difference Vegetation Index (NDVI), and Normalized Difference Builtup Index (NDBI) from 1990 to 2020. Our analysis reveals substantial shifts in LULC, with implications for environmental degradation and sustainable management. We observe a decline in forest acreage, emphasizing the urgent need for conservation efforts. Furthermore, our investigation into LST, NDVI, and NDBI highlights the impacts of urbanization and impervious surface expansion on temperature regulation and vegetation health. These findings underscore the importance of understanding and mitigating the UHI effect through informed land use planning and environmental management strategies. Through our comprehensive analysis, we contribute to the knowledge base on environmental change dynamics in Cox's Bazar district and provide insights for sustainable development initiatives in similar regions globally.
Data availability statement: The data used in this study, including Geographic Information Science (GIS) and Remote Sensing (RS) datasets, are available upon request from the corresponding author. Researchers interested in accessing the data are encouraged to contact the corresponding author for further information and assistance.
Keywords
Geographic information; Environmental; Degradation; Development
Abbrevations
UHI: Urban Heat Island, GIS: Geographic Information Science, RS: Remote Sensing, LULC: Land Use and Land Cover, LST: Land Surface Temperature, NDVI: Normalized Difference Vegetation Index, NDBI: Normalized Difference Built-up Index.
Introduction
Background of the study
With a population estimated to reach 222 million by 2050, Bangladesh is a small developing country with a large population that has increased the threat to the nation's forests. The nation's current land use patterns have long been brought to light by the country's accelerated population boom. Furthermore, in the twenty-first century, there has been a rapid shift in Land Uses and Land Cover Change (LULC) due to economic and industrial development, high population rates, and other factors [1]. This has resulted in the conversion of landscapes into residential areas and an increase in the amount of impervious surface area globally. Buildings, roads, and industrial zones are examples of impermeable surfaces that absorb solar radiation in the short wavelength range and decrease solar radiation in the long wavelength range that the Earth emits [2]. One well-known technique to evaluate ecological and environmental deterioration is to identify patterns of changes in land cover and use. For the sustainable management of natural resources, environmental protection, and food security, it is crucial to comprehend the complexity of LULC changes and to analyze and monitor them. Research on LULC changes can also be useful in forecasting future trends and informing planning decisions for natural resource management [3].
There are two standard methods for identifying the UHI effect. According to Hejazizadeh, et al. and Monteiro, et al., the first method uses ground-based air temperature measurements in microstudies based on the modeling of meteorological data. When conducting macrostudies using Land Surface Temperature (LST) data, the second approach is employed. LST is determined using remote sensing techniques that track the thermal energy that the Earth releases into the atmosphere using data from satellite images. As it enables the determination of the energy radiated from the Earth to the atmosphere, LST measurements using thermal satellite photos are simple, quick, continuous, and highly accurate. The primary factors influencing LST values are changes in LULC and greenhouse gas emissions. Because industrialization mostly relied on fossil fuels, it increased emissions of greenhouse gases, which in turn increased the rate of greenhouse gases in the troposphere, the lower atmosphere. The Earth's surface temperature rises due to absorption and reemission of solar radiation in the troposphere. The LULC variations affect the radiation emissions from the surface of the planet. Radiation is reflected by impermeable surfaces like highways and buildings, but is absorbed primarily by vegetation and surfaces coated in permeable materials. As a result, LULC changes alter LST values by altering the land surface's rate of radiation absorption. Furthermore, a number of studies have highlighted how evaporation from dense, healthy vegetation influences the LST and UHI. Thus, vegetation indicators and vegetation evaluation are done using remote sensing techniques. To characterize vegetation patterns, one of those indices the normalized difference vegetation index, or NDVI is frequently employed in research. Since the 1870's, Bangladesh's forest area has decreased, making up less than 16% of the nation's total land area, or 2.33 million hectares [4].
On the other hand, a lot of researchers looked at how urban impervious surfaces, such building roofs and roadways, affected LST using the Normalized Difference Built-Up Index (NDBI). Furthermore, research on LST and UHI demonstrates that identifying the variables influencing LST and the ways in which these variables interact are critical to developing strategies that mitigate the urban heat island effect [5].
Such LULC pattern analysis may be quickly completed and used to display the affected areas and their effects on the surrounding environment by integrating Geographic Information Science (GIS) and Remote Sensing (RS) techniques. Many studies on LULC changes have been carried out using different satellite data, such as Landsat, MODIS, and SPOT. However, Landsat satellite data has more potentiality in terms of LULC change detection studies because of the availability of multi-temporal time-series data from the year 1972 and free access to data with moderate spatial resolution. According to various sources, it makes sense that the analysis of LULC change dynamics assesses the various changes in the surrounding environment of an area and aids in the development of an efficient management plan which can assist in achieving sustainable development and appease both local and global environmental changes. Given all of these advancements, it is crucial to look into the implications of variations in the LST, NDVI, and NDBI values in Cox's Bazar's central district. Thus, in order to assess the change in the UHI effect, this study first examined the effects of changes in LULC, LST, NDVI, and NDBI values in the Cox's Bazar district between 1990 and 2020 [6].
Objectives
•To calculate the Land Surface Temperature (LST), Normalized Difference Vegetation Index (NDVI), and Normalized Difference Built-up Index (NDBI) for the study area in the years 1990, 2000 and 2020.
•To evaluate the changes in land use and land cover over the past three decades.
Study area
The total study area of Cox’s Bazar district is 2121 Km2 (158,000 ha). The longitude of the study area is 91°47'00"E to 92°20'00"E and the latitude of the study area is 20°50'00"N to 21°45'00"N. It is bounded by Chattogram district on the north, Bay of Bengal on the south, Bandarban district, Arakan (Myanmar) and the Naf River on the east, the Bay of Bengal on the west. The longest sea beach of the world belongs to Cox's Bazar. The climate of Bangladesh is mostly determined by its location in the tropical monsoon region: high temperature, heavy rainfall, generally excessive humidity, and distinct seasonal variations. The climate of Cox's Bazar is mostly similar to the rest of the country. It is further characterized by the location in the coastal area. The annual average temperature in Cox's Bazar remains at about a maximum of 34.8°C and a minimum of 16.1°C. The average amount of rainfall remains at 4,285 mm (Figure 1) [7].

Figure 1: Location of study area.
Materials and Methods
Data collection: This study uses secondary data for analysis where multi-spectral satellite imagery from three different years (1990, 2000, and 2020) was downloaded from the United States Geological Survey (USGS) as the secondary source to detect the changes in LULC, LST, NDVI and NDBI. Landsat images with less than 5% cloud coverage and 30 m resolution were acquired from USGS for the year 1990 (Landsat 5 Thematic Mapper), 2000 (Landsat 5 Thematic Mapper), 2020 (Landsat 8 Operational Land Imaget TIRS). To detect land use changes, supervised classification method (by ArcGIS 10.2) was used (Table 1) [8].
| Acquired date | Satellite | Spatial resolution | Path and row | Cloud cover | Sun elevation (degree) | Sun azimuth (degree) |
| 02.10.1990 | Landsat 5 TM | 30 m | 135, 46 | 0 | 39.65143 | 130.6322 |
| 03.05.1990 | Landsat 5 TM | 30 m | 136, 45 | 1.36 | 44.70697 | 123.8098 |
| 03.09.2000 | Landsat 5 TM | 30 m | 135,46 | 9.07 | 49.24904 | 123.5396 |
| 10.10.2000 | Landsat 5 TM | 30 m | 136,45 | 7.12 | 51.96428 | 135.4704 |
| 04.17.2020 | Landsat 8 OLI_TIRS | 30 m | 135,46 | 2.98 | 65.099 | 109.1013 |
| 03.23.2020 | Landsat 8 OLI_TIRS | 30 m | 136,45 | 0.95 | 57.93913 | 126.319 |
Table 1: The characteristics of the images.
LULC: A false color composition was used to classify the land uses into four classes e.g. agriculture, vegetation, water, and aquaculture. Only pre-monsoon (March to May) sunmmer season’s images were considered in this study because of the occurrence of cloud-free sky and least rainfall in this period that aided the actual detection of classified areas. The data were inbuilt georeferenced to UTM zone 46 North projection with WGS-84 datum [9].
Before the analysis, radiometric corrections and image enhancement procedures were executed with Arc-GIS 10.8 software. LULC maps were classified using the supervised classification method. The supervised classification was processed by ArcGIS 10.8. Bands 1–5 and 7 were used for preparing LULC maps with Landsat 5–TM images, but the 6 was excluded because it was a thermal band. The bands 1–7 were considered for Landsat 8- OLI images. All the bands were compounded in ArcGIS 10.8 software using the image analyst tool. More than 200 training samples were collected randomly using the training sample manager tool for each year (Figure 2) [10].

Figure 2: The schematic framework of methodology.
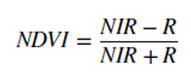
NDVI: NDVI describes the vegetation proportion by measuring the difference in the near-infrared portion of the electromagnetic spectrum and red portion of the spectrum. Healthy and lush vegetation absorbs visible light and reflects most of the nearinfrared light. On the contrary, unhealthy vegetation condition reflects more visible light and less nearinfrared light. NDVI has values ranging from +1 to –1 (+1 for the healthy vegetation and−1 for areas with no vegetation). NDVI was calculated in ArcGIS 10.8 by using the following equation [11].
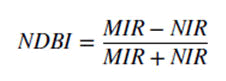
NDBI: NDBI ranges from −1 to +1 and distinguishes built-up territory from other land uses/land surfaces. Built-up lands have higher reflectance in MIR than in NIR. Therefore, the high NDBI values show the built-up areas. NDBI was calculated in ArcGIS 10.8 software using MIR band 6 and NIR band 5 of the Landsat-8 data and MIR band 5 and NIR band 4 of Landsat-5 data as shown in the equation below [12].
LST: LST refers to the temperature measured by the remote sensor. As the LST provides essential data about a climate system, the procedure has been addressed and clarified in many studies. In this study, the Landsat 5 images for 1990, 2000 and Landsat 8 images for 2020 were used to perform the LST analysis described below:
Step 1: Conversion to Top of Atmosphere (TOA) radiance: we applied the formula in Eq. 3 to convert thermal infra-red numbers (DN) to TOA values for Landsat-8 data.
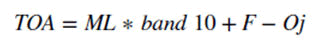
ML=the band-specific multiplicative rescaling factor=0.0003342; F=re-scaling factor=0.1; Oj =correction value=0.29.
The formula in the equation below was applied to the Landsat-5 TM data.
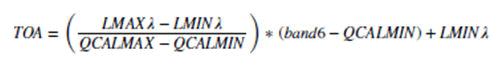
LMAXλ=is the radiance that is scaled to QCALMAX; LMINλ is the radiance that is scaled to QCALMIN, QCALMIN is the lowest calibrated value, and LMIN is the highest calibrated value LMAX λ.
Step 2: Brightness temperature: radiance values were converted to brightness temperature using the equation below
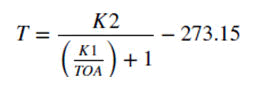
T=brightness temperature (0 C); K1=calibration constant 1 (Table 2); K2=calibration constant 2 (Table 2)
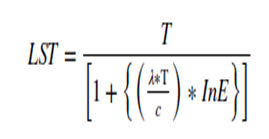
Step 3: Calculation of LST applying the equation
| Sensor | Year | Band | K1 | K2 |
| Landsat 5 | 1990 | Band 6 | 702.34 | 1380.45 |
| Landsat 5 | 2000 | Band 6 | 702.34 | 1380.45 |
| Landsat 8 | 2020 | Band 10 | 792.93 | 1523.23 |
Table 2: Thermal constant of Landsat TM and OLI.
T=brightness temperature (°C), λ=wavelength of emitted radiance=10.8 for band, E=emissivity of land surface, C=14,388mK
It is necessary to obtain the Land surface Emissivity (E) to calculate the LST. It refers to the radiating and absorbing power of a surface in the long-wave radiation spectrum and generally differs by the land cover. The equation is shown below.
E=0.004 × pv+0.986
E=land surface emissivity; Pv=proportion of vegetation; 0.986 is the correction value.
To determine the land surface emissivity (E) value, the vegetation proportion (Pv) parameter equation proposed is shown below.

Pv is vegetation proportion; NDVImin is the lowest value of NDVI; NDVImax is the highest value of NDVI.
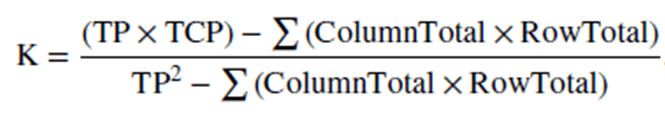
Accuracy assessment: The classification accuracy assessment was conducted with the reference of the raw satellite images. The entire process was executed by comparing the reference images with the classified images with some random points following stratified random sampling procedure. Another common image classification accuracy measure is Kappa coefficient (K). Typically, its values range from 0 to 1, where the higher the value, the higher the agreement and accuracy. This K statistic was also computed in this study using the following formula: Where TP is total pixels, and TCP is total corrected pixels. The result reveals that the value of overall classification accuracy varies from 79.22% to 90.79% and Kappa statistics varies from 0.76 to 0.87 that indicates high accuracy [12, 13].
Result and Discussion
LULC: The land use of Cox’s Bazar district was categorized into four: Waterbody, vegetation, bare lands, and built-up area. Figure 3 shows the spatial distribution of land use in Barton in 1990 and 2020 [14].
Table 3 below presents the LULC and change statics. The (−) minus sign indicates that it has decreased compared to the previous period, and the (+) plus sign indicates the opposite. The analysis results showed that between 1990 and 2020 , built-up areas increased significantly from 467.1 to 945.7 km2 by 22.6%, but bare lands has decreased from 842.64 (38.80%) to 148.44 (6.86%) by 694.2 (-31.90%). Here we can also see that the vegetation cover has increased a little from 842.16 km2 (38.78%) to 1067.70 km2 (49.17%) by 225.54 km2 (+10.39%). Land use maps provide essential information about the spatial change in urban regions. Because of the increasing of tourist attraction between these decades, the built up area also increased [15].

Figure 3: Spatial distribution of LULC in 1990 and 2020.
| Year/Types | Area in 1990 (km2) | Area in 2020 (km2) | Difference between 1990 and 2020 (km2) |
| Vegetation | 842.16 (38.78%) | 1067.70 (49.17%) | +225.54 (+10.39%) |
| Built-up area | 467.1 (21.5%) | 945.81 (43.56%) | +478.71 (+22.6%) |
| Bare land | 842.64 (38.80%) | 148.44 (6.86%) | -694.2 (-31.90%) |
| Waterbody | 19.55 (0.80%) | 9.81 (0.43%) | -9.74 (-0.37%) |
| Total | 2171.45 (100%) | 2171.45 (100%) |
Table 3: LULC and change statistics of Cox’s Bazar.
LST: Figure 4 shows the LST maps of the study area in 1990, 2000 and 2020. As seen in the figure, the average temperature in most of the Cox’s Bazar district was 20°C–25°C in the 1990's, while some part were less than 20°C; in 2000 we see whole of the area having avarage LST of 20°C-25°C. But it rose to 25°C-30°C in this region in 2020, while some part having LST of more than 30°C. Similarly, there is a significant increase in urban settlements’ LST values. Table 4 shows a statistical overview of LST values. In general, there has been an increase in the maximum and average temperature values of the study area over the 30 years. The average temperature rose from 20.28 to 25.19° C from 1990 to 2020 [16].

Figure 4: LST maps for the years 1990, 2000 and 2020.
|
Year |
Min |
Max |
Average |
Standard deviation |
|
1990 |
10.57 |
30.009 |
20.28 |
2.35 |
|
2000 |
10.66 |
32.45 |
21.55 |
1.31 |
|
2020 |
12.72 |
37.67 |
25.19 |
2.12 |
Table 4: The statistical summary of LST values for Cox’s Bazar.
NDVI: The Normalized Difference Vegetation Index (NDVI) identifies and monitors vegetation. Several studies also investigate the effects of NDVI on the Urban Heat Island (UHI). The values between 0.1 and 0.75 generally indicate vegetation cover. NDVI maps are shown in Figure 5. The lowest values showed bare lands and buildings. However, as emphasized by Lin and Matzarakis 2008, and Scott and Lemieux 2009, it is tough to distinguish bare lands and built-up areas by using NDVI values. The NDVI value of above 0.1 corresponds to the vegetation cover. Similarly, in this study, the values of NDVI were categorized as low (0.1–0.2), medium (0.2–0.3), and high (0.4–…). As shown in Figure 4, the most drastic changes mainly occurred in three regions. The first region was the Bartin city center, where NDVI values decreased significantly. The changes in the agricultural lands in the north and the highland settlements in the south were also evident. Especially the upland settlements in the Mountains, which have rich vegetation cover, led to a decline in vegetation across the study area. Table 5 shows the NDVI density classes in 1990 and 2021, and Table 6 gives a statistical summary of NDVI values. As shown in Table 5, there were decreases in low, medium, and high-density classes, but a very high increase occurred in builtup areas [17].
|
Year |
Min |
Max |
Average |
Standard deviation |
|
1990 |
-0.28 |
0.49 |
0.14 |
0.1 |
|
2000 |
-0.14 |
0.54 |
0.18 |
0.52 |
|
2020 |
-0.2 |
0.76 |
0.21 |
0.12 |
Table 5: The statistical summary of NDVI values for Cox’s Bazar.

Figure 5: NDVI maps for the years 1990, 2000 and 2020.
|
Year/Types |
Area in 1990 (km2) |
Area in 2000 (km2) |
Area in 2020 (Km2) |
Difference between 1990 and 2020 (km2) |
|
Built-up area |
310.76 (14.65%) |
376.13 (17.32%) |
708.19 (33.38%) |
+398.03 (+18.73%) |
|
Low vegetation |
500.50 (23.57%) |
506.39 (23.32%) |
596.20 (27.46%) |
+95.7 (+3.89%) |
|
Medium Vegetation |
655.48 (30.18%) |
615.77 (28.37%) |
599.03 (27.58%) |
-56.45 (-2.6%) |
|
High vegetation |
703.48 (32.39%) |
613.17 (31%) |
468.01 (22.06%) |
-235.38 (10.3%) |
Table 6: NDVI and change statistics for Cox’s Bazar.
NDBI: NDBI has been applied in many studies as it helps distinguish the built-up areas from other land uses and land cover. The NDBI density maps are given in Figure 6 and statistical data are shown in Table 7. The negative NDBI values correspond to vegetation, small positive values to bare lands, and significant positive values to built-up areas. However, the NDBI values indicating residential differed in some studies. NDBI value representing the residential areas was 0.07 for the year 1990 and, 0.16 for the year 2021 [18].
|
|
Min |
Max |
Average |
Standard deviation |
|
1990 |
-0.33 |
0.46 |
-0.05 |
0.08 |
|
2000 |
-0.32 |
0.19 |
0.07 |
0.08 |
|
2020 |
-0.36 |
0.27 |
0.08 |
0.09 |
Table 7: The statistical summary of NDBI values for Cox’s bazar.

Figure 6: NDVI maps for the years 1990, 2000 and 2020.
Accuracy assessment
The result reveals that the value of both classification accuracy varies from 79.22% to 90.79% and Kappa statistics varies from 0.76 to 0.87 that indicates high accuracy [19].
Conclusion
In this study, LST values of 1990, 2000 and 2020 were analyzed in order to determine the change in the urban heat effect in Cox’s Bazar over 30 years. The study results showed that the average temperature of Cox’s Bazar was 20.28°C in 1990, but it rose to 25.19°C in 30 years. In order to determine the spatial changes in the LST values, LULCC maps for 1990 and 2021 were formed. As a result of the LULCC maps, it was found that the land use of Cox’s Bazar district had changed rapidly from 1990 to 2020 due to urbanization and agricultural and industrial practices. A negative correlation also found between NDBI and LST. The built areas has increased in the last 30 years, but the vegetation has decreased resulting in the rise of LST.
Declaration of Interest
The authors declare that they have no known competing financial interests or personal relationships that could have appeared to influence the work reported in this paper. e and broadly supported.
References
- Billah M, Rahman GA. Land cover mapping of Khulna city applying remote sensing technique. Proceed 12th Int Conf Geoinform Gavle, Sweden. 2004;7:707–714.
- Richard E, Okoth-Ogendo HWO. Population-Driven Changes in Land Use in Developing Countries. Ambio. 2002; 21:37-45.
- Chaudhuri G, Mishra NB. Spatio-temporal dynamics of land cover and land surface temperature in Ganges-Brahmaputra delta: A comparative analysis between India and Bangladesh. Appl Geogr. 2016;68:68–83.
- Clifford N, French S, Valentine G. Key Methods in Geography, Sage Publication. 2016.
- Creswell JW. Educational Research: Planning, Conducting, and Evaluating Quantitative and Qualitative Research (5th Edn.), Pearson Education. 2015.
- FAO. Guidelines for land-use planning. Food and Agriculture Organization of the United Nations. Rome, Italy. 1996;12:20.
- Hussain M, Alak P, AZMZ I. Spatio-temporal analysis of land use and land cover changes in Chittagong city corporation, Bangladesh. Int J Adv Remote Sens GIS Geogr. 2016;4:56–72.
- Islam M, Hassn M. Losses of Agricultural Land due to Infrastructural Development: A Study on Rajshahi District. Int J Sci Eng Res. 2013;4:391–396.
- Jaysal RK, Ram R. Application of remote sensing technology for land use/land cover change analysis. 1999;12:2021.
- Kraus MW, Keltner D. Signs of Socioeconomic Status: A Thin-Slicing Approach. Psychol Sci. 20:99–106.
[Crossref] [Google Scholar] [PubMed]
- Kumar L, Ghosh MK. Land cover change detection of Hatiya Island, Bangladesh, using remote sensing techniques. J Appl Remote Sens. 2012;6:063608.
- Mahbub A. Agricultural land loss and food security: An assessment. IRRI, Manila, the Philippines. 2003.
- McTavish EJ, Decker JE, Schnabel RD, Taylor JF, Hillis DM. New World cattle show ancestry from multiple independent domestication events. Proc Natl Acad Sci. 2010;110:1398–1406.
- Oakes JM, Rossi PH. The measurement of SES in health research: Current practice and steps toward a new approach. Soc Sci Med. 2003;56:769–784.
- Sermsathanasawadi N, Voravitvet TY, Chinsakchai K, Wongwanit C, Ruangsetakit C, Mutirangura P. Risk factors for endovenous heat-induced thrombosis after endovenous radiofrequency ablation performed in Thailand. Phlebol. 2016;31:582–587.
[Crossref] [Google Scholar] [PubMed]
- Marsh P, Price BA, Holdstock J, Harrison C, Whiteley MS. Deep Vein Thrombosis (DVT) after venous thermoablation techniques: rates of Endovenous Heat-Induced Thrombosis (EHIT) and classical DVT after radiofrequency and endovenous laser ablation in a single centre. Eur J Vasc Endovasc Surg. 2010;40:521–527.
[Crossref] [Google Scholar] [PubMed]
- Kim SH, Patel N, Thapar K, Pandurangadu AV, Bahl A. Isolated proximal greater saphenous vein thrombosis and the risk of propagation to deep vein thrombosis and pulmonary embolism. Vascu health risk manag. 2018:129-135.
[Crossref] [Google Scholar] [PubMed]
- Lim W, Meade M, Lauzier F, Zarychanski R, Mehta S, Lamontagne F, et al. Failure of anticoagulant thromboprophylaxis: risk factors in medical-surgical critically ill patients. Crit Care Med. 2015;43(2):401-410.
[Crossref] [Google Scholar] [PubMed]
- Wang TF, Wong CA, Milligan PE, Thoelke MS, Woeltje KF, Gage BF. Risk factors for inpatient venous thromboembolism despite thromboprophylaxis. Throm Res. 2014;133(1):25-29.
[Crossref] [Google Scholar] [PubMed]
Citation: Hasan M (2025) Spatio-Temporal Analysis of Coxâ??s Bazar from 1990 to 2020: Exploring the Relationship between LST, NDVI, NDBI and LULC. J Remote Sens GIS. 14:389.
Copyright: © 2025 Hasan M. This is an open-access article distributed under the terms of the Creative Commons Attribution License, which permits unrestricted use, distribution and reproduction in any medium, provided the original author and source are credited.