Indexed In
- Open J Gate
- RefSeek
- Hamdard University
- EBSCO A-Z
- OCLC- WorldCat
- Publons
- International Scientific Indexing
- Euro Pub
- Google Scholar
Useful Links
Share This Page
Journal Flyer

Open Access Journals
- Agri and Aquaculture
- Biochemistry
- Bioinformatics & Systems Biology
- Business & Management
- Chemistry
- Clinical Sciences
- Engineering
- Food & Nutrition
- General Science
- Genetics & Molecular Biology
- Immunology & Microbiology
- Medical Sciences
- Neuroscience & Psychology
- Nursing & Health Care
- Pharmaceutical Sciences
Research Article - (2022) Volume 11, Issue 3
Spatial Morphometric Characterization of Akaki Watershed
Tesfamariam E. Mengesha*Received: 25-Feb-2022, Manuscript No. JGRS-22-15707; Editor assigned: 02-Mar-2022, Pre QC No. JGRS-22-15707; Reviewed: 17-Mar-2022, QC No. JGRS-22-15707; Revised: 24-Mar-2022, Manuscript No. JGRS-22-15707; Published: 31-Mar-2022, DOI: 10.35248/2469-4134.22.11.221
Abstract
Several worldwide DEMs based on satellite data have been released in the last decade. The accuracy of these datasets is frequently uncertain, as it varies from dataset to dataset. The quality of a Digital Elevation Models (DEM) is a key criterion for many applications, and it is influenced by local land cover, terrain slope, and several stages of DEM processing, from collection through resampling interpolation. The primary goal of this research is to assess the quality of the most recent freely available global Multi-Error-Removed Improved Terrain (MERIT) DEM digital elevation models in the Akaki watershed for morphological parameter assessment. The DEMs used in this investigation were created at an original spatial location. It was discovered that the coarse grained DEM has an impact on the portrayal of terrain attributes. When compared to a ground Global Positioning System (GPS) point, the total vertical accuracy exhibits RMSE errors of 13.4 m and 0.38 m Mean Absolute Percentage Error (MAPE) DEM, respectively. The watershed’s morphmetric parameters were examined using standard GIS technique including relief, linear and areal aspect computations. The Akaki watershed was classified as a fourth-order watershed, with the regulating components of stream orders being physiography, rainfall, local lithology, and structure. Lower-order streams are the most common in the watershed.
Keywords
Digital elevation models; Accuracy; Assessment; Morphometric parameters
Introduction
We can better understand patterns and processes in geomorphology, geology, climatology, hydrology and biodiversity science by studying elevation data, as well as determine what type of soil we have and how the Earth changes due to glaciers, rivers, mountain building and erosion processes. The Earth has been observed from space by numerous spacecraft for a long time, and these spacecraft have collected spatial data. There is a wide range of horizontal and vertical datums, accuracies, formats, projections, etc., resulting in a mosaic of different data sources that cannot be relied on to be uniform and accurate . Most of the previous studies conducted on hydrological, hydrodynamic and environment-related such as used those freely available DEM’s. From those studies, they demonstrated that a full understanding of Digital Elevation Models (DEM) accuracy is required before using them for applications such as watershed hydrology, flood/inundation propagation, or sediment transport/ deposition. Most of the assessments compare freely available DEM products with Global Positioning System (GPS) survey points or with DEM’s developed based on photogrammetric aerial images or on laser scanning (e.g., LiDAR) [1,2].
Researchers have evaluated several global-scale DEM products, including SRTM, ASTER, and ALOSPALSAR [3]. However, no comprehensive and systematic assessment of the quality of freely available global DEMs has been undertaken yet in the study area. In space-borne DEMs, speckle noise, strip noise, absolute bias, tree height bias, and other observational errors are present. As a result, the errors caused by the vertical precision of the elevation data should be evaluated while using these space-borne DEMs. Assessing the accuracy of the topographic data before application and quantification of the available water in a catchment is necessary for the sustainable utilization of water resources. This study aims to understand the prevalent geological variation, terrain information, and structural setup of the Akaki watershed in Ethiopia and evaluate MERIT DEM based on Ground Truth Points (GCPs) obtained through Differential Global Positioning Systems (DGPS).
Materials and Methods
Description of study area
The Akaki catchment is located in central Ethiopia along the western margin of the Main Ethiopian Rift. The catchment is geographically bounded between 8°46–9°14´N and 38°34´– 39°04´E, covering an area of more than 1500 km2 . The entire catchment is bounded to the north by the Intoto ridge system, to the west by mount Menagesha and the Wechecha volcanic range,to the southwest by mount Furi, to the south by mount Bilbilo and Guji, to the southeast by the Gara Bushu hills and to the east by the mount Yerer volcanic center. The study area, despite it’s near to the equator, has a temperate Afro-Alpine climate. According to the Addis Ababa Observatory, daily average temperatures range from 9.9 to 24.6 °C and yearly mean rainfall is 1254 mm (Figure 1).
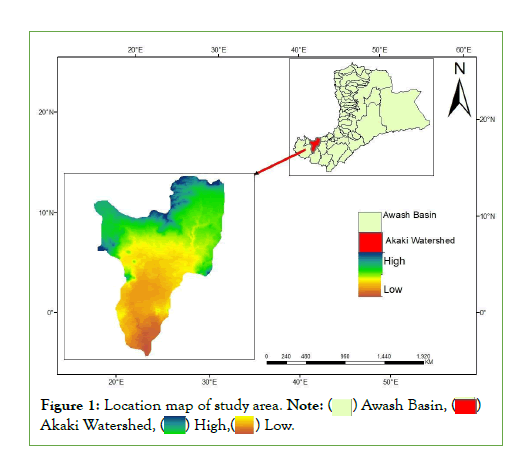
Figure 1: Location map of study area.

Two unique seasonal weather patterns describe the Akaki catchment’s climate. The primary wet season, known locally as Kiremt, lasts from June to September and accounts for over 70% of the total annual rainfall. From mid-february until mid-april, the region is irrigated by a minor rainy season known as Belg. The dry season lasts another five months.
Data
The Multi-Error-Removed Improved Terrain (MERIT) DEM 3 arc-seconds (90 m), SRTM data with ALOS World 3D data at a resolution of 30 m AW3D-30 m and ground truth data were used.
Digital image processing
MERIT DEM, a high accuracy global DEM at 3 arc second resolution (90 m at the equator) produced by eliminating major error components from existing DEMs (NASA SRTM 3 DEM, JAXA AW3D DEM, Viewfinder Panoramas DEM), was created by combining SRTM data with ALOS World 3D data at a resolution of 30 m (AW3D-30 m v1), and MERIT DEM, a high accuracy global [4]. MERIT DEM uses various satellite datasets and filtering approaches to extract absolute bias, stripe noise, speckle noise, and tree height bias, while ground truth data was obtained within the study region using Differential Global Positioning Systems (DGPS). In portions of the study region, DGPS sensors with coordinates (UTM zone 37 N) were used to capture elevation of the sample locations (Figure 2).
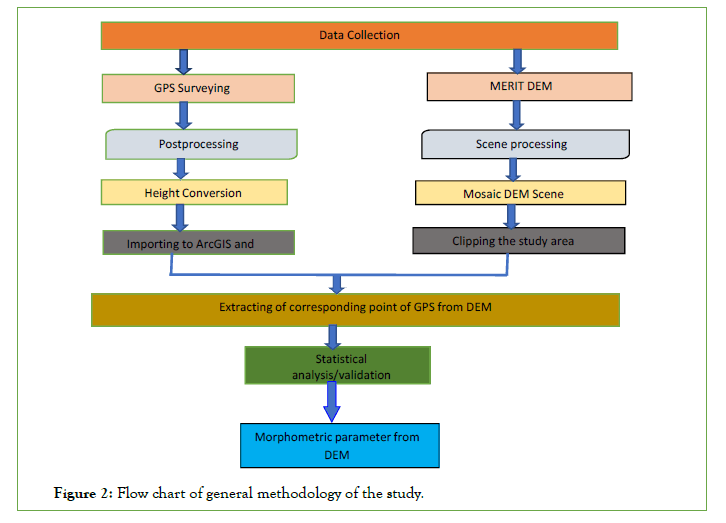
Figure 2: Flow chart of general methodology of the study.
Accuracy assessments of DEM: To examine the accuracy of satellite images, many different types of reference data can be used. The accuracy and quality of the data to be reviewed should be at least one order higher. GNSS data collection, post-processing, transformation of geometric heights into orthometric heights, DEM mosaic, extraction of the matching points in the DEM, and statistical analysis for 006Dodel validation are all part of the DEM validation process. The majority of the evaluations compare openly accessible DEM products to GPS survey points [1] or DEMs created using photogrammetric aerial photos or laser scanning (e.g., LiDAR) [2]. In this investigation, the Vertical Error MERIT DEM was calculated in relation to DGPS point elevation using a well-known statistical bias estimation technique. To determine the DEM’s correctness, the elevation error (the difference between reference and modelled elevation data) was determined, followed by the Maximum error (Max), Minimum error (Min), Mean Error (ME), Standard Deviation Error (STD) and Root Mean Square Error (RMSE) [5].
Extraction watershed delineation: Basically, there are two Methods of Watershed Delineations named as Manual watershed delineation and Automatic watershed delineation methods. In this study, Watershed boundaries were derived from MERIT DEMs using automated procedures through the pour point identification with the Watershed Delineator arc hydro tool box in an ArcGIS extension of spatial toolset.
The phases in the GIS approach for watershed delineation are as follows. The First, the “Fill” tool was used to remove small imperfections in the data and enabled the “Flow Direction” tool to run properly and create a grid of flow direction from each cell in the elevation grid to its steepest down slope neighbor. Then, in the flow direction grid, the “Flow Accumulation” tool was used to construct a grid of accumulated flow to each cell from all other cells. The next phase was to find the watershed outlet grid, making sure it was directly above a grid cell from the drainage system. Some of the result in watershed processing is described below [6].
Morphometric assessment of akaki watershed: One of the key factors that influence watershed hydrology is morphometric parameters, which have significant utility in the quantitative description of the geometry of drainage basins and their network, and aids in characterizing the drainage network. The morphometric characteristics of a watershed can reveal a lot about its history and growth. Because the watershed is the site of all hydrologic and geomorphic changes [7]. Basic, derived, and form morphometric characteristics were measured and calculated quantitatively using Arc GIS packages and mathematical equations created by the authors.
Results and Discussion
DEM data
The entire elevation statistics for the study area, including the minimum, maximum, mean, and standard deviation of elevation values gathered to investigate horological morphology (Table 1).
| Statistics | Value |
|---|---|
| Maximum | 3379 |
| Minimum | 1810 |
| Mean | 2380 |
| Standard deviation | 267 |
Table 1: Statistical summary of DEM.
Form the corrected MERIT DEM, the study as a terrain elevation range of 1801-3379 meters above mean sea level, with a mean height of 2380 meters.
Accuracy assessment of MERIT DEM
DEMs accuracy assessment uses a range of high-precision reference locations to provide accurate findings. The accuracy of the reference points would be at least three times that of the DEM heights in terms of accuracy. The root mean square error was used to assess both random and systematic errors in this study. This error metric is used by the USGS to compare DEM products to elevation points, which show the most likely elevations at specific sites [8]. Surface quality is revealed by STD and RMSE that provide the insight into the distribution of deviations on the side of the mean value. Variety of methods, including the use of a digital global positioning system, were used to compare these accuracy levels to ground-based data. DGPS sensors with coordinates (UTM zone 37 N) in portions of the research region were used to acquire elevation of the 674 data points for this investigation. The EGM96 geoid model was used to record the elevation of the data points as height above Mean Sea Level (MSL), whilst GPS points were recorded as ellipsoidal height (Table 2).
| Parameters | GPS | DEM | Difference(M) |
|---|---|---|---|
| Count | 674 | 674 | 0 |
| Maximum | 3112.834 | 3115.841 | 3 |
| Minimum | 2051.758 | 2052.972 | 1.2 |
| Mean | 2345.269 | 2340.465 | 4.8 |
| Stand | 162.7746 | 160.706 | 2 |
Table 2: Summary of the ground truth sample and point derived DEM.
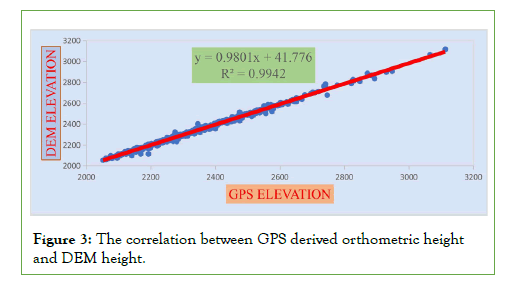
The observed point data of GPS contains the height with ellipsoidal height reference vertical datum. The ellipsoidal height was converted into orthometric height by using Matlab to make it similar to DEM which will be the difference in ellipsoidal height(h) and geoidal undulation(N) in which N = egm96geoid (lat, lon). The accuracy of a DEM is determined by its locations, and this accuracy can be evaluated by comparing it to a reference point that is obtained on the ground using high-precision equipment such as a Global Positioning System (GPS) (Figure 3).
Figure 3:The correlation between GPS derived orthometric height and DEM height.
The elevation of GPS generated points and MERIT DEM points have extremely similar/same values of mean, max, and standard deviation [9].
Because of the huge number of distributed reference points, all scatter plots demonstrate a perfect fit between reference and DEM elevation values. The MERIT DEM result reveals a significant strong positive connection with a correlation coefficient of r=0.996.
Different statistical factors were employed to evaluate MERIT DEM with respect to GPS point in this study, and the elevation data values collected from GPS height were compared with DEM. Mean Absolute Deviation (MAD), Mean Absolute Percentage Error (MAPE), and Root Mean Square Error (RMSE) are the most commonly utilized statistical parameters in this study [10]. RMSE is a frequently used measure of surface quality that helps to understand discrepancies between two types of data (DEM and observed data the results of the statistical error assessment between DEM and GPS point (Table 3).
| Accuracy of DEM | Value |
|---|---|
| Mean Absolute deviation (MAD) | 9.08 |
| Root Mean Square Error (RMSE) | 13.4 |
| Mean Absolute Percentage Error (MAPE) | 0.38 |
Table 3: Accuracy assessments of DEM.
The accuracy of the MERIT DEM was determined by the accuracy and dispersion of sampling ground truth. The study’s findings revealed that MERIT DEM is more accurate than SRTM, ALOS, and ASTER. MERIT DEM’s RMSE, MAPE, and MAD are 13.4, 0.38, and 9.08, respectively, according results. The SRTM’s vertical and horizontal accuracy at 90 percent confidence, according to Maryam Khal, are 16 meters in a linear error and 20 meters in a circular error, respectively, which is consistent with the study’s findings. For different elevation ranges, the RMSE of the SRTM (90 m), ALOS-PALSAR (12.5 m), and ASTER (30 m) DEMs were determined to be 31.899, 17.186, and 19.587, respectively, showing that MERIT DEM has better accuracy [11].
Because of their ability to record natural or man-made changes in the topography of terrestrial surfaces, developed DEM products such as TanDEM-X and MERIT DEM, which are based on more current remote sensing data and better processing methods, will be very helpful. As a result, the MERIT DEM is more accurate vertically than the SRTM [3].
Watershed delineation
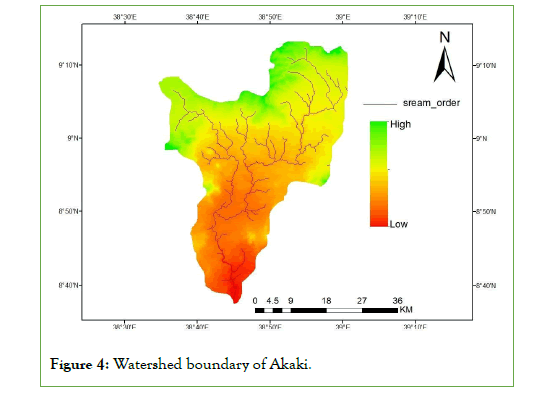
The Akaki watershed has been delineated from Awash basin as sub-watershed. With elevation data from MERIT data sources,watersheds within DEMs have been delineated using the pour point of the user-defined cell of highest flow accumulation. In this work, ArcGIS and ArcHydro tools were used to create data on flow direction, flow accumulation, stream definition, and stream segmentation, as well as to identify watershed boundaries with raster-based terrain analysis tools [12]. ArcGIS and ArcHydro tools were used in this work to create data on flow direction, flow accumulation, stream definition, and stream segmentation, as well as to identify watershed boundaries, using key ideas of raster-based terrain analysis tools. The extracted sub- watershed basin has been verified through previously delineated watershed boundary form Awash basin. The following map depicted the physical watershed boundary of Akaki watershed (Figure 4).
Figure 4: Watershed boundary of Akaki.
Furthermore, other hydrological parameters in GIS like Fill operation for Identifying and filling sinks in the DEM, Calculating and creating the flow direction and accumulation map, creating stream network map from the flow accumulation grid and creating stream order raster from the stream network raster map were obtained using Arc GIS [13].
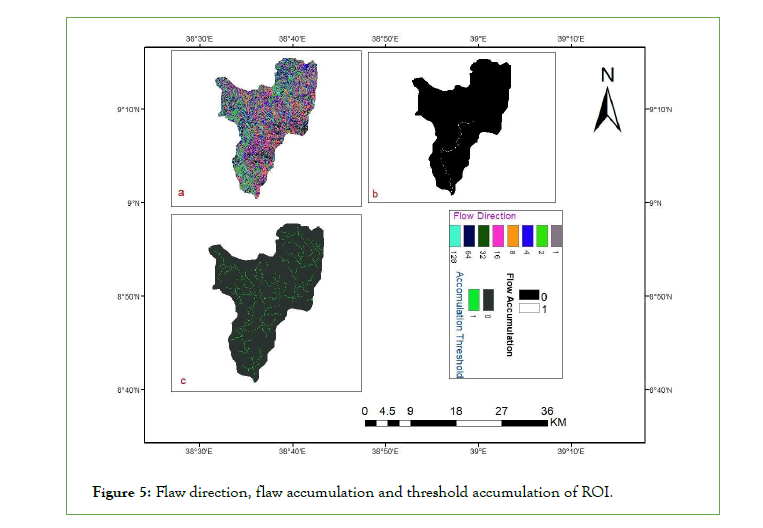
Flow direction and accumulation: The flow direction of Akaki watershed was calculated based on the most widely used D8 algorithm and defines the direction of slope for each cell. A flow direction and grid of flow accumulation was created by determining the number of upstream cells draining to a given cell.
The results of flow accumulation used to create a stream network by applying a threshold value. A range of threshold values has experimented when extracted the streams networks from the DEMs based on, 1% of the maximum flow accumulation value and the mean flow accumulation value, the flow accumulation values at the cells including the beginning points of the line features representing the existing streams. The adjacency and direction relationships between the cells [14]. For this study the mean flow accumulation value was used to obtain morphometric parameters. The flow accumulation used to drive another parameter (Figure 5).
Figure 5: Flaw direction, flaw accumulation and threshold accumulation of ROI.
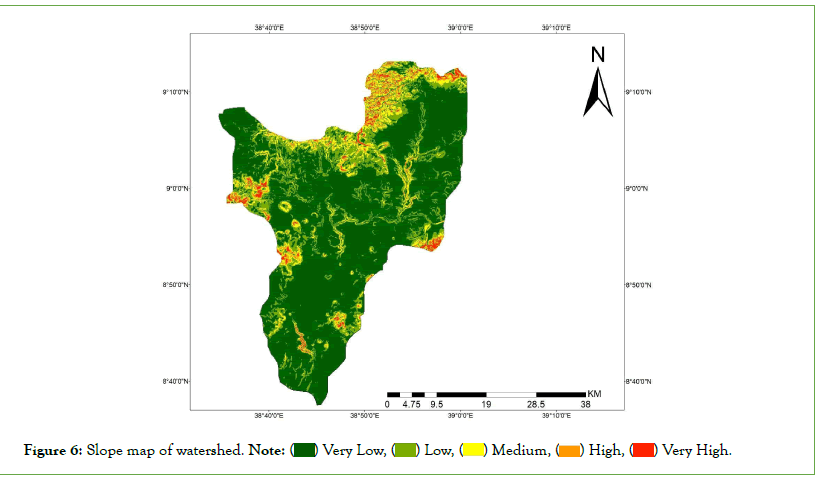
Slope: Slope is one of the major geomorphometric parameters and refers to a surface’s degree of incline, is calculated as the highest rate of change in elevation between that site and its surroundings. The slope can be expressed as a percentage or in degrees. In this study, it had been divided into five categories of very low, low, medium, high, very high slope with increasing of degree respectively. The slope in Akaki watershed have been ranges from 0-35(Very High to Very Low) (Figure 6).
Figure 6: Slope map of watershed.
Morphometric assessment of akaki watershed
Watershed morphometric parameters are essential to understand the hydrological and morphological characteristics of any basin and are useful to understand the structural controls of basin. The analysis of basin morphometry is a prerequisite to the assessment of hydrological characteristics of the surface water basin. The three groups of morphometric parameters: linear, areal, and relief parameters were measured and calculated quantitatively using Arc GIS packages and the mathematical equations developed by Vieceli et al. [15].
Linear aspect: The linear morphometric characteristics include one-dimensional (x-axis) stream variables, such as stream order, stream number, stream length, mean stream length, stream length ratio, bifurcation ratio, and length of overland flow. They are mostly determined by the drainage network’s properties, which are impacted by the local topography. These parameters are used to characterize topographic features that have an impact on drainage network patterns. The findings of the analysis are given and detailed below describe about the linear parameters.
According to Strahler, first order streams are streams that do not have a tributary while second order streams occur at the junction of first order streams, the stream order increases when two streams of the same order join [16]. First-order streams are dominated by overland flow of water; they have no upstream concentrated flow. Because of this, they are most susceptible to non-point source pollution problems and can derive more benefit from wide riparian buffers than other areas of the watershed. Accordingly, the order of streams of Akaki watershed are counted and presented (Table 4).
| Stream Order | Number of stream | Stream Length(M) | Mean stream length | str.L.ratio | Bifurcation ratio (Rb) | Mean. B u.R | Rho cofficient |
|---|---|---|---|---|---|---|---|
| 1 | 95 | 298356 | 3.14 | 0.44 | 2.07 | 0.21 | |
| 2 | 46 | 131548 | 2.86 | 0.42 | 2.88 | 0.81 | 0.15 |
| 3 | 16 | 54949 | 3.43 | 1.59 | 0.59 | 2.68 | |
| 4 | 27 | 87159 | 3.23 | ||||
| Perimeter (P) | 219.06 | ||||||
| Basin length | 120.002 |
Table 4: Linear aspect of morphometric parameters.
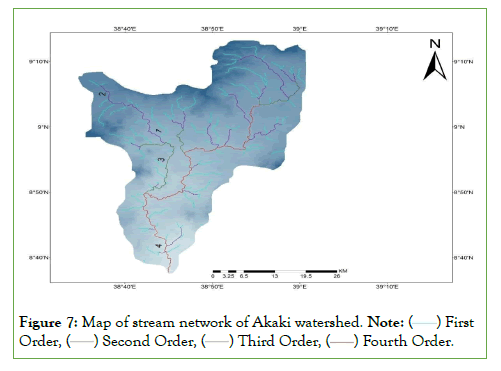
As a result, depicts the Akaki watershed’s stream order classification. The stream order of the analyzed watershed is divided into fourth orders based on this diagram. It’s also important to note that the stream order is largely determined by the number of streams. Streams order influences the size of the contributing drainage area, channel dimension, and stream discharge at that point in the drainage system. In general, first-order streams have the greatest summation of stream length segments, which decreases as stream order increases. The segments of streams of orders in the Akaki watershed area, on the other hand, differ from the generalized observation. This variation could be due to streams coming from higher altitudes, lithological differences, or relatively steep slopes [17]. According to Gizachew and Berhan and Soni, a basin with such a pattern emerges on uniform resistant rocks, large igneous rocks, and produces a higher volume of stream flow (Figure 7).
Figure 7: Map of stream network of Akaki watershed.

Strahler provided an improved Horton stream ordering algorithm, which was used in this investigation. Furthermore, it is the most popular and extensively utilized simple method [18]. A watershed’s length and number of streams of various orders are tallied and measured. In total, the watershed contains 184 streams [19]. Because of the upper mountain path, lower order streams are more abundant. Furthermore, the existence of younger topography along the stream indicates that the upper portions of the stream have a higher percentage of streams. The overall length of stream segments is greatest in first-order streams and decreases as the order of the stream decreases, according to Horton’s second law [19]. The invermany empirise relationship between stream order and stream number is seen in the study. The Findings there is an inverse relationship between stream order and stream number in watersheds. The entire length of streams obtained from DEM is around 572 kilometers, and the total length of order decreases as the order of stream increases, with the first order stream having the longest stream length of 298 kilometers [20-22]. The discrepancy rate between the shortest and longest lengths reaches 152.2 kilometers. The length of the stream demonstrates how the stream parts have improved over time, despite periodic structural tectonic activity and other factors. As well as the result shows that the basin’s total stream length is inversely proportional to the stream order, with the lower stream order having a shorter length (87.159 km) and a lower number of streams and the higher stream order having a single stream with a longer length (298.356 km) and a higher number of streams (298.356 km). There may be an irregularity in the stream length and stream order relation at times, which could be related to differences in the basin’s lithology. The variations in stream length between the third and fourth orders reflect geological and morphological control over the river basin, as well as drainage basin lithological inconsistency [23,24]. According to studies, the mountain–plain front river basin has a longer stream length than the plateau–plain front river basin. Many empirical research has reported similar findings [25]. A small number of longer stream lengths are prevalent when the bedrock is permeable, while a large number of short stream lengths are frequent where the rock composition is less permeable [26]. According to Strahler, the size of the drainage network and its associated surface features are related to the mean stream length as a distinctive characteristic [18]. It’s calculated by dividing the total length of all streams in stream segments by the number of streams observed. In the present study region, the value ranges between 2.8 to 3.4 kilometers. When stream order increase, the mean stream length increases with it and such variation may be due to variation in the topography and slope. Variation in stream length from one order to the next indicates that streams in the current study region are in the early or initial stages of geomorphic development. During the study, it is found that the whole basins have the stream length ratio varies from 0.4 to 1.6 from summaries.
Bifurcation: It is a fundamental parameter that describes a basin’s water carrying capacity and related flood potentiality and illustrates the drainage network’s branching pattern. According to Strahler, the Rb shows relatively minor variation in different places due to weak influences on geological formation [27]. In the study area, the value of Rb ranges from 0.6 to 2.8 Rb indicating that, streams are branched systematically with large number of first, second and third order streams. Hence, findings in the Akaki watershed indicate morphological adjustment inconsistencies as well as which the Rb values are not consistent throughout the different order [28,29]. Furthermore, a high bifurcation ratio in higher-order streams suggests a high amount of water received in the upper watershed and Low Rb and the resulting smaller number of streams in the lower reaches increase water pressure [30]. Flooding seems to be more frequent when the bifurcation ratio is low because water tends to accumulate rather than spread out. These differences are depending upon the Geological and Lithological development of the drainage basin. Human intervention is significant in lowering the bifurcation ratio, which increases the risk of floods in the basin. Higher bifurcation ratios indicate that the drainage pattern is under significant structural control [31].
Areal/Geometric aspects: Aerial aspect can be defined as the two-dimensional property of the basin, which delineates area that contributes water from each stream segment. In aerial aspect point of view measurement, important morphometric metrics such as drainage density, texture ratio, stream frequency, form factor, circularity ratio, elongation ratio, and length of overland flow have been described in more detail (Table 5).
| Parameters | Reference for the formula | Value |
|---|---|---|
| Drainage Density (Dd) | Horton (1932) | 0.36 |
| Stream Frequency (Fs) | Horton (1932) | 0.11 |
| Constant of Channel Maintenance (C) | Schumm (1956) | 8.74 |
| Drainage Intensity (Di) | Faniran (1968) | 0.32 |
| Infiltration number (If) | Faniran (1968) | 0.04 |
| Length of overland flow (Lo) | Horton (1945) | 1.4 |
| Basin Area(A) | ArcGIS | 1608.8 |
| Perimeter(P) | ArcGIS | 219.06 |
| Basin Length | ArcGIS | 120 |
| Form factor R(FR) | Horton (1945) | 0.11 |
| Elongation Ratio | Schumm (1956 | 0.38 |
| Texture ratio | Schumm (1956) | 0.84 |
| Circular Ratio (Rc) | Miller (1953) | 0.42 |
| Shape Factor R (Sf) | Horton (1945) | 8.95 |
| Fitness ratio | Melton (1957) | 0.55 |
| Length Area Relation(lar) | Hack (1957) | 117.5 |
| Lemniscate’s (k) | Chorley (1957) | 8.95 |
| Circularity ration | Strahler (1964) | 7.34 |
| Relative perimeter | Schumm (1956 | 7.34 |
Table 5: Areal aspect of morphometric parameter.
Stream frequency: Is the ratio of the total number of stream segments (all orders combined) to the basin area. Stream frequency is determined by the basin’s permeability, infiltration capacity, and relief. Stream frequency with a lower value implies a poor drainage network. Stream frequency of Akaki watershed is 0.1 (number/ km2), which can categorize as a low stream frequency [32].
Drainage texture/texture ratio: Drainage texture refers to the relative spacing of the total number of stream segments of a certain length per unit area in a given location [19], and it is determined on the terrain’s underlying lithology, infiltration potential, and relief aspect. The texture of drainage has been divided into five categories. When the figure is less than 2, it indicates very coarse drainage textures, 2 to 4 suggests moderate drainage textures, 4 to 6 indicates intermediate drainage textures, 6 to 8 indicates fine drainage textures, and more than 8 indicates very fine drainage textures. The recorded texture value of Akaki watershed is 0.84, have very coarse drainage texture, which signify higher permeability and enhanced ground water.
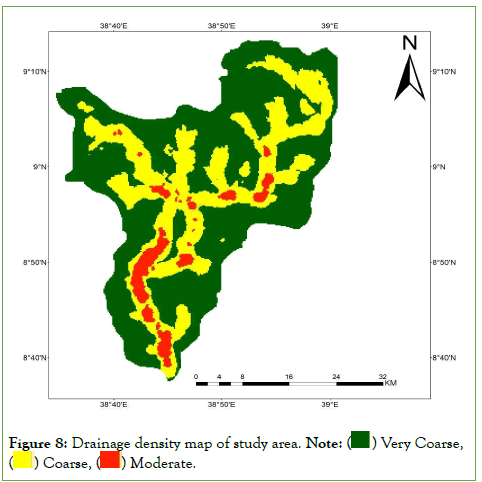
Drainage density: Drainage density can be calculated based on the length of the stream and the basin’s total area and it helps to determine the time it takes for water to travel. Drainage density can be categorized into different class, values between 0-2 imply very permeable subsoil, 2.0-4.0 indicate medium drainage density, and 4.0-6.0 show high drainage density, indicating permeable subsurface material [33]. The drainage density of Akakai watershed 0.9-5.9 indicates that the watershed has highly permeable subsoil and thick vegetative cover (Figure 8).
Figure 8: Drainage density map of study area.

Relief aspect of akaki watershed: Relief morphometry is critical when studying a catchment’s erosional characteristics. It is the best indicator of erosional stages of any river basin [15]. The vertical distance between the lowest and highest altitudes in a basin is known as basin relief. It is fundamental to understand a basin’s denudation characteristics. In this study, five relief morphometric parameters are considered: Relative Relief Ratio (Rhp), Basin relief (Bh), Relief ratio (Rh), Ruggedness Number (RN), and Gradient Ratio (GR), The higher value of the watershed’s relief indicates that it has less infiltration and more runoff. The maximum and minimum relief values of the Akaki watershed area are 3379 and 1809 m, respectively, with a mean relief value of 2380 m, hence, the relief of the watershed area is 1569 meters.
The Basin (H) parameter has a significant influence on stream gradient, which influences flooding patterns and the amount of sediment that can be transported. In this context, watershed relief is a measure of the potential energy of the drainage system present due to elevation above a given datum [25]. As a result, it is a critical factor in understanding a drainage basin’s denudational status, drainage network development, over land flow and through flow, and the fluvial erosional characteristics of the terrain. From the table bellow the basin of the relief is 1569.64 m.
According to Fryirs and Brierley, the relief ratio is a dimensionless number that represents the average elevation change per unit length of river. The maximum and minimum elevation resembles the highest and lowest point of the watershed [34]. The highest elevations of Akaki watershed correspond to the northern west and northeastern region of the watershed and the lowest elevation predominates in the central and southern part of the watershed (Table 6).
| Relief aspects | Parameters |
|---|---|
| Basin Relief(H) | 1569.64 |
| Relief ratio (Rh) | 0.17 |
| Relative Relief ratio (Rhp) | 0.71 |
| Gradient Ratio (Rg) | 0.01 |
| Ruggedness number (Rn) | 0.56 |
Table 6: Summary of Relief aspect of morphometric parameter.
It is calculated by dividing the total relief of the basin by the maximum length of the watershed and is used to determine the overall steepness of a drainage basin and the strength of the erosion process occurring on the basin’s slope. Accordingly, the finding value also indicative of the possibility of occurring of overland flow. The maximum basin relief was attained from the highest point on the watershed perimeter to the stream’s mouth. According to Schumm, relative relief is computed using the basin relief of the study area, which is 0.71 meter [35].
Ruggedness index (Ri) is calculated by multiplying drainage density by relative relief and is determined by the region’s subsurface geology, geomorphology, slope, steepness, vegetation cover, climate, and other factors. The higher the Ri value of any place, the more likely it is in the early stages of geomorphic development or denudation. Akaki’s Ri value is low 0.56 which indicates that erosion has reached its mature and maximal denudation stages.
Conclusion
The goal of this study was to validate the MERIT DEM and use it to characterize the Akaki watershed morphometrically. In plain, undulating, hilly, or flat areas, the variation in DEM and GPS elevation varied depending on the nature of the landscape. The elevations from GPS and MERIT DEM differed significantly in the study area, not only because of sampling and data resolution differences, but also because the terrain of the study area is highly varied, which has a significant impact on the accuracy of terrain characterization both spatially and with differences in altitude. The watershed’s fundamental, derived, and form characteristics were calculated using morphmetric analysis. The watershed can be characterized by the elongation ratio, circulation ratio, form factor, and other factors, according to the drainage morphometric analysis of the study region. The result demonstrates the drainage characterisation based on parameter values. As a result, the MERIT DEM and GIS software package provides quick, accurate, and lowcost tools for extracting and analyzing morphometric parameters for watershed studies.
Ethics Declaration
We hereby declare that this study is our original work and has not been published in any other journals, and all sources of material used for this study have been duly acknowledged. We would like to confirm that we have consented to publish this article at Journal of Remote sensing and GIS.
Conflicts of Interest
We declare that no conflict of interest. The funder has no role in the design of the study; in the collection, analyses, or interpretation of data; in the writing of the manuscript, or in the decision to publish the results.
Funding
This study was financed by Ethiopian Space Science and Technology Institute (ESSTI), Website: https://etssti.org/; P.O.Box 33679, Addis Abeba, Ethiopia.
REFERENCES
- Dong Y, Chang HC, Chen W, Zhang K, Feng R. Accuracy assessment of GDEM, SRTM, and DLR-SRTM in northeastern China. Geocarto Int. 2015;30(7):779-792.
[Crossref] [Google scholar].
- Walczak Z, Sojka M, Wróżyński R, Laks I. Estimation of polder retention capacity based on ASTER, SRTM and LIDAR DEMs: The case of majdany polder (West Poland). 2016;8(6):230.
[Crossref] [Google scholar].
- Hawker L, Neal J, Bates P. Accuracy assessment of the TanDEM-X 90 digital elevation model for selected floodplain sites. Remote Sens Environ. 2019;232:111319.
[Crossref] [Google scholar].
- Yamazaki D, Ikeshima D, Tawatari R, Yamaguchi T, O'Loughlin F, Neal JC, et al. A high‐accuracy map of global terrain elevations. Geophys Res Lett. 2017;44(11):5844-5853.
[Crossref] [Google scholar].
- Bhardwaj A. Assessment of vertical accuracy for TanDEM-X 90 m DEMs in plain, moderate, and rugged terrain. In multidisciplinary digital publishing institute proceedings 2019;24(1):8.
[Crossref] [Google scholar].
- Bajat B, Blagojević D, Kilibarda M, Luković J, Tošić I. Spatial analysis of the temperature trends in serbia during the period 1961–2010. Theor Appl Climatol. 2015;121(1):289-301.
[Crossref] [Google scholar].
- Balzter H, Cole B, Thiel C, Schmullius C. Mapping CORINE land cover from Sentinel-1A SAR and SRTM digital elevation model data using random forests. Remote Sens. 2015;7(11):14876-14898.
[Crossref] [Google scholar].
- Wessel B, Huber M, Wohlfart C, Marschalk U, Kosmann D, Roth A. Accuracy assessment of the global TanDEM-X digital elevation model with GPS data. ISPRS J Photogramm Remote Sens. 2018;139:171-82.
[Crossref] [Google Scholar].
- Bonilla-Sierra V, Scholtes L, Donzé FV, Elmouttie MK. Rock slope stability analysis using photogrammetric data and DFN–DEM modelling. Acta Geotech. 2015;10(4):497-511.
[Crossref] [Google scholar].
- Chorley RJ. Illustrating the laws of morphometry. Geol Mag. 1957;94(2):140-150.
[Crossref] [Google scholar].
- Del Rosario Gonzalez-Moradas M, Viveen W. Evaluation of ASTER GDEM2, SRTMv3. 0, ALOS AW3D30 and TanDEM-X DEMs for the peruvian andes against highly accurate GNSS ground control points and geomorphological-hydrological metrics. Remote Sens Environ. 2020;237:111509.
[Crossref] [Google scholar].
- Faniran A. The index of drainage intensity: a provisional new drainage factor. Aust J Sci. 1968;31(9):326-330.
- Fenta AA, Kifle A, Gebreyohannes T, Hailu G. Spatial analysis of groundwater potential using remote sensing and GIS-based multi-criteria evaluation in raya valley, Northern Ethiopia. Hydrogeol J.2015;23(1):195-206.
[Crossref] [Google scholar].
- Thomas J, Prasannakumar V. Comparison of basin morphometry derived from topographic maps, ASTER and SRTM DEMs: an example from kerala, India. Geocarto Int. 2015;30(3):346-364.
[Crossref] [Google scholar].
- Vieceli N, Bortolin TA, Mendes LA, Bacarim G, Cemin G, Schneider VE. Morphometric evaluation of watersheds in Caxias do Sul City, Brazil, using SRTM (DEM) data and GIS. Environ Earth Sci. 2015;73(9):5677-5685.
[Crossref] [Google scholar].
- Strahler AN. Quantitative analysis of watershed geomorphology. American Geophysical Union. 1957;38(6):913-920.
[Crossref] [Google scholar].
- Singh P, Gupta A, Singh M. Hydrological inferences from watershed analysis for water resource management using remote sensing and GIS techniques. Egypt. J Remote Sens Space Sci. 2014;17(2):111-121.
[Crossref] [Google scholar].
- Strahler AN. Quantitative geomorphology of drainage basins and channel networks. 1964:4-39.
- Horton RE. Erosional development of streams and their drainage basins; hydrophysical approach to quantitative morphology. Geol Soc Am Bull. 1945;56(3):275-370.
[Crossref] [Google scholar].
- Khal M, Algouti A, Algouti A. Modeling of water erosion in the M'Goun watershed using open GIS software. J Comput Syst Sci Int. 2018;12(12):1102-1106.
[Crossref] [Google scholar].
- Liu K, Song C, Ke L, Jiang L, Pan Y, Ma R. Global open-access DEM performances in earth's most rugged region high mountain asia: A multi-level assessment. Geomorphology. 2019;338:16-26.
[Crossref] [Google scholar].
- Miller V. A quantitative geomorphic study of drainage basin characteristics in the clinch mountain area, Virginia and Tennessee. Project NR. 1953;389-402.
- Melton MA. An analysis of the relations among elements of climate, surface properties, and geomorphology. Columbia univ New York; 1957.
[Google scholar] [Indexed].
- Papaioannou G, Loukas A, Vasiliades L, Aronica GT. Flood inundation mapping sensitivity to riverine spatial resolution and modelling approach. Nat Hazards. 2016;83(1):117-132.
[Crossref] [Google scholar].
- Farhan Y. Morphometric assessment of wadi wala watershed, southern jordan using ASTER (DEM) and GIS. J Geogr Inf Syst. 2017; 9(2):158-190.
[Crossref] [Google scholar].
- Asode AN, Sreenivasa A, Lakkundi TK. Quantitative morphometric analysis in the hard rock hirehalla sub-basin, bellary and davanagere districts, karnataka, India using RS and GIS. Arab J Geosci. 2016;9(5):1-4.
[Crossref] [Google scholar].
- Strahler AN. Hypsometric (area-altitude) analysis of erosional topography. Geol Soc Am Bull. 1952; 63(11):1117-1142.
[Crossref] [Google scholar].
- Piloyan A, Konečný M. Semi-automated classification of landform elements in armenia based on SRTM DEM using k-means unsupervised classification. Quaest Geogr. 2017;36(1):93-103.
[Crossref] [Google scholar].
- Purinton B, Bookhagen B. Validation of digital elevation models (DEMs) and comparison of geomorphic metrics on the southern central andean plateau. Earth Surf Dyn. 2017;5(2):211-237.
[Crossref] [Google scholar].
- Rahmati O, Yousefi S, Kalantari Z, Uuemaa E, Teimurian T, Keesstra S, et al. Multi-hazard exposure mapping using machine learning techniques: A case study from Iran. Remote Sens. 2019;11(16):1943.
[Crossref] [Google scholar].
- Saha A, Singh P. Drainage morphometric analysis and water resource management of hindon river basin, using earth observation data sets. Int j multidiscip res. 2017;3(4):2051-2057.
[Google scholar] [Indexed].
- Saint-Laurent D, Paradis R, Drouin A, Gervais-Beaulac V. Impacts of floods on organic carbon concentrations in alluvial soils along hydrological gradients using a digital elevation model.2016;8(5):208.
[Crossref] [Google scholar].
- Scown MW, Thoms MC, De Jager NR. Floodplain complexity and surface metrics: Influences of scale and geomorphology. Geomorphology. 2015;245:102-116.
[Crossref] [Google scholar].
- Yamazaki D, Sato T, Kanae S, Hirabayashi Y, Bates PD. Regional flood dynamics in a bifurcating mega delta simulated in a global river model. Geophys Res Lett. 2014;41(9):3127-3135.
[Crossref] [Google scholar].
- Schumm SA. Evolution of drainage systems and slopes in badlands at perth amboy, New Jersey. Geol Soc Am Bull. 1956;67(5):597-646.
[Crossref] [Google scholar].
Citation: Mengesha TE, Awoke BG, Belay WA (2022) Spatial Morphometric Characterization of Akaki Watershed. J Remote Sens GIS.11:221.
Copyright: © 2022 Mengesha TE, et al. This is an open-access article distributed under the terms of the Creative Commons Attribution License, which permits unrestricted use, distribution, and reproduction in any medium, provided the original author and source are credited.
