


Indexed In
- Open J Gate
- Genamics JournalSeek
- Academic Keys
- JournalTOCs
- CiteFactor
- Ulrich's Periodicals Directory
- Access to Global Online Research in Agriculture (AGORA)
- Electronic Journals Library
- Centre for Agriculture and Biosciences International (CABI)
- RefSeek
- Directory of Research Journal Indexing (DRJI)
- Hamdard University
- EBSCO A-Z
- OCLC- WorldCat
- Scholarsteer
- SWB online catalog
- Virtual Library of Biology (vifabio)
- Publons
- Geneva Foundation for Medical Education and Research
- Euro Pub
- Google Scholar
Useful Links
Share This Page
Journal Flyer
Open Access Journals
- Agri and Aquaculture
- Biochemistry
- Bioinformatics & Systems Biology
- Business & Management
- Chemistry
- Clinical Sciences
- Engineering
- Food & Nutrition
- General Science
- Genetics & Molecular Biology
- Immunology & Microbiology
- Medical Sciences
- Neuroscience & Psychology
- Nursing & Health Care
- Pharmaceutical Sciences
Research Article - (2025) Volume 16, Issue 1
Screening of Brown Spot (Bipolaris oryzae) Disease Resistant Lowland Rice (Oryza sativa L.) Genotypes at Fogera, Ethiopia
Muluadam Berhan1*, Merkuz Abera2 and Birhanu Bekele32Department of Agricultural Science, College of Agriculture and Environmental Sciences, Bahir Dar University, Bahir Dar, Ethiopia
3Department of Agriculture and Environmental Science, Ethiopian Institute of Agricultural Research (EIAR), Ambo Agricultural Research Center, Ambo, Ethiopia
Received: 12-Dec-2023, Manuscript No. JPPM-23-24328; Editor assigned: 14-Dec-2023, Pre QC No. JPPM-23-24328 (PQ); Reviewed: 28-Dec-2023, QC No. JPPM-23-24328; Revised: 22-Jan-2025, Manuscript No. JPPM-23-24328 (R); Published: 29-Jan-2025, DOI: 10.35248/2157-7471.25.16.742
Abstract
Rice (Oryzae sativa L.) is one of the most important cereal crops on which an ever-increasing population is dependent for food globally. However, constraints such as infectious diseases; brown spot transmitted by seed and wind reduced its production and productivity. This study was, therefore, conducted with the aim of screening of rice resistant lowland rice pipelines under natural infestation rain-fed conditions in Fogera plains of Amhara region, Ethiopia. A total of forty-nine lines were screened for their resistance against brown spot in the field with a simple lattice design including two susceptible varieties namely, X-Jigna and Gumara, and two resistant varieties, Shaga and Wanzaye. Sixteen genotypes showed highly resistant reactions for Bipolaris oryzae, and six of them including susceptible checks were highly susceptible. Amongst the highly resistant genotypes, Scrid037-4-2-2-5-2, Shaga, scrid019-1-1-1-1-2, and Fengdao 23 genotypes provided the maximum grain yield, respectively. Therefore, Scrid037-4-2-2-5-2 (8693 kg/ha), Shaga (8184.50 kg/ha), scrid019-1-1-1-1-2 (7345.50 kg/ha), Fengdao 23 (7126.7 kg/ha), and FOFIFA 167 (6895.60 kg/ha) genotypes are recommended in the management of Bipolaris oryzae and used as sources of resistance for further breeding programs. However, it is advised to identify inherent resistance genes of the above lines in combination with the pathogen genetic characteristics for fruitful management recommendations.
Keywords
AUDPC; Bipolaris oryzae; Disease severity; Genotypes; Morphological characterization
Introduction
Rice (Oryza sativa L.) is an important staple food crop for the people of this planet. It is also a vital food security commodity in Ethiopia, and its growth has brought about major changes in farmers' livelihoods, creating job opportunities for a large number of people across different parts of the country. In Fogera plain of Amhara region, rice plays an important role in abating the problem of food insecurity of the farming community and is consumed as enjera, tela, and bread. The global rice production forecast has also been raised by 10.4 million tons, putting it 2.1 percent higher than the previous year's estimate of 502.8 million tons.
However, biotic, abiotic (salinity, water stress, temperature, soil nutrient imbalance, etc.), technical, and socioeconomic factors alone, or in combination, restrict rice adoption to improved technologies and create hurdles to obtain higher potential yields. The presence of diseases, insects, and weeds infestation and lack of resistant rice varieties have been decreased the yield of rice and its quality in Ethiopia. In rice production, diseases caused by fungi such as rice blast, brown spot, and sheath rot are major drawbacks and result in losses in the quantity and quality of the harvested products.
Bipolaris oryzae (Breda de Haan) Shoemaker is the second economically important disease next to blast. Brown spot is soil, seed, and air born disease which causes both quantitative and qualitative losses. Rice brown spot causes losses of rice yield due to poor germination of seeds, infection of leaves, and reduction of leaf area for photosynthesis. It has been reported to have a widespread distribution in all rice-growing areas of the world. Temperature (24-30ÃÂ?°C) and relative humidity (more than 90%) have a significant role for the disease development.
In the rice protection of Ethiopia, studies to determine the status of rice diseases revealed that blast, brown spot, sheath rot, sheath blight, rice yellow mottle virus, and sheath brown spot were important in this order. The result of these studies reported that brown spot prevalence, incidence, and severity were 34%, 40.25%, and 8.57%, respectively. In addition, fungicides and varieties were screened for brown spot disease in the upland rice ecosystem.
A yield reduction caused by brown spot has been reported from 6-90% in Asia and 50-90% was recorded in Bengal (India), and its outbreak in 1942 resulted in the death of two million people. Depending on the nature of the disease, stage of plant growth at infection, variety tolerance, management, and weather conditions, the estimated losses can vary from 1-100%. Based on the survey result done, the brown spot is the second most yield reducer next to blast amongst rice diseases today in Ethiopia, and its severity was 14.4% in Fogera plain.
Amongst many specific methods of brown spot management, use of host plant resistance, proper crop nutrition, avoidance of water stress, planting disease-free seeds, and fungicidal spray are some preferable options. Plant resistance is the most effective and desirable disease control method in terms of economics and ensuring a safe environment. There are considerable differences in susceptibility to brown spot among rice varieties, and it needs to evaluate proven varieties and genotypes for their reaction to the disease in the various agroecological zones of rice.
Now days, development of brown spot management options in Ethiopian rice production are the top priorities. Since the introduction and expansion of rice are recent, during the Derg regime in 1991, the research system did not bring an expected improvement in brown spot management [1]. The primary step is the development of resistant genotypes, and this study founded a base to address brown spot problems in the riceproducing areas. Therefore, this study was aimed to screen and develop brown spot disease resistant lowland rice genotypes/ pipelines under rain fed conditions.
Materials and Methods
Description of the study area
The field experiment was conducted at Fogera National Rice Research and Training Center (FNRRTC) experimental site, inFogera district, South Gondar administrative zone, Amhara region of Ethiopia (Figure 1). The center is located at about 610 km from Addis Ababa and 55 km from Bahir Dar to the north. Geographically the experimental site is positioned at a latitude of 11°54′26.4′′ and longitude of 37°41′08.2′′ with an altitude of 1804 meter above sea level and it receives an average annual rainfall of 1230 mm. The mean minimum and maximum temperatures of the area are 12 and 28°C, respectively. The ecology and type of rice cultivation practiced in Fogera plain is categorized as rain-fed lowland rice culture. The soil is brown clay (vertisol) rich in underground water and is depleted because of monocropping.

Figure 1: Map of experimental site.
Experimental materials and design
The experiment was conducted in an anaerobic rice ecosystem under rain-fed conditions. The treatments were arranged in a simple lattice design. The plot size was 2 meters by 1.2 meters (2.4 m2) and the block size was 17.4 m × 1.2 m (20.88 m2). The net plot size was 2 m × 0.8 m (1.6 m2) and four harvestable rows were available in each genotype. Each block was partitioned into seven plots and 49 genotypes were arranged in two replications. Whereas the total experimental area was 23.8 m × 17.4 m (414.12 m2). A spacing of 0.5 meters was used between plots and blocks, while the spacing between replications was one meter.
In the experiment, forty (40) lowland genotypes and nine lowland released varieties were evaluated; of which, two were resistant varieties (Wanzaye and Shaga) as well as the other two were susceptible varieties (Gumara and X-Jigina) (Table 1). XJigina variety was used as spreader row and sown by drilling in 20 cm interval. Randomization was held independently for each block by which treatments were assigned completely at random as described by Gomez and Gomez [2].
| No. | Code | Genotype | Source of genotypes | Other information | |
|---|---|---|---|---|---|
| Released by | Released year | ||||
| 1 | ER2012 1 | Edirne | Africa Rice | HE-Lowland PVT-CT 2016 | |
| 2 | ER2012 2 | Suitou Chuukanbohon Nou 11 | Africa Rice | HE-Lowland PVT-CT 2016 | |
| 3 | ER2012 3 | Saegyejinmi | Africa Rice | HE-Lowland PVT-CT 2016 | |
| 4 | ER2012 4 | Lunyuki | Africa Rice | HE-Lowland PVT-CT 2016 | |
| 5 | ER2012 5 | Hangamchal | Africa Rice | HE-Lowland PVT-CT 2016 | |
| 6 | ER2012 6 | SCRID090-164-2-1-2-1 | Africa Rice | HE-Lowland PVT-CT 2016 | |
| 7 | ER2012 7 | SCRID091-18-1-5-4-4 | Africa Rice | HE-Lowland PVT-CT 2016 | |
| 8 | ER2012 8 | IR 83377-B-B-93-3 | IRRI | LR NVT-MS 2015/2016 | |
| 9 | ER2012 9 | FOFIFA 167 | Africa Rice | LR NVT-CT 2015/2016 | |
| 10 | ER2012 10 | scrid014-1-1-1-1 | Africa Rice | LR NVT-CT 2015/2016 | |
| 11 | ER2012 11 | scrid019-1-1-1-1-2 | Africa Rice | LR NVT-CT 2015/2016 | |
| 12 | ER2012 12 | Scrid037-4-2-2-5-2 | Africa Rice | LR NVT-CT 2015/2016 | |
| 13 | ER2012 13 | SCRID090-177-2-4-3-4 | Africa Rice | HE-Lowland PVT-CT 2016 | |
| 14 | ER2012 14 | IR 83222-F11-200 | IRRI | LR NVT-ES 2015/2016 | |
| 15 | ER2012 15 | IR 83222-F11-66 | IRRI | LR NVT-ES 2015/2016 | |
| 16 | ER2012 16 | IR76999-52-1-3-2 | IRRI | LR NVT-ES 2015/2016 | |
| 17 | ER2012 17 | IR 75518-18-1-2-B | IRRI | LR NVT-MS 2015/2016 | |
| 18 | ER2012 18 | CHOMRONG | China | LRGSR NVT-CT 2016 | |
| 19 | ER2012 19 | IR 72768-8-1-1 | IRRI | LR NVT-MS 2015/2016 | |
| 20 | ER2012 20 | YUNJING 23 | IRRI | LR NVT-ES 2015/2016 | |
| 21 | ER2012 21 | YUNLU N0.33 | IRRI | LR NVT-MS 2015/2016 | |
| 22 | ER2012 22 | WAS 161-B-6-B-1 (NERICA-L-36) | IRRI | LR NVT-MS 2015/2016 | |
| 23 | ER2012 23 | Yungeng 44 | China | LRGSR NVT-CT 2016 | |
| 24 | ER2012 24 | Yungeng 45 | China | LRGSR NVT-CT 2016 | |
| 25 | ER2012 25 | Fengdao 23 | China | LRGSR NVT-CT 2016 | |
| 26 | ER2012 26 | Songgeng9 | China | LRGSR NVT-CT 2016 | |
| 27 | ER2012 27 | P-28 | China | LRGSR NVT-CT 2016 | |
| 28 | ER2012 28 | IR 83249-F9-29 | IRRI | LR NVT-ES 2015/2016 | |
| 29 | ER2012 29 | Namcheobyeo | Africa Rice | HE-Lowland PVT-CT 2016 | |
| 30 | ER2012 30 | WAB376-B-10-H3 | IRRI | LR NVT-ES 2015/2016 | |
| 31 | ER2012 31 | IR 83372-B-B-115-4 | IRRI | LR NVT-MS 2015/2016 | |
| 32 | ER2012 32 | FOFIFA 172 | Africa Rice | LR NVT-CT 2015/2016 | |
| 33 | ER2012 33 | Samgangbyeo | Africa Rice | HE-Lowland PVT-CT 2016 | |
| 34 | ER2012 34 | Tunca | Africa Rice | HE-Lowland PVT-CT 2016 | |
| 35 | ER2012 35 | SCRID091-20-2-2-4-4 | Africa Rice | HE-Lowland PVT-CT 2016 | |
| 36 | ER2012 36 | IR80420-B-22-2 | IRRI | LR NVT-MS 2015/2016 | |
| 37 | ER2012 37 | IR 83222-F11-167 | IRRI | LR NVT-ES 2015/2016 | |
| 38 | ER2012 38 | Osmancik-97 | Africa Rice | HE-Lowland PVT-CT 2016 | |
| 39 | ER2012 39 | SCRID090-60-1-1-2-4 | Africa Rice | HE-Lowland PVT-CT 2016 | |
| 40 | ER2012 40 | SCRID091-20-3-1-3-4 | Africa Rice | HE-Lowland PVT-CT 2016 | |
| 41 | ER2012 R1 | Wanzaye | FNRRTC | 2017 | |
| 42 | ER2012 R2 | Erib | FNRRTC | 2017 | |
| 43 | ER2012 R3 | Idget | Adet ARC | 2011 | |
| 44 | ER2012 R4 | Abay | FNRRTC | 2017 | |
| 45 | ER2012 R5 | Gumara | Adet ARC | 1999 | |
| 46 | ER2012 R6 | Shaga | FNRRTC | 2017 | |
| 47 | ER2012 R7 | Hiber | Adet ARC | 2013 | |
| 48 | ER2012 R8 | Fogera 2 | FNRRTC | 2016 | |
| 49 | ER2012 R9 | X-jigna | S/Korea | Early 1980th | |
Table 1: Description of 49 lowland rice genotypes used for the field experiment.
Experimental procedures
The experiment was done in the 2020/2021 cropping season. The genotypes were planted at earlier identified hot spot area by assigning treatments randomly to each plot. A relatively susceptible variety, X-Jigina was sown as a disease spreader row to disseminate airborne spores by wind since the pathogen can spread from plant to plant in the field or from field to field. The seed rate for each genotype was 80 kg/ha; 13 g/plot and sown by drilling method. The recommended fertilizer rates used were 121 kg/ha for NPS and 350 kg/ha for urea. On the other hand, ten plants of each genotype were randomly selected from the middle two rows of each plot, tagged by red threads, and later used for disease data collection. Other crop management practices such as land preparation, weeding, and time of fertilizer application were done according to research recommendations [3].
Data collection
Disease data collection: All sampled plants symptom of Bipolaris oryzae were scored for disease severity and incidence which includes leaf, sheath, and panicle. Data collection was carried out at seven days’ intervals after the appearance of the disease symptom in which tagged plants within each plot were visually evaluated for percent foliar infection (severity). Typical symptoms considered are; small, oval, or circular and dark brown leaf spots, while larger lesions usually have the same color on the edges but have a pale, usually grayish center. Most spots have a light-yellow halo around the outer edge.
Disease data were recorded five times in the growing season following the Standard Evaluation System (SES) of IRRI as given in Table 2. The 0-9 severity rating scale developed by IRRI was adopted [4]. The disease parameters considered were disease severity, apparent infection rate (r-value), Brown Spot-Severity Index (BSI), and Area under Disease Progress Curve (AUDPC).
| Scale | % of leaf area diseased |
|---|---|
| 0 | No disease observed |
| 1 | <1% |
| 2 | 1-3% |
| 3 | 4-5% |
| 4 | 6-10% |
| 5 | 11-15% |
| 6 | 16-25% |
| 7 | 26-50% |
| 8 | 51-75% |
| 9 | 76-100% |
Table 2: A standard disease rating scale for scoring brown spot severity.
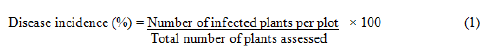
Disease incidence: It is the percentage of diseased plants or parts in the sample or population of plants. It can be the proportion or percentage of diseased leaves in a plant, diseased stalks, or tiller or diseased seedlings in a field. It was calculated using the following formula.
Disease severity: it is the percentage of relevant host tissues or organs covered by symptoms or lesions or damaged by the disease. Severity results from the number and size of the lesions. It was computed using the formula below.

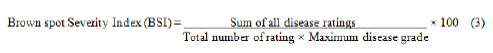
Brown Spot-Severity Index (BSI): Disease severity was recorded on pre-tagged ten individual plants and the numerical values were then used to calculate the percent infection. The severity grades must be converted into Percentage Severity Index (PSI) for ease of analysis according to the formula by Wheeler. The formula used was:
Apparent infection rate (r-value)
The disease progress rate was calculated using the appropriate model for each treatment. The apparent infection rate, expressed in disease units per day, was calculated from disease severity data transformed to logistic model. It was used to assess the first and the last infection periods for each genotype with age. The transformed values were regress over time (as days after sowing). The rate at which rice brown spot increased (r-value) was estimated using the following formula proposed by van der Plank [6].
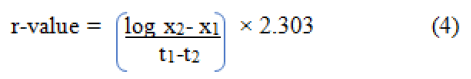
Where t1 and t2 are the initial and final days of assessment and x1 and x2 are the disease severity on the initial and final days of assessment.
Area under Disease Progress Curve (AUDPC): The effects of disease severity on rice genotypes along a period can be evaluated using the AUDPC. AUDPC gives a quantitative measure of disease development and intensity, and it helps to categorize genotypes under different levels of resistance (Table 3). The disease severity on rice variety was integrated into an Area under Disease Progress Curve (AUDPC). Disease scoring was done by using a standard disease rating scale of 0 to 9 (Table 2). It needs to have repeated disease assessments to calculate the Area under Disease Progress Curve (AUDPC) and it enables to summarize the progress of disease severity along a time. It was calculated for each plot from BSI according to.

Where,
Yi=Brown leaf spot disease severity on the ith date
Ti=Date on which the disease was scored
n=Numbers of dates on which disease was scored
The mean AUDPC value was used to categorize genotypes as resistant and susceptible as described in Table 3.
| Mean AUDPC | Category | Symbol |
|---|---|---|
| >340 | Highly susceptible | HS |
| 260-340 | Susceptible | S |
| 180-259 | Moderately resistant | MR |
| 180-50 | Resistant | R |
| <50 | Highly resistant | HR |
Table 3: Categories of resistant and susceptible genotypes against brown spot.
Relative yield loss (%): The relative loss in yield of each treatment was determined as the percentage of that of protected plots of the experiment. Yield loss was calculated based on the formula below:
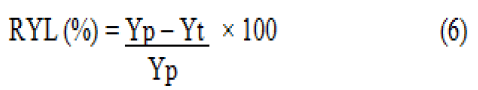
Where,
RYL=Relative yield loss in percent.
Yp=Yield from the maximum protected plots.
Yt =Yield from other plots.
Crop parameters
Data on all agronomic, morphological, and grain quality traits were collected based on a standard evaluation system established for rice-on-rice descriptors of IRRI and Bioversity International, et al. [9].
Phenotypic Acceptability (PAcp): The score was done through visual observation to know the overall acceptability of the variety in the plot. The scale, excellent=1, good=3, fair=5, poor=7 and unacceptable=9 was used.
Panicle length (cm): An average of five representative plants length of the main axis of the panicle was measured from the panicle base to the tip with the standard of semi-dwarf (lowland: less than 110 cm), intermediate (lowland: 110-130 cm) and tall (lowland: more than 130 cm). The stage of measurement is during the ripening stage.
1000-grain weight (g): Random sample of 1000 well-developed, whole grains, dried to 13% moisture content were weighed by precision sensitive balance for each genotype and taken in gram.
Grain yield (kg/ha): The grain harvested from four harvestable rows of each plot was weighted by sensitive balance. The final grain yield was adjusted at 14% moisture level by using the following formula.
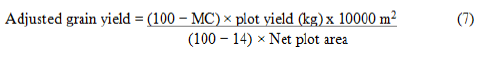
Where;
MC=Moisture content of grain in percentage
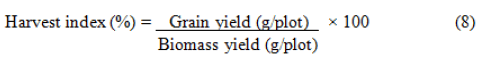
Harvest index (%): It is the percentage of the grain yield from the biological yield or biomass yield. It is calculated as follows:
Climate data: The 2020 cropping season climate data such as minimum and maximum temperature and annual rainfall were recorded on monthly basis. The weather condition had a significant effect on the occurrence and severity of rice brown spot. The rainfall distribution of the experimental site fluctuated and the onset of it was early (May). The maximum amount of rainfall was recorded during June (483.7 mm), July (471.2 mm) and August (453.8 mm), respectively (Figure 2). The presence of high rainfall early in sowing time harmed the productivity of rice. It was also ceased early in the middle of September and as a result of this supplementary irrigation was applied.
The maximum temperature was recorded in November (29.2°C), October (28.06°C), September (27.67°C) and August (25.56°C) cropping months of the plant growth stages and it was ideal for the occurrence, development, and spread of brown spot. The pathogen conidial growth and germination is formed between the temperature range 18-30°C and high relative humidity >85%.

Figure 2: Rainfall, maximum and minimum temperature of the study area, 2020. Note: RF: Rainfall, Max. T: Maximum Temperature, Min. T: Minimum Temperature.
Data analysis
Analysis of variance: Field data obtained from the experiment were subjected to Analysis of Variance (ANOVA) and means were separated and compared using Fischer’s Least Significant Difference (F-LSD) test at a 5% probability level. The data collected from the field was arranged using Microsoft excel 2016 and data on disease severity were transformed using logistic transformation before statistical analysis. Finally, it is analyzed by Statistical Analysis Software (SAS) version 9.4 at 5% least significance level. A simple correlation was made for estimated disease parameters (final percent severity index, AUDPC, and apparent infection rate) and agronomic parameters (days to maturity, number of plants per meter, number of filled grains per panicle, number of unfilled grains per panicle, thousandgrain weight, grain yield, dry biomass yield, and harvest index).
Cluster analysis: In cluster analysis, 49 genotypes were grouped into four clusters for all agronomic and epidemiological characters. The cluster analysis was done based on the distance of genotypes for agronomic an epidemiological parameter.
Results and Discussion
Resistance level of genotypes and AUDPC value
The tested lowland rice genotypes showed a highly significant variation (P<0.0001) in mean values of AUDPC. All genotypes were grouped into five categories of resistance. Of 49 genotypes screened, 16, 12 and 11 of them were highly resistant (mean value: <50), resistant (mean value: 51-180) and moderately resistant (mean AUDPC value: 180-259), respectively. Whereas the other four (IR 72768-8-1-1, IR 75518-18-1-2-B, scrid014-1-1-1-1 and SCRID091-20-2-2-4-4 were susceptible (mean AUDPC value: 260-340) and genotypes viz. Gumara, SCRID091-20-3-1-3-4, Lunyuki, IR76999-52-1-3-2, SCRID091-18-1-5-4-4 and X-jigna were highly susceptible (mean AUDPC value: >340) for B. oryzae (Table 4).
Based on mean AUDPC value, Aryal, et al. had similarly grouped 20 rice genotypes into five resistant categories namely; highly resistant (mean AUDPC value: 0-200), resistant (mean AUDPC value: 201-400), moderately resistant (mean AUDPC value: 401-600), susceptible (mean AUDPC value: 601-800) and highly susceptible (mean AUDPC value: 801-1000) [10]. Dhungana, et al. (2020) had also grouped 20 genotypes into five mean AUDPC value resistant categories using the range of mean values from 0-50 (highly resistant), 51-100 (resistant), 101-150 (moderately resistant), 151-200 (susceptible) and >200 (highly susceptible). Furthermore, from 244 rice germplasm screened for a brown spot by Hosagoudar, et al. three were resistant, 70 were moderately resistant, 137 were moderately susceptible, 27 were susceptible and six of them were highly susceptible [11]. As to the findings of Yosep, et al. amongst 24 genotypes six genotypes were moderately resistant, four genotypes were moderately susceptible and 14 genotypes were susceptible to brown spot [12].
| S. no. | Genotypes | Reaction type | Mean of AUDPC value | PAcp |
|---|---|---|---|---|
| 1 | Edirne | HR | 0.00l | Fair |
| 2 | Suitou chuukanbohon nou 11 | HR | 0.00l | Excellent |
| 3 | Saegyejinmi | R | 161.35g-k | Fair |
| 4 | Lunyuki | HS | 435.05b-d | Poor |
| 5 | Hangamchal | MR | 225.23e-j | Excellent |
| 6 | SCRID090-164-2-1-2-1 | MR | 187.78f-j | Good |
| 7 | SCRID091-18-1-5-4-4 | HS | 538.65b | Poor |
| 8 | IR 83377-B-B-93-3 | R | 154.88g-l | Unacceptable |
| 9 | FOFIFA 167 | HR | 0.00l | Good |
| 10 | scrid014-1-1-1-1 | S | 299.43c-g | Fair |
| 11 | scrid019-1-1-1-1-2 | HR | 0.00l | Excellent |
| 12 | Scrid037-4-2-2-5-2 | HR | 0.00l | Poor |
| 13 | SCRID090-177-2-4-3-4 | HR | 0.00l | Good |
| 14 | IR 83222-F11-200 | MR | 255.50e-i | Fair |
| 15 | IR 83222-F11-66 | R | 151.03g-k | Good |
| 16 | IR76999-52-1-3-2 | HS | 436.98bc | Poor |
| 17 | IR 75518-18-1-2-B | S | 277.73d-h | Poor |
| 18 | CHOMRONG | MR | 212.10e-j | Fair |
| 19 | IR 72768-8-1-1 | S | 272.78e-h | Unacceptable |
| 20 | YUNJING 23 | MR | 246.93e-i | Poor |
| 21 | YUNLU N0.33 | MR | 195.13f-j | Excellent |
| 22 | WAS 161-B-6-B-1 (NERICA-L-36) | R | 71.75j-l | Unacceptable |
| 23 | Yungeng 44 | HR | 48.83kl | Good |
| 24 | Yungeng 45 | HR | 0.00l | Good |
| 25 | Fengdao 23 | MR | 198.10f-j | Good |
| 26 | Songgeng9 | HR | 0.00l | Good |
| 27 | P-28 | R | 81.38j-l | Good |
| 28 | IR 83249-F9-29 | R | 107.98i-l | Fair |
| 29 | Namcheobyeo | MR | 252.88e-i | Unacceptable |
| 30 | WAB376-B-10-H3 | MR | 203.00f-j | Good |
| 31 | IR 83372-B-B-115-4 | HR | 0.00l | Fair |
| 32 | FOFIFA 172 | HR | 0.00l | Good |
| 33 | Samgangbyeo | R | 132.48h-l | Excellent |
| 34 | Tunca | R | 111.48i-l | Good |
| 35 | SCRID091-20-2-2-4-4 | S | 300.30c-g | Good |
| 36 | IR80420-B-22-2 | MR | 217.70e-j | Unacceptable |
| 37 | IR 83222-F11-167 | MR | 184.45f-j | Unacceptable |
| 38 | Osmancik-97 | R | 122.85h-l | Good |
| 39 | SCRID090-60-1-1-2-4 | R | 156.80g-k | Fair |
| 40 | SCRID091-20-3-1-3-4 | HS | 367.85s | Good |
| 41 | Wanzaye | HR | 0.00l | Excellent |
| 42 | Erib | HR | 0.00l | Excellent |
| 43 | Idget | R | 162.58g-k | Excellent |
| 44 | Abay | HR | 0.00l | Fair |
| 45 | Gumara | HS | 342.13c-f | Fair |
| 46 | Shaga | HR | 0.00l | Excellent |
| 47 | Hiber | HR | 0.00l | Good |
| 48 | Fogera 2 | R | 76.30j-l | Poor |
| 49 | X-jigna | HS | 1645.35a | Excellent |
| Mean | 180.29 | |||
| SEM | 36.27 | |||
| CV | 43.42 | |||
| LSD | 162.98 | |||
| P-value | 0.0001 | |||
| Note: AUDPC: Area under Disease Progress Curve; CV: Coefficient of Variation; HR: Highly Resistant; HS: Highly Susceptible; LSD: Least Significance Difference; MR: Moderately Resistant; MS: Moderately Susceptible; PAcp: Phenotypic Acceptability; P-value: The Probability at α=0.05 level; R: Resistant; S: Susceptible; SEM: Standard Error of Mean | ||||
Table 4: The resistance level of lowland genotypes based on mean AUDPC values.
Brown spot severity index
The result showed that the tested genotypes had a variable response and a highly significant difference (p<0.0001) concerning epidemiological parameters considered. Analyzed disease data revealed that the percent disease index of all genotypes ranged between 0 and 87.75%. The highest disease severity index (87.75%) was recorded on the susceptible variety named ‘X-Jigna’, followed by Lunyuki (36.55%), IR76999-52-1-3-2 (33.65%), SCRID091-18-1-5-4-4 (32.95%) and SCRID091-20-3-1-3-4 (30.6%).
Of 49 genotypes tested, Edirne, Suitou Chuukanbohon Nou 11, FOFIFA 167, scrid019-1-1-1-1-2, Scrid037-4-2-2-5-2, SCRID090-177-2-4-3-4, Yungeng 45, Songgeng9, IR 83372-BB- 115-4, FOFIFA 172, Wanzaye, Erib, Abay, Shaga and Hiber showed 0% severity index. Idget (16.45%), Osmancik-97 (13.5%), IR 83377-B-B-93-3 (13.4%), Tunca (12.6%), Samgangbyeo (12.55%), IR 83222-F11-66 (12%), SCRID090-60-1-1-2-4 (11.7%), Saegyejinmi (10.45%), Fogera 2 (9.4%), IR 83249-F9-29 (8.25%), P-28 (7.9%) and WAS 161-B-6-B-1 (NERICA-L-36) (6%) were resistant. Similarly, the susceptible genotypes SCRID091-20-2-2-4-4, scrid014-1-1-1-1, IR 75518-18-1-2-B, and IR 72768-8-1-1 showed the severity index score 25%, 24.8%, 24.35% and 20.25%, respectively, while severity index of Lunyuki (36.55%), SCRID091-18-1-5-4-4 (32.95%), IR76999-52-1-3-2 (33.65%), SCRID091-20-3-1-3-4 (30.6%), Gumara (20.5%) an X-jigna (87.85%) was higher than others (Tables 4 and 5).
The results of this experiment were in line with Mwendo, et al. and Dariush, et al. report [13]. Of 100 germplasm screened by Mwendo, et al. the reaction of 52 (52%) lines were grouped as resistant, 27 (27%) lines as moderately resistant, 18 lines (18%) as highly resistant, and 3 (3%) lines including the check as susceptible. Moreover, the results of Dariush, et al. indicated that the response of 95 genotypes for brown spot had shown resistant, moderately resistant, and moderately susceptible reactions. Among 95 genotypes tested, 13 (13.68%) exhibited Resistant (R) responses, 42 (44.21%) Moderately Resistant (MR), and 40 (42.10%) were found to be Moderately Susceptible (MS).
| S. no. | Genotypes | Epidemiological parameters | |
|---|---|---|---|
| BSI (%) | r-value | ||
| 1 | Edirne | 0.00o | 0.00k |
| 2 | Suitou Chuukanbohon Nou 11 | 0.00o | 0.00k |
| 3 | Saegyejinmi | 10.45j-n | 0.07hi |
| 4 | Lunyuki | 36.55b | 0.11bc |
| 5 | Hangamchal | 16.35e-l | 0.09fg |
| 6 | SCRID090-164-2-1-2-1 | 18.90e-j | 0.10d-f |
| 7 | SCRID091-18-1-5-4-4 | 32.95bc | 0.10c-e |
| 8 | IR 83377-B-B-93-3 | 13.40h-n | 0.08gh |
| 9 | FOFIFA 167 | 0.00o | 0.00k |
| 10 | scrid014-1-1-1-1 | 24.80c-f | 0.10c-e |
| 11 | scrid019-1-1-1-1-2 | 0.00o | 0.00k |
| 12 | Scrid037-4-2-2-5-2 | 0.00o | 0.00k |
| 13 | SCRID090-177-2-4-3-4 | 0.00o | 0.00k |
| 14 | IR 83222-F11-200 | 22.70d-h | 0.10c-e |
| 15 | IR 83222-F11-66 | 12.00i-n | 0.08gh |
| 16 | IR76999-52-1-3-2 | 33.65bc | 0.12b |
| 17 | IR 75518-18-1-2-B | 24.35c-g | 0.11b-d |
| 18 | CHOMRONG | 16.30e-l | 0.09e-g |
| 19 | IR 72768-8-1-1 | 20.25e-i | 0.10d-f |
| 20 | YUNJING 23 | 15.15g-m | 0.09fg |
| 21 | YUNLU N0.33 | 15.35f-m | 0.09e-g |
| 22 | WAS 161-B-6-B-1 (NERICA-L-36) | 6.00m-o | 0.06ij |
| 23 | Yungeng 44 | 5.05no | 0.06j |
| 24 | Yungeng 45 | 0.00o | 0.00k |
| 25 | Fengdao 23 | 12.70i-n | 0.08gh |
| 26 | Songgeng9 | 0.00o | 0.00k |
| 27 | P-28 | 7.90l-o | 0.07hi |
| 28 | IR 83249-F9-29 | 8.25l-o | 0.07hi |
| 29 | Namcheobyeo | 20.15e-i | 0.10c-e |
| 30 | WAB376-B-10-H3 | 17.90e-k | 0.09e-g |
| 31 | IR 83372-B-B-115-4 | 0.00o | 0.00k |
| 32 | FOFIFA 172 | 0.00o | 0.00k |
| 33 | Samgangbyeo | 12.55i-n | 0.08gh |
| 34 | Tunca | 12.60i-n | 0.08gh |
| 35 | SCRID091-20-2-2-4-4 | 25.00c-e | 0.10c-e |
| 36 | IR80420-B-22-2 | 18.60e-k | 0.09e-g |
| 37 | IR 83222-F11-167 | 13.75h-n | 0.08gh |
| 38 | Osmancik-97 | 13.50h-n | 0.08gh |
| 39 | SCRID090-60-1-1-2-4 | 11.70i-n | 0.07hi |
| 40 | SCRID091-20-3-1-3-4 | 30.60b-d | 0.11bc |
| 41 | Wanzaye | 0.00o | 0.00k |
| 42 | Erib | 0.00o | 0.00k |
| 43 | Idget | 16.45e-l | 0.09e-g |
| 44 | Abay | 0.00o | 0.00k |
| 45 | Gumara | 20.05e-i | 0.09e-g |
| 46 | Shaga | 0.00o | 0.00k |
| 47 | Hiber | 0.00o | 0.00k |
| 48 | Fogera 2 | 9.40k-o | 0.07hi |
| 49 | X-jigna | 87.85a | 0.14a |
| Mean | 13.53 | 0.06 | |
| SEM | 2.14 | 0.0062 | |
| CV | 34.53 | 10.45 | |
| LSD | 9.48 | 0.013 | |
| P-value | <0.0001 | <0.0001 | |
| Note: BSI: Brown Spot Severity Index; CV: Coefficient of Variation; LSD: Least Significance Difference; r-value: Apparent Infection Rate; P-value: The Probability at α=0.05 level: SEM: Standard Error of Mean | |||
Table 5: The reaction of rice genotypes to brown spot at Fogera, 2019/2020 cropping season.
Apparent infection rate of Bipolaris oryzae (r-value)
The disease progress was slightly varied initially (tillering stage) among tested genotypes and increased gradually (flowering stage) over time, to which the variation was highly significant (P<0.0001). The highest apparent infection rate (r-value) was recorded on susceptible check (X-Jigna) (0.14) variety and other tested genotypes such as IR76999-52-1-3-2 (0.12), SCRID091-20-3-1-3-4 (0.11) and Lunyuki (0.11). The other susceptible check (Gumara) r-value was 0.09. Fifteen highly resistant lines had zero r-values and 11 resistant screened lines showed an apparent infection rate of 0.06 to 0.09. While the disease progress rate of 13 moderately resistant and 4 susceptible was from 0.08 to 0.1 and 0.1 to 0.11. The resistant checks apparent infection rate was also zero (Wanzaye and Shaga) (Table 5).
Apparent infection rates of all the tested genotypes ranged between 0 and 0.14, which is in agreement with findings (range: 0-0.1) reported by Dariush, et al. Dariush, et al. has been reported the range of r-value between 0 to 0.1 (moderately resistant: 0.019 to 0.02, moderately susceptible: >0.025 to <0.038, susceptible: 0.05 to 0.11). Similarly, results reported by Dhungana, et al. further substantiated findings of the present study in Ethiopia. In general, genotypes categorized as highly resistant and moderately resistant had the lowest disease infection rate, whereas susceptible and highly susceptible lines had infected highly over time (Table 5).
Relative yield loss
The findings revealed that the genotypes showed highly significant variation in grain yield loss. The variability in yield under disease-free and diseased conditions ranged from 5.85% to 85.66%. The lowest yield loss was mostly exhibited from genotypes suffering the lowest disease severity (0%), which were Scrid037-4-2-2-5-2 (0%), Shaga (5.85%), Scrid019-1-1-1-1-2 (15%), Yungeng 45 (23.66%), Suitou Chuukanbohon Nou 11 (24.99%), and SCRID090-177-2-4-3-4 (25.3%) (Table 6).
The highest yield loss was calculated from the highly susceptible genotypes such as Lunyuki, SCRID091-20-3-1-3-4 (58.68%), XJigina (56.37%), and Gumara (54.6%) as well as from susceptible genotypes, IR 72768-8-1-1 (60.21%) and scrid014-1-1-1-1 (52.23%). The highest yield loss was not only recorded from genotypes that were highly susceptible and susceptible. For instance, resistant genotypes, Fogera 2 (73.57%) and IR 83222- F11-66 (65.4%) and moderately resistant genotypes like Namcheobyeo (85.66%), IR 83222-F11-167 (61.4%), and YUNLU N0.33 (59.59%) showed high relative grain yield loss. Yield loss is not only determined by brown spot severity but also by tolerance of the genotypes to brown spot (Table 6). Hence, this probably resulted from the variation in yield genetic potential.
Similarly, Yosep, et al. has been screened 24 genotypes against brown spot disease. They reported that the highest yield loss (>45%) was obtained from highly severed genotypes (>30%, severity) (SBD-02, HK-07, WTN-21, HK-06, SBD-04, NGR-21, and MANU-04) which were classified as susceptible. Two moderately resistant genotypes had also high yield loss (>20%), approaching those of moderately susceptible genotype MGR-04 (MS-9) and susceptible genotype ADN-05 (S-2). Furthermore, a susceptible genotype (B13784C-MR-2-2-8-4-1-1-3-3) showed a much lower yield loss (11.48%) which was similar to moderately resistant genotypes. Finally, Yosep, et al. came to the same conclusion, stating that the magnitude of yield loss increase was not proportional to increasing disease severity, implying that genotypes have different yield loss responses to brown spot disease.
Grain yield and yield-related components
The analysis of variance revealed significant variation (p<0.0001) in agronomic and grain quality parameters measured such as grain yield, thousand-grain weight, number of filled and unfilled grains, and harvest index of the tested lowland rice genotypes. The plant height was varied significantly among the rice pipelines and ranged from 72 cm (WAS 161-B-6-B-1 (NERICAL- 36)) to 149.5 cm. SCRID091-18-1-5-4-4 genotype showed the maximum plant height (149.5 cm) and panicle length (26.0 cm). There was also a highly significant variation in panicle length among genotypes evaluated, the minimum measurement recorded was for genotype “P-28” (17.80 cm). Considering days to maturity, the genotype named Edirne (122 days) was recorded as the earliest mature followed by SCRID090-177-2-4-3-4 (138 days) and Wanzaye (138 days) (Table 6).
The highest numbers (157.40, 146.60, and 142.90) of grains per panicle were recorded on genotypes Yungeng 44, Yungeng 45, and Fengdao 23”, respectively, whereas the lowest numbers of unfilled grain per panicle were, in order, found in cultivars Idiget (3.20), Songgeng 9 (3.10) and FOFIFA 167 (2.90). However, the highest numbers of unfilled grains per panicle were obtained in Lunyuki genotypes (26.60), Gumara (24.30), and Erib (20.30). As shown in Table 6, the maximum grain yield obtained was from genotypes Scrid037-4-2-2-5-2 (8693 kg/ha), Shaga (8184.50 kg/ha), scrid019-1-1-1-1-2 (7345.50 kg/ha), and Fengdao 23 (7126.70 kg/ha) (Table 6).
On the other hand, the minimum grain yield was recorded for Namcheobyeo, Lunyuki, and WAS 161-B-6-B-1 (NERICA-L-36) with a weight of 1246.50 kg/ha, 1412.5 kg/ha, and 2296.70 kg/ha, respectively. The susceptible varieties, X-Jigna (3792.70 kg/ha) and Gumara (3946.60 kg/ha) produced minimum grain yield. Genotypes with the highest grain yield had the lowest disease severity and vice versa but not always true because moderately resistant genotypes such as YUNLU N0.33 gave minimum grain yield (3512.5 kg/ha). Pantha, et al. reported that genotypes Sabitri and Radha-4 with the highest grain yield had the least disease severity, whereas genotype Sankharika had the least grain yield due to the highest final disease severity (Table 6).
B. oryzae has a direct effect on the grain quality character (grain weight and grain number). Pantha, et al. described as B. oryzae causes a decline in yield by increasing the number of empty grains, reducing the number of grains per panicle and grain weight. The variation in grain weight was also highly significant (p<0.0001). The highest grain weight was measured in Gumara, Hiber, and Ediget varieties with the weight of 39.00, and 38.10 grams per 1000 seed, respectively, whereas the lowest weight resulted from Abay (25.25 g), Edirne (20.20 g), and IR 83377-BB- 93-3 (16.35 g) genotypes. Moreover, IR 83377-B-B-93-3 and Yungeng 44 gave the maximum harvest index, while the lowest index was produced by Lunyuki (13.73%), Namcheobyeo (12.65 %), and Wanzaye (11.66 %) lines. The analysis of variance for grain yield and thousand-grain weight carried out by Magar confirmed the results of this experiment since there was a highly significant difference in grain yield and thousand-grain weight among 14 rice varieties [14].
Grain yield (maximum: 5420 kg/ha and minimum: 2340 kg/ha) and tested grain weight (highest: 18.18 gm and lowest: 9.397 gm) was also varied significantly (P<0.0001) among twelve rice cultivars tested by Aryal, et al. According to Dariush, et al. filled grains per panicle, unfilled grain per panicle, and thousandgrain weight were ranged from 8.68 to 74.10, 7.13 to 64.45, and 16.7 to 30.6, respectively. Thousand-grain weight (ranged from 16.35 to 38.1) obtained in the present study was almost similar to what was reported by Dariush, et al. whereas there was variation in the number of filled grain per panicle (78.9 to 157.4) and unfilled grain per panicle (2.9 to 26.2). Furthermore, 20 rice genotypes evaluated by Pantha, et al. and Dhungana, et al. were similarly varied significantly in yield and yield attributes (thousand-grain yield and grain yield).
| S. no. | Genotypes | PH (cm) | PL (cm) | DM | NFGP | NUGP | TGW (g) | GY (kg/ha) | RYL (%) | HI (%) |
|---|---|---|---|---|---|---|---|---|---|---|
| 1 | Edirne | 85.5m-t | 18.3i-l | 122.00m | 105.20e-l | 5.70l-o | 20.20hi | 5901.40f-j | 32.11 | 55.68ab |
| 2 | Suitou Chuukanbohon Nou 11 | 98.0g-n | 19.6h-l | 139.50i-l | 112.70b-l | 5.10n-q | 35.20a-e | 6521.00c-f | 24.99 | 47.58a-e |
| 3 | Saegyejinmi | 74.0r-v | 18.7h-l | 142.50g-l | 94.50h-l | 4.10o-r | 30.90a-g | 4915.00l-n | 43.46 | 41.63b-g |
| 4 | Lunyuki | 108.0c-h | 20.3f-l | 144.50d-l | 102.20e-l | 26.20a | 31.05a-g | 1412.50w | 83.75 | 13.42k |
| 5 | Hangamchal | 96.0g-o | 19.6g-l | 139.00j-m | 126.60a-h | 11.50d-g | 32.45a-g | 6382.50d-h | 26.58 | 41.66b-g |
| 6 | SCRID090-164-2-1-2-1 | 115.5b-f | 18.9h-l | 139.00j-m | 106.70d-l | 9.60h-j | 36.70a-c | 5904.50f-j | 32.08 | 43.31a-f |
| 7 | SCRID091-18-1-5-4-4 | 149.5a | 26.0a | 141.50h-l | 121.80b-j | 10.00g-j | 33.05a-g | 5926.50f-j | 31.82 | 41.03b-h |
| 8 | IR 83377-B-B-93-3 | 74.0r-v | 20.2e-l | 150.50a-g | 87.70j-l | 7.10kl | 16.35i | 3753.00r-t | 56.83 | 33.19d-i |
| 9 | FOFIFA 167 | 117.5b-e | 18.1kl | 137.50k-m | 94.90h-l | 3.10r | 34.25a-e | 6895.60b-d | 20.68 | 45.35a-f |
| 10 | scrid014-1-1-1-1 | 121.5bc | 20.5c-k | 140.50i-l | 117.10b-k | 10.50f-i | 27.25d-h | 4152.40o-s | 52.23 | 44.16a-f |
| 11 | scrid019-1-1-1-1-2 | 111.0b-g | 19.8f-l | 140.50i-l | 119.30b-j | 9.90g-j | 31.20a-g | 7345.50b | 15.5 | 49.61a-d |
| 12 | Scrid037-4-2-2-5-2 | 121.0b-d | 19.0h-l | 141.50h-l | 141.20a-d | 8.50jk | 32.05a-g | 8693.00a | 0 | 44.83a-f |
| 13 | SCRID090-177-2-4-3-4 | 100.0f-m | 20.1e-l | 138.00k-m | 119.90b-j | 5.50l-p | 34.05a-f | 6493.50c-g | 25.3 | 46.19a-e |
| 14 | IR 83222-F11-200 | 76.5q-v | 18.8h-l | 147.00b-j | 93.20h-l | 4.10o-r | 30.95a-g | 4413.70n-r | 49.23 | 37.15c-h |
| 15 | IR 83222-F11-66 | 107.0c-h | 20.8c-i | 153.00a-d | 124.40a-i | 13.10d | 30.85a-g | 3007.50u | 65.4 | 23.16h-k |
| 16 | IR76999-52-1-3-2 | 102.5e-k | 20.1e-l | 151.00a-g | 123.60a-i | 3.70p-r | 34.85a-e | 5447.20i-l | 37.34 | 44.86a-f |
| 17 | IR 75518-18-1-2-B | 104.5e-j | 22.0b-g | 152.50a-e | 116.20b-k | 10.20f-j | 35.15a-e | 4549.50m-q | 47.66 | 32.64d-i |
| 18 | CHOMRONG | 126.0b | 22.4b-e | 141.50h-l | 96.80h-l | 3.50qr | 36.60a-c | 5956.50e-i | 31.48 | 46.29a-e |
| 19 | IR 72768-8-1-1 | 77.5p-v | 20.1e-l | 154.50a-c | 113.80b-l | 12.00d-f | 29.35c-g | 3458.70s-u | 60.21 | 30.75e-j |
| 20 | YUNJING 23 | 103.0e-k | 20.7c-j | 150.50a-g | 108.00c-l | 3.90o-r | 29.70b-g | 6040.50e-i | 30.51 | 39.19b-h |
| 21 | YUNLU N0.33 | 110.5b-g | 20.1e-l | 147.50b-j | 121.90b-j | 6.70k-n | 31.75a-g | 3512.50s-u | 59.59 | 30.98e-j |
| 22 | WAS 161-B-6-B-1 (NERICA-L-36) | 72.0t-v | 20.11e-l | 157.00a | 99.00g-l | 11.60d-g | 29.60c-g | 2296.70v | 73.58 | 16.85i-k |
| 23 | Yungeng 44 | 104.5e-j | 23.0bc | 152.00a-e | 157.40a | 5.20m-q | 29.35c-g | 5924.30f-j | 31.85 | 60.08a |
| 24 | Yungeng 45 | 101.5f-l | 22.4b-e | 151.50a-f | 146.60ab | 6.60kl | 33.45a-g | 6636.50c-e | 23.66 | 43.29a-f |
| 25 | Fengdao 23 | 95.5g-o | 20.4d-k | 150.50a-g | 142.90a-c | 6.30l-n | 37.35a-c | 7126.70bc | 18.02 | 54.35a-c |
| 26 | Songgeng9 | 90.5i-q | 19.1h-l | 150.50a-g | 134.90a-f | 2.90r | 32.65a-g | 6324.50d-h | 27.25 | 48.11a-e |
| 27 | P-28 | 88.0k-s | 17.8l | 144.00e-l | 108.70c-l | 9.00ij | 27.05e-h | 6838.00b-d | 21.34 | 45.91a-f |
| 28 | IR 83249-F9-29 | 81.0o-v | 19.5g-l | 143.00f-l | 115.70b-k | 11.90d-f | 34.65a-e | 5843.50f-k | 32.78 | 41.89b-g |
| 29 | Namcheobyeo | 71.5t-v | 18.9h-l | 155.50ab | 95.40h-l | 11.50d-g | 31.10a-g | 1246.50w | 85.66 | 12.33k |
| 30 | WAB376-B-10-H3 | 117.5b-e | 24.5ab | 149.50a-h | 115.70b-k | 15.90c | 37.15a-c | 6953.50b-d | 20.01 | 40.99b-h |
| 31 | IR 83372-B-B-115-4 | 102.5e-k | 22.2b-f | 145.50d-l | 113.60b-l | 4.40o-r | 30.90a-g | 4668.00m-p | 46.3 | 37.34c-h |
| 32 | FOFIFA 172 | 95.5g-o | 18.3i-l | 140.50m | 78.90l | 3.50qr | 36.50a-c | 5188.60k-m | 40.31 | 46.27a-e |
| 33 | Samgangbyeo | 105.5d-i | 20.5c-k | 145.00d-l | 131.90a-g | 3.70p-r | 36.85a-c | 5808.30g-k | 33.18 | 45.37a-f |
| 34 | Tunca | 93.0h-p | 21.7c-g | 139.00j-m | 112.80b-l | 11.10e-h | 36.20a-c | 6127.00e-i | 29.52 | 44.63a-f |
| 35 | SCRID091-20-2-2-4-4 | 103.5e-k | 21.0c-h | 139.00j-m | 123.30a-i | 12.40de | 34.35a-e | 4735.00m-p | 45.53 | 36.63c-h |
| 36 | IR80420-B-22-2 | 65.5v | 20.1e-k | 154.50a-c | 84.20kl | 6.90k-n | 31.25a-g | 4127.50p-s | 52.52 | 28.04f-k |
| 37 | IR 83222-F11-167 | 68.5uv | 19.1h-l | 151.00a-g | 87.30j-l | 6.80k-n | 29.45c-g | 3355.40tu | 61.4 | 36.94c-h |
| 38 | Osmancik-97 | 101.5f-l | 20.6c-k | 145.00d-l | 114.00b-k | 4.60o-r | 35.70a-d | 5244.80j-m | 39.67 | 43.13a-f |
| 39 | SCRID090-60-1-1-2-4 | 92.5h-p | 20.3e-l | 140.50n | 117.20b-k | 6.50l-n | 32.40a-g | 5844.20f-k | 32.77 | 46.76a-e |
| 40 | SCRID091-20-3-1-3-4 | 105.5d-i | 20.4d-k | 140.50i-l | 141.00a-d | 4.50o-r | 30.25b-g | 3591.70s-u | 58.68 | 43.83a-f |
| 41 | Wanzaye | 115.5b-f | 20.2e-l | 138.00k-m | 90.70i-l | 3.40qr | 37.00a-c | 6390.80d-h | 26.48 | 34.09d-i |
| 42 | Erib | 89.5j-r | 18.8h-l | 142.50g-l | 102.40e-l | 20.30b | 36.75a-c | 4836.50l-o | 44.36 | 35.01d-h |
| 43 | Idget | 97.5g-n | 20.9c-h | 140.50i-l | 105.70e-l | 3.20r | 38.10ab | 5628.50i-k | 35.25 | 43.96a-f |
| 44 | Abay | 86.5l-t | 20.0e-l | 148.00b-i | 99.90f-l | 6.50l-n | 25.25gh | 3667.00s-u | 57.82 | 31.86d-i |
| 45 | Gumara | 118.0b-e | 22.9b-d | 146.00c-k | 100.60f-l | 24.30a | 39.20a | 3946.60q-t | 54.6 | 24.44g-k |
| 46 | Shaga | 117.5b-e | 19.6g-l | 141.00h-l | 136.70a-e | 10.70e-i | 27.40d-h | 8184.50a | 5.85 | 47.63a-e |
| 47 | Hiber | 83.0n-t | 18.2j-l | 144.00e-l | 90.70i-l | 5.70l-o | 38.10ab | 5774.50h-k | 33.57 | 46.13a-e |
| 48 | Fogera 2 | 72.5s-v | 18.8h-l | 155.00ab | 93.80h-l | 7.00k-m | 25.65f-h | 2297.50v | 73.57 | 13.47jk |
| 49 | X-jigna | 100.5f-m | 20.1e-l | 141.50h-l | 92.10h-l | 13.10d | 32.30a-g | 3792.70r-t | 56.37 | 24.90g-k |
| Mean | 98.26 | 20.28 | 144.68 | 111.85 | 8.45 | 32.24 | 5164.93 | 38.91 | ||
| SEM | 2.49 | 0.23 | 0.99 | 2.56 | 0.74 | 0.64 | 234.2 | 1.54 | ||
| CV | 7.92 | 6.31 | 3.04 | 15.44 | 10.56 | 12.97 | 6.64 | 22.71 | ||
| LSD | 15.79 | 2.6 | 8.92 | 35.02 | 1.81 | 8.48 | 695.45 | 17.92 | ||
| P-value | <0.0001 | <0.0007 | < 0.0001 | <0.0098 | <0.0001 | <0.0184 | <0.0001 | <0.0016 | ||
| Note: CV: Coefficient of Variation; DM: Days to Maturity; GY (kg/ha): Grain Yield in kilogram per hectare; HI (%): Harvest Index in percent; LSD: Least Significant Difference; NFGP: Number of Filled Grain per Panicle; NUFGP: Number of Unfilled Grains per Panicle; PH: Plant Height; PL: Panicle Length; P-value: Probability at α=0.05 level; RYL: Relative Yield Loss; SEM: Standard Error of Mean; TGW: Thousand Grain Weight | ||||||||||
Table 6: Mean values of agronomic and grain quality traits.
Variability of genotypes
The genotype variations were highly significant for the brown spot severity index, area under disease progress curve, and apparent infection rate characters at 1% α level. Moreover, except for thousand-grain weight, genotypes were very significantly varied in days to maturity, the number of filled and unfilled grains per panicle, grain yield, and harvest index even at a 1% level of significance. Similarly, Dariush, et al. has reported comparable results involving 95 tested genotypes for number of filled grains per panicle, number of unfilled grains per panicle, hundred seed weight, number of productive tillers, brown spot severity index, AUDPC, and r-value parameters. Furthermore, Mwendo, et al. had also stated as there was a highly significant variation for disease severity among 100 rice germplasm. There is significant variation in sensitivity to brown spot among the 24 rice types tested by Yosep, et al. which could lead to a wide range of yield losses caused by B. oryzae [15].
According to Dhungana, et al. there was significant variation across 20 genotypes, with Sarju-52 (4.32 t/ha) having the highest grain yield and Sabitri (4.19 t/ha), respectively. Based on Dhungana, et al. and Pantha, et al. report, some genotypes, such as Kathe Jhinuwa, Radha-4, and Sabitri, were superior in grain yield and resistant to the brown spot. However, even though their production was comparable to better yielders, genotypes like BI 0530-5-10-1-2 and NR 1893 had a greater disease incidence and severity. Aryal, et al. highlighted the differences in grain production, disease incidence, and severity between 12 varieties (Radha-4 and Kabeli were resistant to brown spot, while Poonam, Mithila, and Sonam were senssitive to brown spot).
Cluster analysis
The maximum number of lowland rice genotypes were grouped in cluster II, followed by cluster I, whereas clusters III and IV constituted the lowest number of genotypes (Figure 3). Out of forty-nine genotypes tested, 42.86%, 38.77%, 10.20% and 8.16% of genotypes were failed under clusters II, I, III, and IV, respectively. The cluster analysis of genotypes revealed that the range of days to heading and days to maturity were ranged from 100.88 to 111 and from 143.24 to 150.7 days, respectively. The number of plants per meter in clusters was also ranged from 69.10 to 109.75, whereas the maximum and the minimum number of filled grains per panicle in clusters were 121.08 and 99.72. In cluster I, the number of unfilled grains was low (5.73) and the highest number was recorded from cluster IV (12.6). On the other hand, the minimum thousand-grain weight was recorded in cluster IV (29.24 g), while the maximum weight was obtained in cluster I (33.42 g). The highest grain yield was observed in cluster III (7555.45 kg/ha) followed by cluster I (5332.93 kg/ha) and II (5161.63 kg/ha). The harvest index was also high in cluster I (43.75%) and III (41.89%) and the lowest was recorded in cluster IV (25.06%) (Table 7).
Based on epidemiological parameters, cluster IV had the highest brown spot severity index (18.14%), while cluster III had the lowest severity index (4.48%). The progress of B. oryzae within time in clusters varied and the apparent infection rate in clusters was ranged from 0.02 (cluster III) to 0.08 (cluster IV). Furthermore, 49 genotypes were clustered into four clusters in their mean AUDPC value and the maximum and minimum values were showed in cluster II (231.77) and cluster III (50.75). 75% of genotypes grouped under cluster III were highly resistant. Pantha, et al. had also grouped 20 genotypes into four clusters (cluster I: Six susceptible genotypes, cluster II: 11 moderately resistant genotypes, cluster III: Two resistant genotypes, and cluster IV: One highly susceptible genotype) based on AUDPC values (Table 8) [16].
| Cluster | Number of genotypes | Genotypes included |
|---|---|---|
| I | 19 | ER2012 1, ER2012 3, ER2012 6, ER2012 14, ER2012 15, ER2012 16, ER2012 18, ER2012 21, ER2012 23, ER2012 25, ER2012 26, ER2012 31, ER2012 32, ER2012 33, ER2012 35, ER2012 38, ER2012 39, ER2012 43, ER2012 R7 |
| II | 21 | ER2012 2, ER2012 5, ER2012 7, ER2012 8, ER2012 9, ER2012 10, ER2012 11, ER2012 13, ER2012 17, ER2012 20, ER2012 22, ER2012 24, ER2012 27, ER2012 28, ER2012 34, ER2012 36, ER2012 40, ER2012 R2, ER2012 R5, ER2012 R8 and ER2012 R9 |
| III | 4 | ER2012 12, ER2012 30, ER2012 R1 and ER2012 R6 |
| IV | 5 | ER2012 4, ER2012 19, ER2012 29, ER2012 37, ER2012 44 |
Table 7: Lowland rice genotypes in four clusters based on agronomic and epidemiological parameters.
| Cluster | Agronomic and epidemiological parameters cluster mean | ||||||||||||||
|---|---|---|---|---|---|---|---|---|---|---|---|---|---|---|---|
| DE | DH | DM | NPM | PH (cm) | PL (cm) | DBY (kg/ha) |
NFGP | NUFGP | TGW (g) | GY (kg/ha) | HI (%) | BSI (%) |
r-value | AUDPC value |
|
| I | 12.76 | 101.00 | 143.24 | 78.84 | 98.39 | 20.14 | 12352.21 | 114.57 | 5.73 | 33.42 | 5332.93 | 43.75 | 11.91 | 0.06 | 143.25 |
| II | 11.10 | 104.31 | 144.98 | 88.17 | 98.19 | 20.44 | 14866.33 | 110.53 | 9.67 | 31.67 | 5161.63 | 37.28 | 15.63 | 0.06 | 231.77 |
| III | 11.88 | 100.88 | 142.50 | 109.75 | 117.88 | 20.83 | 18047.00 | 121.08 | 9.63 | 33.40 | 7555.45 | 41.89 | 4.48 | 0.02 | 50.75 |
| IV | 12.70 | 111.00 | 150.70 | 69.10 | 82.40 | 19.68 | 10375.20 | 99.72 | 12.60 | 29.24 | 2628.02 | 25.06 | 18.14 | 0.08 | 229.03 |
| Note: DE: Days to Emergence; DH: Days to Heading; DM: Days to Maturity; NPM: Number of Plants per Meter; PH (cm): Plant Height in centimeter; PL (cm): Panicle Length in centimeter; DBY: Dry Biomass Yield; NFGP: Number of Filled Grain per Panicle; NUFGP: Number of Unfilled Grains per Panicle; TGW: Thousand-Grain Weight; GY (kg/ha): Grain Yield in kilogram per hectare; HI (%): Harvest Index in percent; BSI (%): Brown Spot-Severity Index in percent; r-value: Apparent infection rate: AUDPC: Area Under Disease Progress Curve. | |||||||||||||||
Table 8: Cluster means of lowland rice genotypes.

Figure 3: Dendrogram of genotypes clusters based on agroepidemiological traits.
Correlation of epidemiological parameters along with agronomic parameters
The correlation analysis revealed that the overall disease parameters highly significantly as well as positively and negatively associated with agronomic and grain quality characters. High plant population in a certain area reduces soil nutrients and leads to plants stress and early maturity. In this regard, the number of plants per meter was negatively correlated though it was not significantly varied with days to maturity. Days to maturity was also showed a positive and significant correlation with apparent infection rate. The association of the number of plants per meter was negative and not significant with all parameters except with grain and dry biomass yield (Table 9) [17].
While the number of filled grains per panicle was negatively correlated with brown spot severity index, area under disease progress curve, and apparent infection rate but not significantly associated, whereas grain yield, harvest index, thousand-grain yield, and dry biomass yield positively interacted with filled grain per panicle. An increase in the number of unfilled grains per panicle affected grain yield, and harvest index negatively although it was positively associated with other agronomic characters and disease parameters as shown in Table 9. However, its association was significant with disease characters. The number of filled grain per panicle and thousand-grain weight had a similarly non-significant and negative correlation with AUDPC as reported by Dariush, et al.
The thousand-grain weight showed a negative correlation with the area under disease progress curve but had a non-significant association with days to maturity, number of plants per meter, dry biomass yield, number of filled grain per panicle, number of unfilled grains per panicle, thousand-grain weight, grain yield, harvest index, brown spot severity index and apparent infection rate. This analysis focused on the interaction between grain yield and epidemiological parameters. The rice grain yield was not only affected as the brown spot severity enhanced and the disease was progressed over time but also the association was highly significant with all characters. As to the report of Dhungana, et al. grain yield was also negatively correlated with mean AUDPC by 14.77%. The rice dry biomass yield was not also correlated significantly with disease severity, area under disease progress curve, and apparent infection rate even if it was positive except for harvest index. Moreover, a negative and significant association showed between the rice harvest index and disease characters of B. oryzae [18].
The incidence of brown spot was negatively correlated with number of plants per meter, dry biomass yield, grain yield, and harvest index, but it was highly significant with grain yield, number of unfilled grains per panicle, and harvest index. The brown spot severity index, area under disease progress curve and apparent infection rate were positively and very significantly increased by brown spot incidence. The maturity time (days to maturity) of rice was also enhanced when the brown spot incidence increased [19].
The brown spot severity index was highly positively and significantly correlated with area under disease progress curve and apparent infection rate. The correlation between apparent infection rate and the disease progress curve was also positive and significantly associated (Table 9). The above results of this study were not similar to Dariush, et al. report since the association between the number of plants per meter and AUDPC was positive, while the number of unfilled grains per panicle and AUDPC was negative in association and vice versa. Aryal, et al., Pantha, et al., Dariush, et al. and Dhungana, et al. were also reported as there was a significant negative relationship between the disease progress curve and grain yield in conformity with the above results [20].
| Traits | DM | NPM | NFGP | NUFGP | TGW | GY | DBY | HI | BSI | AUDPC | r-value |
|---|---|---|---|---|---|---|---|---|---|---|---|
| DM | 1 | ||||||||||
| NPM | -0.1999** | 1 | |||||||||
| NFGP | 0.0486ns | -0.133ns | 1 | ||||||||
| NUFGP | 0.0761ns | -0.0082ns | -0.0308ns | 1 | |||||||
| TGW | -0.2419** | -0.1487ns | 0.0941ns | 0.0664ns | 1 | ||||||
| GY | -0.3709* | 0.2609* | 0.3318* | -0.3214* | 0.2348** | 1 | |||||
| DBY | -0.0891ns | 0.3543* | 0.2033** | 0.078ns | 0.0925ns | 0.3212* | 1 | ||||
| HI | -0.4322* | Â 0.0547ns | 0.3791* | -0.4228* | 0.1035ns | 0.6966* | -0.0198ns | 1 | |||
| BSI | 0.0472ns | -0.0711ns | -0.134ns | 0.2978* | 0.0306ns | -0.2461** | -0.0404ns | -0.2568** | 1 | ||
| AUDPC | 0.0256ns | -0.0459ns | -0.1438ns | 0.2743* | -0.0062ns | -0.2224** | 0.0015ns | -0.2449** | 0.9672* | 1 | |
| r-value | 0.2133** | -0.0849ns | -0.0692ns | 0.2612* | 0.0242ns | -0.2968* | -0.1225ns | -0.2544** | 0.7967* | 0.6759* | 1 |
| Note: *,**: Significant at 1 and 5% levels respectively; AUDPC: Area Under Disease Progress Curve; BSI (%): Brown Spot-Severity Index in percent; DBY: Dry Biomass Yield; DM: Days to Maturity; GY (kg/ha): Grain Yield in kilogram per hectare; HI (%): Harvest Index in percent; NFGP: Number of Filled Grain per Panicle; NPM: Number of Plants per Meter; ns: non-significance; NUFGP: Number of Unfilled Grains per Panicle; r-value: Apparent infection rate; TGW: Thousand-Grain Weight | |||||||||||
Table 9: Correlation coefficients of disease and agronomic parameters.
Conclusion
In conclusion, the development of host resistance in the management of rice brown spot (Bipolaris oryzae) is highly valuable. Thus, the development of resistant genotypes via screening against the pathogen was achieved in this experiment. Amongst 49 genotypes evalusated, about 15 genotypes were highly resistant and 11 were resistant on the assessment of brown spot severity index and mean area under disease progress curve. Based on varied resistance levels, 15 genotypes were developed as highly resistant. These genotypes were superior in grain yield and the grain yield obtained from highly susceptible and susceptible genotypes including were too low.
However, grain yield is not limited only by disease severity but also by the genetic potential of the crop. The progress of B.oryzae with time was low for highly resistant genotypes and their disease severity index and apparent infection rate were zero. Hence, the identified highly resistant genotypes are helpful for brown spot management and for designing other improved varieties through breeding programs in the future. All in all, the development of resistant rice varieties against brown spot will also be enabled to manage the pathogen in an anaerobic ecosystem of rice production and used as a source of host resistance in further breeding research works.
Recommendations
Brown spot management is truly achieved through detailed characterization of B. oryzae and design of the best control strategy. It is known that host-plant resistance is an ideal method of management since it is economical and environmentally friendly. Genotypes with highly resistant and high grain yield in combination with other good characters tested can be recommended for the management of brown spot. Therefore, Scrid037-4-2-2-5-2 (8693 kg/ha), Shaga (8184.50 kg/ha), scrid019-1-1-1-1-2 (7345.50 kg/ha), Fengdao 23 (7126.7 kg/ha) and FOFIFA 167 (6895.60 kg/ha genotypes are recommended in the management of B. oryzae and as source of parent lines for further breeding programs. The pathogen characteristics of rice diseases should also be investigated similarly because diseases management is achieved through the primary characterization of a specific pathogen. The development of resistant genotypes should also be supported with artificial inoculation and molecular tools to develop management strategies.
Acknowledgements
The authors would like to extend sincere gratitude to the Ethiopian Institute of Agricultural Research (EIAR), Fogera National Rice Research and Training Centre (FNRRTC) and Ambo Agricultural Research Centre (AmARC), respectively, for providing financial, logistics and laboratory support to conduct this work. We are also grateful to staff members of plant protection department (Mr. Desalegn Yalew and Mr. Eniyew Nigatu) and rice breeding program at FNRRTC for material and technical support provided.
Funding
The authors declare that no funds, grants, or other support were received during the preparation of this manuscript.
Conflict of Interests
Authors have declared that no competing interests exist.
Author Contributions
The corresponding author contributed to the study conception, design and interpret. The first draft of the manuscript was written by Muluadam Berhan Ejigu and Merkuz Abera and Birhanu Bekele commented and edited on previous versions of the manuscript. All authors read and approved the final manuscript.
Ethical Approval
This study was evaluated by the Bahir Dar University assigned advisors and also approved by the university board examiners. It has not been published in any journal.
References
- Fahad S, Adnan M, Noor M, Arif M, Alam M, Khan IA, et al. Major constraints for global rice production. Advances in Rice Research for Abiotic Stress Tolerance, Woodhead Publishing. 2019:1-22.
- Dessie G. Open field performance of tomato (Lycopersicon esculentum Mill.) cultivars in the rainy season at Woreta, South Gondar, Ethiopia. Int J Sci Res Agri Sci. 2015;2(5):117-125.
- Fetene DY, Birhan M, Zeleke T. Screening of rice germplasms for their resistance against sheath rot disease (Sarocladium oryzae) at Fogera, Ethiopia. J Plant Pathol Microbiol. 2020;11(518):10-24.
- IRRI. Standard Evaluation System for Rice (SES). 5th Ed., International Rice Research Institute, Manila, Philippines. 2013:56.
- Dariush S, Darvishnia M, Ebadi AA, Padasht-Dehkaei F, Bazgir E. Screening brown spot resistance in rice genotypes at the seedling stage under water stress and irrigated conditions. Arch Phytopathol Pflanzenschutz. 2020;53(5-6):247-265.
- van der Plank JE. Plant disease: Epidemics and control. Academic Press, New York and London. 1963:349.
- Pantha P, Shrestha SM, Manandhar HK, Gaire SP, Aryal L, Yadav DR. Evaluation of rice genotypes for resistance against brown spot disease caused by Bipolaris oryzae. Int J Curr Res. 2017;9(04):48562-48569.
- Dhungana A, Puri C, Shah K, Yogi S, Dhakal DP, Acharya B, et al. Screening rice genotypes for brown spot disease resistance. Tunisian J Plant Prot. 2020;15(2):29-39.
- Bioversity International, IRRI and WARDA. Descriptors for Wild and Cultivated Rice (Oryza spp.). Bioversity International, Rome, Italy; International Rice Research Institute, Los Banos, Philippines; WARDA, Africa Rice Center, Cotonou, Benin. 2007:72.
- Aryal L, Bhattarai G, Subedi A, Subedi M, Subedi B, Sah GK. Response of rice varieties to brown spot disease of rice at Paklihawa, Rupandehi. Glob J Biol Agric Health Sci. 2016;5(2):50-54.
- Hosagoudar GN, Sheshaiah BS, Umesh BB. Evaluation of host plant resistance for blast and brown spot diseases of paddy in hill zone of Karnataka, India. Int J Curr Microbiol App Sci. 2019;8(3):1294-1304.
- Mau YS, Ndiwa A, Oematan S. Brown spot disease severity, yield and yield loss relationships in pigmented upland rice cultivars from East Nusa Tenggara, Indonesia. Biodiversitas. 2020;21(4):1625-1634.
- Marco MM, Mildred OS, Jimmy L, Paul G, Richard E. Reaction of upland rice genotypes to the brown spot disease pathogen Bipolaris oryzae. Afr J Rural Dev. 2017;2(1):127-133.
- Magar PB. Screening of rice varieties against brown leaf spot disease at Jyotinagar, Chitwan, Nepal. Int J Appl Sci Biotechnol. 2015;3(1):56-60.
- Mukherjee AK, Mohapatra NK, Nayak P. Estimation of area under the disease progress curves in a rice-blast pathosystem from two data points. Eur J Plant Pathol. 2010;127:33-39.
- Zeleke T, Birhan M, Ambachew W. Survey and identification of rice diseases in South Gondar zone, Amhara region, Ethiopia. J Agric Crops. 2019;5(8):123-131.
- Laha GS, Singh R, Ladhalakshmi D, Sunder S, Prasad MS, Dagar CS, et al. Importance and management of rice diseases: A global perspective. Rice Prod Worldw. 2017:303-360.
- Sunder S, Singh RA, Agarwal R. Brown spot of rice: An overview. Indian Phytopathol. 2014;67(3):201-215.
- FAO. Crop prospects and food situation-Quarterly global report No. 1, March 2021. Food and Agriculture Organization, Rome, Italy. 2021.
[Crossref]
- Wolie AW, Admassu MA. Effects of integrated nutrient management on rice (Oryza sativa L) yield and yield attributes, nutrient uptake and some physico-chemical properties of soil: A review. J Biol Agric Healthcare. 2016;6(5):20-26.
Citation: Berhan M, Abera M, Bekele B (2025) Screening of Brown Spot (Bipolaris oryzae) Disease Resistant Lowland Rice (Oryza sativa L.) Genotypes at Fogera, Ethiopia. J Plant Pathol Microbiol. 16:742.
Copyright: © 2025 Berhan M, et al. This is an open-access article distributed under the terms of the Creative Commons Attribution License, which permits unrestricted use, distribution, and reproduction in any medium, provided the original author and source are credited.