
Indexed In
- Open J Gate
- RefSeek
- Hamdard University
- EBSCO A-Z
- Scholarsteer
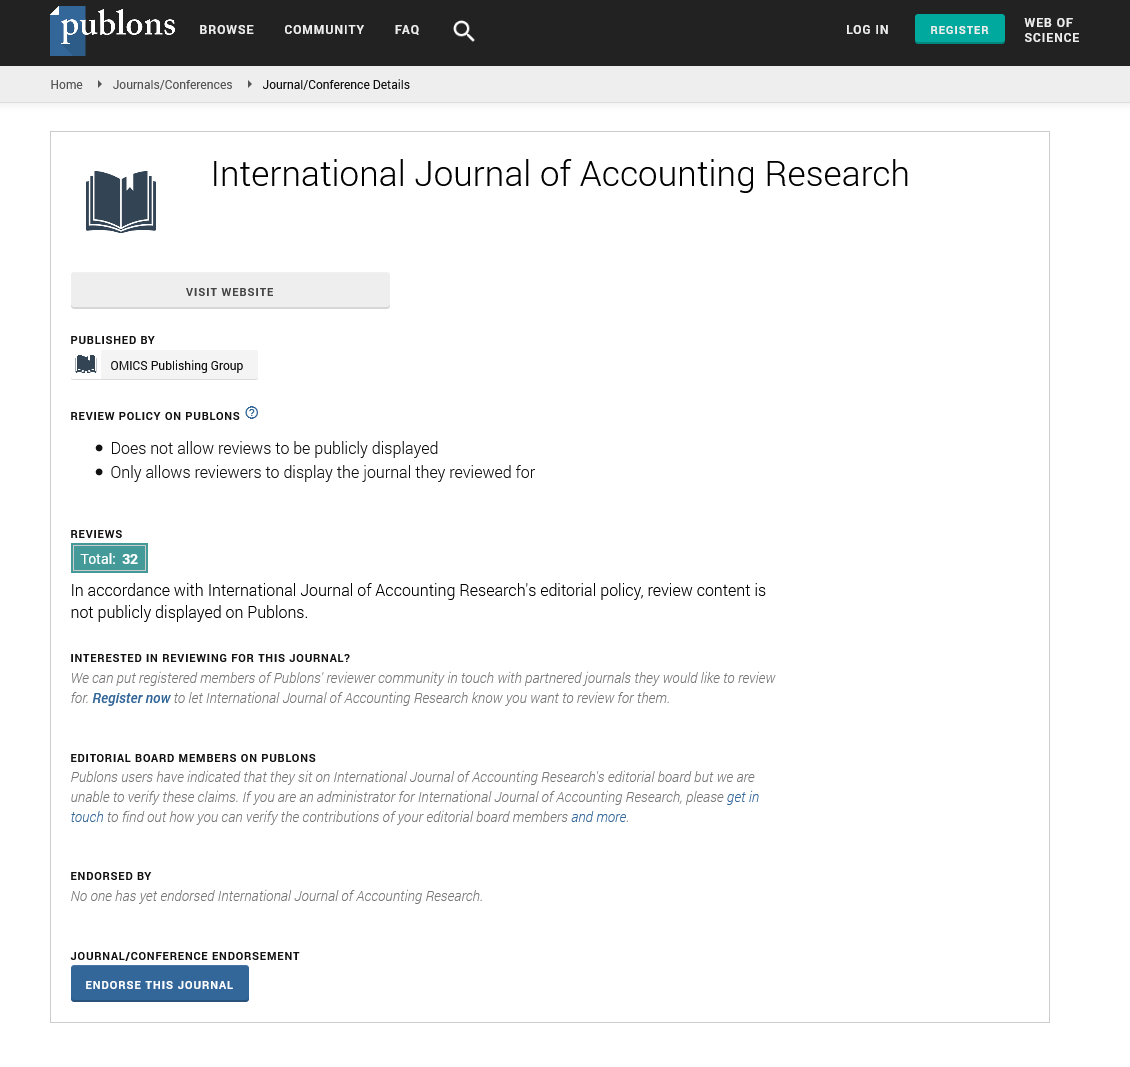
- Publons
- Euro Pub
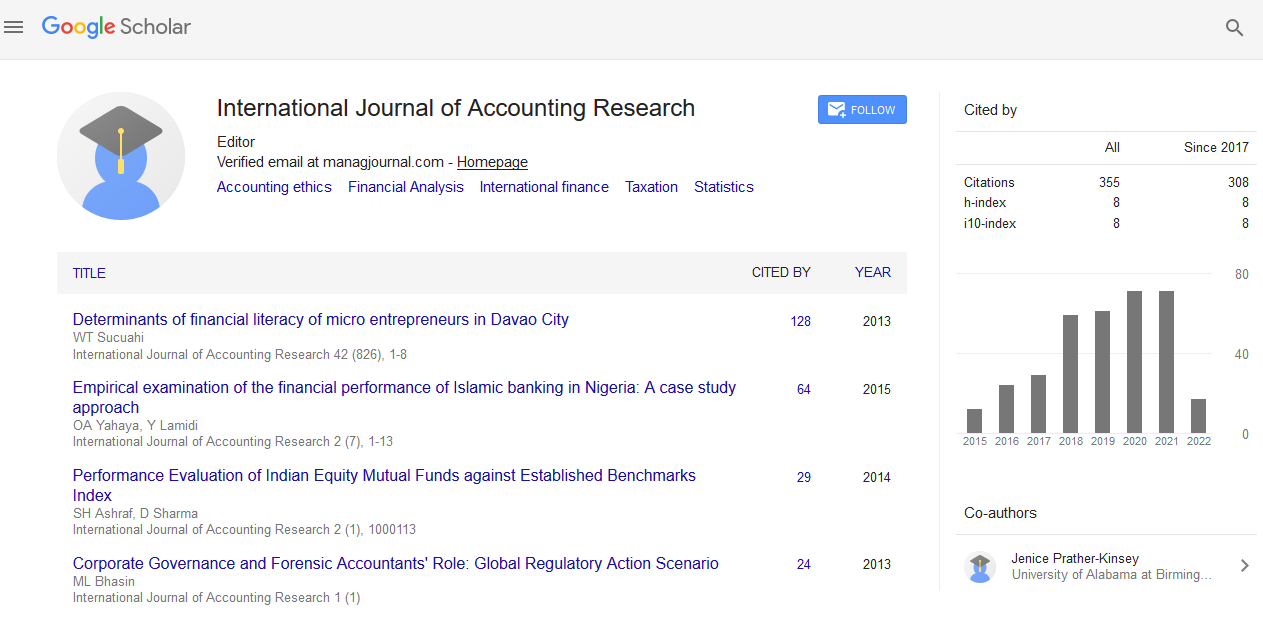
- Google Scholar
Useful Links
Share This Page
Journal Flyer
Open Access Journals
- Agri and Aquaculture
- Biochemistry
- Bioinformatics & Systems Biology
- Business & Management
- Chemistry
- Clinical Sciences
- Engineering
- Food & Nutrition
- General Science
- Genetics & Molecular Biology
- Immunology & Microbiology
- Medical Sciences
- Neuroscience & Psychology
- Nursing & Health Care
- Pharmaceutical Sciences
Commentary - (2023) Volume 11, Issue 3
Quantitative Models in Stock Market Forecasting: A Comparative Study
Yan Chin*Received: 02-Jun-2023, Manuscript No. IJAR-23-22164; Editor assigned: 06-Jun-2023, Pre QC No. IJAR-23-22164 (PQ); Reviewed: 20-Jun-2023, QC No. IJAR-23-22164; Revised: 27-Jun-2023, Manuscript No. IJAR-23-22164 (R); Published: 05-Jul-2023, DOI: 10.35248/2472-114X.23.11.334
Description
The stock market is a complex and dynamic system influenced by various factors, making accurate forecasting a challenging task. Over the years, quantitative models have gained popularity as a means to analyze historical data and predict future market trends. In this study, they will explore different quantitative models used in stock market forecasting, compare their methodologies, strengths, and limitations, and discuss their effectiveness in predicting stock market movements.
Moving average models
Moving Average (MA) models are widely used in stock market forecasting. They calculate the average of stock prices over a specific time period to identify trends and potential reversals. The Simple Moving Average (SMA) takes the average price over a fixed window, while the Exponential Moving Average (EMA) assigns different weights to recent and older prices, giving more importance to recent data. MA models are simple to implement and provide a basic understanding of price movements, but they may lag behind rapidly changing market conditions.
Autoregressive integrated moving average models
Autoregressive Integrated Moving Average (ARIMA) models are a popular class of time series models used in stock market forecasting. They combine Autoregressive (AR), Moving Average (MA), and differencing (I) components to capture both trend and seasonality in the data. ARIMA models can handle nonstationary time series data and are effective in capturing shortterm fluctuations. However, they may struggle with long-term trends and fail to incorporate external factors that can impact stock prices.
Generalized Autoregressive Conditional Heteroskedasticity (GARCH)
Generalized Autoregressive Conditional Heteroskedasticity (GARCH) models focus on modeling the volatility of stock returns rather than the returns themselves. GARCH models are particularly useful in capturing the presence of volatility clustering, where periods of high volatility tend to cluster together. By understanding and predicting volatility patterns, GARCH models assist in managing risk and optimizing investment strategies. However, GARCH models assume that volatility patterns observed in the past will continue into the future, which may not always hold true during extreme market conditions.
Artificial Neural Networks (ANN)
Artificial Neural Networks (ANN) are computational models inspired by the human brain's neural structure. ANN models analyze large amounts of historical data to identify complex patterns and relationships that may not be evident through traditional statistical methods. ANNs have the ability to learn and adapt, making them suitable for capturing nonlinear relationships in stock market data. However, ANN models are data-intensive and require careful training and validation to avoid overfitting or underfitting.
Support vector machines
Support Vector Machines (SVM) are machine learning models that aim to find an optimal hyperplane to separate different classes of data points. SVM models can be applied to stock market forecasting by training them on historical price and volume data to predict future market trends. SVM models have the advantage of handling high-dimensional data and can capture nonlinear relationships. However, they may be sensitive to parameter tuning and require careful feature selection to achieve accurate predictions.
Conclusion
Quantitative models play a vital role in stock market forecasting, providing investors and traders with valuable insights into future price movements. Each model discussed in this article offers a different approach to analyzing historical data and predicting stock market trends. Moving Average (MA) models provide a simple understanding of price trends, while ARIMA models capture both trend and seasonality. GARCH models focus on volatility patterns, while Artificial Neural Networks (ANN) and Support Vector Machines (SVM) excel at capturing complex relationships.
Citation: Chin Y (2023) Quantitative Models in Stock Market Forecasting: A Comparative Study. Int J Account Res. 11:334.
Copyright: © 2023 Chin Y. This is an open-access article distributed under the terms of the Creative Commons Attribution License, which permits unrestricted use, distribution, and reproduction in any medium, provided the original author and source are credited.