
Indexed In
- Open J Gate
- JournalTOCs
- RefSeek
- Hamdard University
- EBSCO A-Z
- OCLC- WorldCat
- Scholarsteer
- Publons
- Geneva Foundation for Medical Education and Research
- Google Scholar
Useful Links
Share This Page
Journal Flyer
Open Access Journals
- Agri and Aquaculture
- Biochemistry
- Bioinformatics & Systems Biology
- Business & Management
- Chemistry
- Clinical Sciences
- Engineering
- Food & Nutrition
- General Science
- Genetics & Molecular Biology
- Immunology & Microbiology
- Medical Sciences
- Neuroscience & Psychology
- Nursing & Health Care
- Pharmaceutical Sciences
Research Article - (2025) Volume 13, Issue 1
Preparation, Characterization, and Taguchi Optimization of Poly (Amide/Amic Acid) Thin Film Composite Membrane
Gholam Ali Koohmareh*, Behnaz Ghalavand and Akbar MalekpourReceived: 17-Oct-2023, Manuscript No. MCA-23-23594; Editor assigned: 20-Oct-2023, Pre QC No. MCA-23-23594 (PQ); Reviewed: 03-Nov-2023, QC No. MCA-23-23594; Revised: 08-Jan-2025, Manuscript No. MCA-23-23594 (R); Published: 15-Jan-2025, DOI: 10.35248/2329-6798.25.13.485
Abstract
A thin film composite membrane was prepared on a microporous membrane by in situ interfacial polycondensation of a new diamine containing amic acid with trimesoyl chloride. Diamine Amic Acid (DAAA) was synthesized from the reaction of pyromellitic dianhydride with aminoethyl piperazine and was characterized by FT-IR and 1H-NMR spectroscopies. The prepared membrane was characterized by ATR-IR technique and was evaluated from aspect of surface properties, morphology, and performance using AFM, SEM, contact angle, and cross-flow membrane module.
Finally, Taguchi method has been used to investigate the effects of concentration of DAAA monomer, pH, reaction time, and curing time on permeation and rejection processes. The optimum conditions to reach the desired performance were obtained. The operating conditions in the optimum performance were obtained as follow: concentration of DAAA= 3% (w/v), pH=9, reaction time=60 s and curing time=10 min. Under these conditions for a 1000 ppm solution of Na2SO4, permeation and rejection were obtained 34.17 (L.h-1.m-2) and 92.6%, respectively.
Keywords
Interfacial polymerization; Thin film composite membrane; Diamine Amic Acid (DAAA); Nanofiltration; Taguchi method
Introduction
With the rapid growth of the world's population and urbanization, the sharp rise in freshwater demand has become one of the most critical challenges of contemporary society. Desalination is an efficient and reliable way of tackling global water scarcity. This technology is capable of supplying fresh water for human consumption as well as agricultural and industrial purposes by removing salts in the water. Desalination technologies can be categorized into two classes based on the separation mechanism: membrane processes and thermal processes. Although the foremost choice of desalination is the thermal process in the Middle East, membrane processes are rapidly developing around the world. Meanwhile, the use of Nanofiltration (NF) membranes has become commonplace due to the high energy efficiency in advanced treatment of groundwater, surface contaminated water, and industrial effluents to produce high-quality drinking water [1].
Nanofiltration (NF) membranes are semi-permeable and pressure-driven, with the properties between Reverse Osmosis (RO) and Ultrafiltration (UF) membranes. In recent years, due to the main benefits compared to the asymmetric membranes, the most of the developed NF membranes have a Thin-Film Composite (TFC) structures [2].
There are various methods for the preparation of TFC membranes, for example, the dip-coating process, the radiation polymerization, photo-initiated polymerization, plasma-initiated polymerization, photo-initiated grafting and Interlayer Polymerization (IP) [3].
Among all these methods, IP is the most common to prepare composite membranes. In this method, the thin film is prepared on the sub-layer by the reaction of two monomers, each monomer is solved in a solvent which is immiscible in another solvent, and the polymerization reaction occurs at the interface of the two liquids. In the TFC membranes, the main component of the separation properties controller is the highest layer of ultra-thin. In contrast, the protective layer provides the required mechanical properties of the membrane. The polymer structure and the preparation conditions of the ultra-thin selective layer, determine the composite membrane performance. From the point of view on polymer structure, it is believed that several factors could affect membrane performance, such as monomer size, shape, solubility, and reactivity [4].
A large number of TFC membranes have been prepared from various polymers, including polyamides, polyureas, polydopamine, polyimides, polyethylenimine, and polyesters [5].
Preparation of the TFC membrane using a new monomer with special functional groups is a new topic that gets the most attention of the researchers, recently. Li et al. mad a novel nanofiltration membrane by in situ interfacial Polymerization of poly (amidoamine) (PAMAM) dendrimer and trimesoyl chloride on a supporting membrane. The surface charge of the TFC membrane could be arranged based on the number of primary and tertiary amino groups on the active layer of the membrane.
Tang et al. utilized an environmentally friendly monomer, Triethanolamine (TEOA), to enhance membrane performance of the TFC–NF membrane. They were prepared a polyester membrane by the polymerization of TEOA and TMC. They found out that decreasing the pH of the feed, increases the permeation from the membrane. They mentioned that the reason for this phenomenon is the presence of the tertiary amino group in the TEOA structure. In fact, decreasing the pH of the feed cause’s conversion of amine to ammonium, which was increases the hydrophobicity of the membrane. Accordingly, this kind of monomers has been used in the treating acidic solution.
This paper studies, the synthesis of a novel Diamine Amic Acid (DAAA) monomer, and its use for the preparation of NF membranes on polysulfone supporting films through an interfacial polymerization with TMC. The chemical structure of the polymer, membrane morphology, and hydrophilicity of the surface of the TFC membrane were analyzed by Attenuated Total Reflectance Infrared (ATR-IR), Scanning Electron Microscopy (SEM), Atomic Force Microscopy (AFM) and Contact Angle (CA). Since the most of studies have focused on membrane performance improvements by optimizing of the preparation factors, the effects of the concentration of DAAA monomer, pH, reaction time and curing time on permeation, and salt rejection are studied by Taguchi method [6].
Materials and Methods
Materials
Aminoethylpiperazine (AEP, 95%), pyromellitic dianhydride (PMDA, 97%), dimethylformamide (DMF, 99%) and sodium hydroxide (NaOH, 98%, pellets) was purchased from Merck Chemical Company. Trimesoyl Chloride (TMC, 99%) was purchased from Sigma-Aldrich. The microporous polysulfone (PSf) as supporting membrane was supplied by the nanobiotechnology research laboratory, faculty of chemical engineering, Noshirvani university of technology, Babol, Iran.
Na2SO4 (Merck) was utilized for investigation of ion rejections [7].
Synthesis of Diamine Amic Acid (DAAA) monomer
In a 50 mL flask, aminoethylpiperazine (3.26 ml; 0.025 mol) was dissolved in 5 mL of Dimethylformamide (DMF), and the solution was cooled to 0-5°C. Then, PMDA (2.18 g; 0.01 mol) in 20 mL of DMF was added all at once, and the reaction mixture was stirred for 2 h at 0-5°C and 4 h at room temperature. Then, the reaction mixture was added to ice-water, and the precipitate was filtered and washed with cold water and methanol. The product was then dried in a vacuum oven at 50°C [8].
Preparation of thin film poly (amide-amic acid) composite membranes
First, the polysulfone support membrane was immersed for 2 min in aqueous solutions of DAAA with NaOH (to adjust different pH) at 25°C. The surface was rolled with a soft rubber roller to eliminate any tiny bubbles and remove the excess solution. The saturated membrane was then immersed in the 0.1 wt. % of TMC in n-hexane, to form a thin film of poly (amideamic acid) on the top of the Polysulfone (PSf) support membrane. The prepared thin film composite membrane was cured in an oven at 80°C. The resulting membrane was washed thoroughly with Deionized (DI) water and stored wetly until it was tested.
Characterization of the monomer
Fourier Transform Infrared (FTIR): The chemical structure of DAAA was studied with Fourier Transform Infrared (FTIR) spectroscopy (JASCO, model 6300, Japan). It was recorded using KBr pellet in the range of 400–4000 cm-1.
Characterization of TFC membrane
Attenuated Total Reflectance Infrared (ATR-IR): Information about the presence of particular functional groups on the membrane surfaces and effective interfacial polymerization were obtained by Attenuated Total Reflectance Fourier Transform Infrared (JASCO, model 6300, Japan) technique. For ATR-IR analysis of membrane samples, Germanium crystal at 45° of incidence was used [9].
Scanning Electron Microscopy (SEM): The surface and crosssection morphology of membranes were evaluated by SEM (ZEISS, SIGMA, Germany). For SEM evaluations, a sputtercoating machine coats the gold on the membranes.
Atomic Force Microscopy (AFM): The surface roughness of membranes was quantitatively measured by AFM (DME, Dualscop C-26, Germany) in non-contact mode. The membrane surfaces were imaged in a scan size of 10 μm × 10 μm.
Before the SEM and AFM evaluation, the membrane samples were removed from the deionized water tank and completely dried under vacuum.
Contact Angle (CA): The contact angle, which is measured between the surface of the membrane and the air-water interface is an important parameter to estimate the hydrophilicity of the membrane surface. A static sessile drop technique is used to measure the water contact angle of TFC membranes by using Fars EOR technologies, CA-ES10, Iran, at room temperature. The deionized water droplet was put on a surface of the dry membrane utilizing a motor-driven micro syringe. The lower contact angle, the higher is the tendency of the membrane to the hydrophilicity [10].
Design of Experiments (DOE)
A suitable way for reducing the number of required experiments to finding the effects of different parameters on both the quantity of a product is experimental design. It is noticeable that the first step of this approach is the right choice of the factors and their levels.
In this study, one of the most common approaches of experimental design, namely, the Taguchi method is used. Also, the concentration of DAAA monomer, pH, reaction time, and curing time are considered as four main factors to study. These factors and their levels are selected based on the literature (Table 1) [11].
| Design parameter | Symbol | Unit | Level 1 | Level 2 | Level 3 |
|---|---|---|---|---|---|
| Concentration of DAAA monomer | A | w/v% | 1 | 2 | 3 |
| pH | B | - | 7 | 9 | 11 |
| Reaction time | C | s | 30 | 60 | 90 |
| Curing time | D | min | 5 | 10 | - |
Table 1: Selected factors and their levels.
For the Taguchi-experimental design with four factors, and with the combination of different levels, a standard L9 orthogonal array was applied as shown in Table 2. The tests should be done randomly to avoid the systematic bias [12].
The Qualitek-4 software is used to improve the response by analyzing the results and optimizing the control parameters. In the Taguchi method, the Signal-to-Noise (S/N) ratio is used as a transformed response, to indicate how the response changes under various noise conditions [13].
In this study, permeation and salt rejection were used as the response, individually. To maximize the responses, the following S/N ratio equation should be used:
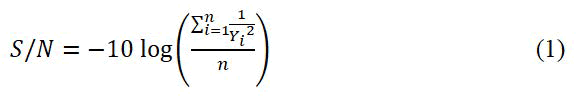
Where, n indicates the number of tests per each trial, and y is related to the experimental value of the permeation or the salt rejection. It is desired to reach the larger S/N ratio for the optimization of responses.
| Trial | Factors | |||
|---|---|---|---|---|
| A | B | C | D | |
| 1 | 1 | 1 | 1 | 1 |
| 2 | 1 | 2 | 2 | 2 |
| 3 | 1 | 3 | 3 | 1 |
| 4 | 2 | 1 | 2 | 1 |
| 5 | 2 | 2 | 3 | 1 |
| 6 | 2 | 3 | 1 | 2 |
| 7 | 3 | 1 | 3 | 2 |
| 8 | 3 | 2 | 1 | 1 |
| 9 | 3 | 3 | 2 | 1 |
Table 2: Experimental design by using Taguchi method (L9).
Membrane performance evaluation
The cross-flow membrane module (Figure 1) with the effective area of 4 cm² and feed flow rate of 270 L/h-1 was used to determine the performance of the membranes (permeation and salt rejection). All of the experiments were conducted using an operating pressure of 10 bar at 25°C. The sodium sulfate (Na2SO4) concentration in the feed solution was 1000 ppm.
The permeate flux (F) of each membrane sample was obtained by measuring the volume of penetrated water per membrane unit area per unit time and was computed by the following Equation (2) [14].
F=V/(A.t) (2)
Where V is the total volume of permeated during the experiment, A is the effective area of the membrane, and t is the running time.
The concentrations of the feed and the permeate solution were determined by measuring the electrical conductivity of the salt solution and by comparing it with the calibration plot drawn between salt concentration and conductivity [15].
Rejection (R) is defined by the following Equation (3):
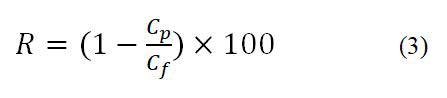
Where Cf and Cp are salt concentrations in the feed and permeate, respectively.

Figure 1: Schematic presentation of membrane property test device.
Results and Discussion
Synthesis and characterization of DAAA
The synthetic routes for obtaining DAAA is outlined in Figure 2. The Aminoethylpiperazine (AEP) has two different amino groups, and both are reactive toward an anhydride. To avoid this reaction to make dimers, trimmers, and oligomers, a slightly more than two equivalents of AEP was used, and also the reaction temperature was maintained near zero. Based on the starting materials, a mixture of products with different positions were prepared and these mixtures were used as the aqueous phase of monomer in the membrane preparation without further purification.

Figure 2: Synthetic route of DAAA monomer.
According to the structures of DAAA, the presence of carboxylic acid and amino groups cause an amphoteric property of DAAA. In the solid phase, the carboxylic acids can protonate the amino groups and make a zwitterion. So, the DAAA is similar to an amino acid. Amino acids are in bipolar ions, so their IR spectra are consist of carboxylate and amino salts. Carboxylate salt has a strong asymmetric stretching peak near the 1600 cm-1 and a strong symmetric peak near 1400 cm-1. Amides carbonyl in the solid phase has the stretching bands in 1630-1680 cm-1 region. On the other hand, the bending bands of N-H for amine and secondary amide are appeared in 1560-1640 cm-1 and 1475-1560 cm-1, respectively. The overlap resultant of these bands is a broad peak at 1510-1750 cm-1 [17].
The N-H band of primary amine and amide has the strong stretching vibrations in 3300-3520 cm-1 and 3280-3300 cm-1, respectively. In DAAA component, the resulting stretching vibrations of the N-H band of primary amine, secondary amine, and primary amide is a broad peak at 3050-3650 cm-1. The appeared peaks in 2828 cm-1, and 2945 cm-1 are signs of aliphatic hydrogens in the DAAA structure (Figure 3).

Figure 3: The FT-IR spectrum of DAAA, and its starting materials.
1H-NMR spectra of DAAA in D2O, showed a range of peaks at 8.1-7.2 ppm, corresponds with aromatic and amide protons with the integration of 2.3 protons and a range of 3.7-2.8 ppm with the integration of 24, for aliphatic protons. Because of using D2O as the solvent, protons of carboxylic acids and amines can exchange with D2O, and just one peak appeared in HNMR at about 4.7 ppm (Figure 4). If we only had the structure shown on the spectrum, just one peak was appeared in the fragrant area. Therefore, it is clear that we had a mixture of products of similar structures.

Figure 4: 1HNMR spectrum of DAAA, in D2O.
Characterization of TFC membrane
The reaction of the synthesized diamine with the three-functional monomer, trimesoyl chloride, forms a porous network structure. The chemical structure and also surface properties of this thin layer were characterized by ATR, SEM, AFM, and contact angle [16].
ATR–IR spectrum: To investigate the reaction of DAAA with trimesoyl chloride on the Polysulfone Membrane Support (PSf), the ATR–IR spectrum was taken from the membrane surface before and after reaction (Figure 5 and Table 3). Despite the more similarities, there are two differences between the spectra. First, a weak and broad peak in 3300 cm-1, which is related to the N-H and O-H bond stretching and the other difference is a strong and sharp peak at 1618 cm-1, which is related to the C=O bond stretching of the amide. These two peaks confirmed the formation of polyamide layer on the PSf surface.

Figure 5: ATR-IR spectra of the PSf support (a) and the TFC membrane (b).
| Peak assignments | FTIR peaks (cm-1) | |
|---|---|---|
| PSf membrane | TFC membrane | |
| O-H (s)a and N-H (s) | - | ∼3300 |
| C-H (s) of methyl | 2968, 3066 | 2968, 3066 |
| N-H (b)b of amide and C=O (s) of amide | - | ∼1618 |
| C=C (s) of aromatic | 1487, 1585 | 1487, 1585 |
| C-H (b) of methyl | 1324 | 1324 |
| O=S=O (s) asymmetric | 1294 | 1294 |
| C-O-C (s) | 1243 | 1243 |
| O=S=O (s) symmetric | 1151 | 1151 |
| Note: a stretching, b bending | ||
Table 3: The significant peak assignment for ATR- IR spectra.
SEM: The SEM micrograph of polysulfone support before and after making the TFC layer are presented in Figure 6.

Figure 6: SEM images of the surface of the PSf support membrane (a) and the TFC layer (b).
Also, the cross-section of the PSf support and TFC membrane are presented in Figure 6.
Figure 7 Shows the PSf support membrane with a fingerstructure. The reaction between TMC and DAAA leads to the formation of the thin layer, and this layer is clearly observed in Figure 6.
The formation of a thin layer with a full shrinkage surface on the support membrane leads to increase the separation capability.

Figure 7: SEM images of the cross-section of the PSf support (a) and the TFC membrane (b).
AFM: The three-dimensional AFM images of the PSf support and composite membranes are shown in Figure 8.
The surface roughness parameters of the membranes which are expressed in terms of the average roughness (Sa), the rootmean- square roughness (Sq) and the mean difference between the five highest peaks and the five lowest valleys (Sz) were obtained by the software of SPM-DME and are presented in Table 4. These data indicate the formation of a rough layer on the surface of the support membrane.

Figure 8: AFM images of the PSf membrane surface (a) and TFC membrane (b).
| Membrane | Roughness | ||
|---|---|---|---|
| Sa | Sq | Sz | |
| PSf | 51.5 | 65.8 | 377 |
| TFC | 101 | 132 | 531 |
Table 4. Surface roughness parameters and contact angles of PSf support and TFC membranes.
Contact angles: The hydrophilicity of the surface could be detected by measuring the contact angle of the membrane surface by water. The results of the contact angle of the polysulfone surface before and after making the TFC layer are shown in Figure 9.

Figure 9: Contact angle images of the PSf membrane surface and TFC layer.
According to this figure, the contact angle is reduced with the formation of the thin layer on the surface of the PSf support membrane. This may be due to the presence of amide and carboxyl groups in the DAAA structure. The hydrogen interchange between tertiary amine and carboxylic acid in this structure is leading to the formation of the ammonium, and increased the hydrophilicity of the surface [18].
Analysis of variance for permeation and salt rejection
One of the most powerful strategies in the Taguchi method is the Analysis of Variance (ANOVA), which shows the percentage of contribution of effective factors to the response. The statistical evaluation of the results was done using the Qualitek-4 software.
The membranes were made based on Table 2, then the amount of permeation and salt rejection was determined in each test. In Table 5, the obtained results are presented for both responses.
| Trial | Permeation (L/h.m2) | Rejection (%) | ||
|---|---|---|---|---|
| Run#1 | Run#2 | Run#1 | Run#2 | |
|
1 |
65.79 |
68.85 |
47.7 |
37.1 |
|
2 |
47.43 |
49.47 |
68.8 |
63.4 |
|
3 |
40.8 |
39.78 |
68.3 |
71.8 |
|
4 |
42.84 |
44.37 |
74.2 |
68.9 |
|
5 |
34.17 |
35.19 |
86.5 |
88.1 |
|
6 |
37.74 |
39.27 |
84.2 |
77.4 |
|
7 |
38.76 |
40.29 |
85.2 |
81.5 |
|
8 |
37.74 |
36.72 |
86.8 |
87.9 |
|
9 |
33.15 |
31.11 |
95.8 |
93.9 |
Table 5: The results of permeation and salt rejection.
The ANOVA analysis based on both responses was done individually, and the results were represented in Tables 6 and 7.
| Factors | DOFa | Sum of squares | Variance | F-ratio | Pure sum | Contribution (%) |
|---|---|---|---|---|---|---|
| A | 2 | 14.688 | 7.344 | 31.723 | 14.225 | 49.761 |
| B | 2 | 9.62 | 4.81 | 20.779 | 9.157 | 32.035 |
| C | 2 | 4.002 | 2.001 | 8.644 | 3.539 | 12.381 |
| D | 1 | 0.043 | 0.043 | 0.188 | 0 | 0 |
| Other/error | 1 | 0.23 | 0.23 | - | - | 5.823 |
| Total | 8 | 28.586 | - | - | - | 100 |
| a Degree of freedom. | ||||||
Table 6: ANOVA table for permeation.
| Factors | DOFa | Sum of squares | Variance | F-ratio | Pure sum | Contribution (%) |
|---|---|---|---|---|---|---|
| A | 2 | 22.487 | 11.243 | 15.348 | 21.021 | 56.617 |
| B | 2 | 9.339 | 4.669 | 6.374 | 7.874 | 21.07 |
| C | 2 | 4.267 | 2.133 | 2.913 | 2.802 | 7.547 |
| D | 1 | 0.303 | 0.303 | 0.413 | 0 | 0 |
| Other/error | 1 | 0.732 | 0.732 | - | - | 14.628 |
| Total | 8 | 37.13 | - | - | - | 100 |
| a Degree of freedom. | ||||||
Table 7: ANOVA table for rejection.
A significant criterion to sort factors by their effects is the Fratio that is shown in the ANOVA table. The factors with high calculated F-ratio have greater effects on the experimental results. Moreover, if the percentage contribution of a factor would be less than or equal to 10% of the most effective factor, this factor should be pooled into the error terms.
According to Tables 6 and 7, it is clear that the most significant factors affecting the results are the concentration of DAAA monomer (A) and pH (B).
In the ANOVA table, the curing time (D) has a negligible effect on the responses. Therefore it should be pooled into the error term, with a 90 percent confidence level.
The other/error part, in the last row of ANOVA tables, contains three main sources, including the errors related to the unreliability of the measurement instrument, factors which are not considered in the experiments, and uncontrollable factors. As Tables 6 and 7 show, the estimated error related to permeation and salt rejection responses was about 6% and 15%, respectively, which was sufficiently far from the limit and means the experiment error is not important. In the following sections, the effects of the most significant factors on permeation and salt rejection are studied, comprehensively [19].
Effect of the factors on the membrane performance
The trends of variation in permeation, and salt rejection (regarding S/N ratio) are affected when the four mentioned factors are changed on their levels (Figure 10)

Figure 10: Effect of factors: (a) concentration of DAAA monomer, (b) pH, (c) reaction time, (d) curing time on permeation and rejection.
Effect of concentration of DAAA monomer: The effect of concentration of DAAA monomer on permeation and salt rejection is observed in Figure 10(a).
Increasing the concentration of DAAA monomer in the aqueous phase, increase the diffusion rate of the monomer from aqueous to the organic phase. This phenomenon causes a fast formation of a dense layer on a surface of the support membrane. In levels 1 to 2, the structure of the TFC membrane has been formed, so the permeation graph shows a sharp decrease. In levels 2 to 3, despite the more intensive layer of PA, there is not an obvious decrease in the slope of the permeation graph, which can be due to the increase of amine and carboxylic acid groups, which make an increment in the hydrophilicity of layer.
On the other hand, increasing the density of the thin layer decrease the free volumes between the polymer chains, so the transition of the hydrated ions become so difficult. Accordingly, the percent of salt rejection increases.
Effect of pH: The Hydrogen Chloride (HCl) is a side product in the IP reaction between DAAA and TMC. So, the presence of the HCl prevents the reaction progress. Accordingly, increasing the pH of the reaction media makes a more condensed structure of the thin layer which causes the permeation to decrease. So, the percent of the salt rejection will increase.
A noticeable point of view is that the pH has an optimum value in most articles. This optimum value of pH is about 9, which is due to the hydrolysis of the acyl chlorides to the carboxylic acid groups. So, the thickness of the layer decreases, and the permeation increases. But, in this work, the presence of ammonium groups in the membrane structure reduces the permeability of the membrane until pH=11. These ammonium groups, which have been formed by giving acidic hydrogen from the carboxylic groups, loos their protons in the presence of hydroxyl groups in the basic condition.
Effect of reaction time: It is expected that the increasing of reaction time increases the thickness of the membrane because of the IP reaction progress. Also, the permeation decrease and the salt rejection percent increase, strongly. But, according to the ANOVA tables, the reaction time has the lower effect on the membrane performance than to other factors (concentration of DAAA monomer and pH), which was discussed. The most IP reaction progress has been done in the first seconds (below 30 s). After 30 s the formation of the thin layer on the support membrane decreases the diffusion rate of the DAAA monomer from aqueous to the organic phase. So, the permeation decreases and the salt rejection increase.
Effect of curing time: Although, the post-treatment increases the cross-linking degree of TFC membrane structure, and reduces the free volumes and increase the salt rejection percent, however, the shows that the increase of the curing time from 5 min to 10 min at 80°C has no sensible effect on the membrane efficiency. The reason is that the cross-linking reaction is take place at first 5 min, and the more curing time has no influence on the amount of cross-linking degree [20].
Results optimization: Due to existing two individual responses (permeation and rejection) and inversion of parameter effects trend, to achieve the optimum conditions, an Overall Evaluation Criterion (OEC) is defined according to the Taguchi method.
In this research, the optimum conditions (the best levels of factors) have been obtained for the best membrane performance.
The goal of this research is getting the permeation and salt rejection as high as possible.
Thus, the problem is maximizing the new modified response (OEC). For this purpose, the following equation is defined for getting to maximum OEC:
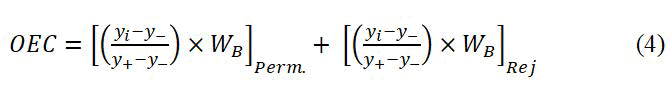
Where, i, -, and + subscripts refer to the trial number (1–9), the worst response, and the best response, respectively (each for permeation and rejection).
Since the nanofiltration type membranes have relatively high (good) permeation, enhancement of the salt rejection percent has more importance work. Therefore the terms [WB]Perm.(40%) and [WB]Rej. (60%) are the corresponding weight factors for contributions of these responses to achieve the optimum condition.
According to equation 4, the values of each OEC were determined and the results were brought in Table 8.
| Trial | OEC | |
|---|---|---|
| Run#1 | Run#2 | |
| 1 | 47.59 | 40 |
| 2 | 49.69 | 46.34 |
| 3 | 42.16 | 44.65 |
| 4 | 50.35 | 46.55 |
| 5 | 53.73 | 56.45 |
| 6 | 55.17 | 49.84 |
| 7 | 57.27 | 55.11 |
| 8 | 57.82 | 57.87 |
| 9 | 62.16 | 58.05 |
Table 8: The OEC response for experimental data.
The ANOVA results for the Overall Evaluation Criteria (OEC) are shown in Table 9. According to ANOVA results for the OEC, the concentration of DAAA monomer is the most significant factor (Table 10).
| Factors | DOFa | Sum of squares | Variance | F-ratio | Pure sum | Contribution (%) |
|---|---|---|---|---|---|---|
| A | 2 | 7.554 | 3.777 | 11.035 | 6.87 | 77.384 |
| B | 2 | 0.858 | 0.429 | 1.254 | 0.174 | 1.961 |
| C | 2 | 0.045 | 0.022 | 0.066 | 0 | 0 |
| D | 1 | 0.077 | 0.077 | 0.225 | 0 | 0 |
| Other/error | 1 | 0.342 | 0.342 | - | - | 20.658 |
| Total | 8 | 8.878 | - | - | - | 100 |
| a Degree of freedom. | ||||||
Table 9: ANOVA table for the OEC response.
| Factors | A | B | C | D |
|---|---|---|---|---|
| Level | 3 | 2 | 2 | 2 |
Table 10: Shows the values for the quality parameters obtained in the optimum condition of membrane performance.
According to calculations using Qualitek-4 Software, the point has the S/N ratio in 35.85 ± 0.70 in the precision of 90%. The intended membrane has been made with the mentioned conditions and the permeation and salt rejection percent have been measured. The results have been brought in Table 11. It was shown that the prepared membranes in the optimum condition are in the mentioned range [21].
| Permeation (L/h.m2) | Rejection (%) | OEC | S/N | |||
|---|---|---|---|---|---|---|
| Run#1 | Run#2 | Run#1 | Run#2 | Run#1 | Run#2 | |
| 34.68 | 33.66 | 91.8 | 93.4 | 59.7 | 60.25 | 35.56 |
Table 11: Results of optimum membrane performance.
Conclusion
In this work, a new diamine consist of amic acid groups was introduced. TFC membrane has been prepared with the IP of this synthesized diamine and TMC on microporous PSf supporting membrane. The results of the investigation of the prepared membrane are summarized as follow:
- A comparison between the SEM and AFM images before and after the IP process shows the formation of a thin layer with relatively high roughness on the surface of the PSf membrane.
- High hydrophilicity of the surface (which is the result of DAAA and TMC polymerization) is an obtained using contact angle test.
Finally, membrane performance was studied by Taguchi method; the results are summarized as follow:
The concentration of DAAA monomer and pH has the highest effect on the membrane performance.
Where the reaction time has the slight effect on these processes, and curing time was inefficient.
• Since the permeation and salt rejection have two different optimum conditions; the OEC method was used to determine the optimum conditions.
• The operating conditions in optimum performance were obtained as follow: concentration of DAAA monomer=3% (w/v), pH=9, reaction time=60 s and curing time=10 min. Under these conditions the permeation and salt rejection were determined to be 34.17 (L.h.m) and 92.6%, respectively.
References
- Oulad F, Zinadini S, Zinatizadeh AA, Derakhshan AA. Fabrication and characterization of a novel tannic acid coated boehmite/PES high performance antifouling NF membrane and application for licorice dye removal. Chem Eng J. 2020;397:125105.
- Eray E, Candelario VM, Boffa V, Safafar H, Ostedgaard-Munck DN, Zahrtmann N, et al. A roadmap for the development and applications of silicon carbide membranes for liquid filtration: Recent advancements, challenges, and perspectives. Chem Eng J. 2021;414:128826.
- Ghalavand A, Hatamipour MS, Ghalavand Y. Performance evaluation of a multi-stage humidification compression with heat recovery based on mathematical modeling. Desalination. 2021;515:115189.
- Ghalavand A, Hatamipour MS, Ghalavand Y. Clean treatment of rejected brine by zero liquid discharge thermal desalination in Persian Gulf countries. Clean Tech Environ Pol. 2021;23:2683-2696.
- Javed S, Aljundi IH, Khaled M. High fouling-resistance of polyamide desalination-membrane modified with PEI/PAH polyelectrolyte multilayers. J Env Chem Eng. 2017;5(5):4594-4604.
- Abedi M, Ghalavand Y, Ghalavand A. Mathematical modeling of double-stage humidification compression desalination: Series and parallel configurations. Energy Conversion and Management. 2021;239:114210.
- Jahangiri F, Asadollahi M, Mousavi SA, Farhadi F. Improvement of performance of polyamide reverse osmosis membranes using dielectric barrier discharge plasma treatment as a novel surface modification method. Poly Eng Sci. 2019;59(S1):E468-E475.
- Chae HR, Kim IC. Enhancement in permeability of piperazineâ?based thinâ?film composite membrane via surface roughening using a highly organicâ?soluble additive. J App Poly Sci. 2019;136(36):47913.
- Hadadpour S, Tavakol I, Shabani Z, Mohammadi T, Tofighy MA, Sahebi S. Synthesis and characterization of novel thin film composite forward osmosis membrane using charcoal-based carbon nanomaterials for desalination application. J Env Chem Eng. 2021;9(1):104880.
- An Q, Li F, Ji Y, Chen H. Influence of polyvinyl alcohol on the surface morphology, separation and anti-fouling performance of the composite polyamide nanofiltration membranes. J Memb Sci. 2011;367(1-2):158-165.
- Bai L, Liu Y, Ding A, Ren N, Li G, Liang H. Fabrication and characterization of thin-film composite (TFC) nanofiltration membranes incorporated with Cellulose Nanocrystals (CNCs) for enhanced desalination performance and dye removal. Chem Eng J. 2019;358:1519-1528.
- Lianchao L, Baoguo W, Huimin T, Tianlu C, Jiping X. A novel nanofiltration membrane prepared with PAMAM and TMC by in situ interfacial polymerization on PEK-C ultrafiltration membrane. J Memb Sci. 2006;269(1-2):84-93.
- Mansourpanah Y, Madaeni SS, Rahimpour A. Fabrication and development of interfacial polymerized thin-film composite nanofiltration membrane using different surfactants in organic phase; study of morphology and performance. J Memb Sci. 2009;343:219-228.
- Saha NK, Joshi SV. Performance evaluation of thin film composite polyamide nanofiltration membrane with variation in monomer type. J Memb Sci. 2009;342(1-2):60-69.
- Peyravi M, Jahanshahi M, Rahimpour A, Javadi A, Hajavi S. Novel thin film nanocomposite membranes incorporated with functionalized TiO2 nanoparticles for organic solvent nanofiltration. Chem Eng J. 2014;241:155-166.
- Cheng X, Qin Y, Ye Y, Chen X, Wang K, Zhang Y, et al. Finely tailored pore structure of polyamide nanofiltration membranes for highly-efficient application in water treatment. Chem Eng J. 2021;417:127976.
- Behdarvand F, Valamohammadi E, Tofighy MA, Mohammadi T. Polyvinyl alcohol/polyethersulfone thin-film nanocomposite membranes with carbon nanomaterials incorporated in substrate for water treatment. J Env Chem Eng. 2021;9:104650.
- Morgan PW, Kwolek SL. Interfacial polycondensation. II. Fundamentals of polymer formation at liquid interfaces. J Pol Sci. 1959;40(137):299-327.
- You X, Xiao K, Yu Q, Wu H, Yuan J, Zhang R, et al. Fouling-resistant robust membranes via electrostatic complexation for water purification. Chem Eng J. 2021;416:129139.
- Xie Q, Zhang S, Hong Z, Ma H, Zeng B, Gong X, et al. A novel double-modified strategy to enhance the performance of thin-film nanocomposite nanofiltration membranes: Incorporating functionalized graphenes into supporting and selective layers. Chem Eng J. 2019;368:186-201.
- Lin Y, Shen Q, Kawabata Y, Segawa J, Cao X, Guan K, et al. Graphene quantum dots (GQDs)-assembled membranes with intrinsic functionalized nanochannels for high-performance nanofiltration. Chem Eng J. 2021;420:127602.
Citation: Koohmareh GA, Ghalavand B, Malekpour A (2025) Preparation, Characterization, and Taguchi Optimization of Poly (Amide/Amic acid) Thin Film Composite Membrane. Modern Chem Appl. 13:485.
Copyright: © 2025 Koohmareh GA, et al. This is an open access article distributed under the terms of the Creative Commons Attribution License, which permits unrestricted use, distribution, and reproduction in any medium, provided the original author and source are credited.