


Indexed In
- Open J Gate
- Genamics JournalSeek
- JournalTOCs
- China National Knowledge Infrastructure (CNKI)
- Electronic Journals Library
- RefSeek
- Hamdard University
- EBSCO A-Z
- OCLC- WorldCat
- SWB online catalog
- Virtual Library of Biology (vifabio)
- Publons
- MIAR
- Euro Pub
- Google Scholar
Useful Links
Share This Page
Journal Flyer

Open Access Journals
- Agri and Aquaculture
- Biochemistry
- Bioinformatics & Systems Biology
- Business & Management
- Chemistry
- Clinical Sciences
- Engineering
- Food & Nutrition
- General Science
- Genetics & Molecular Biology
- Immunology & Microbiology
- Medical Sciences
- Neuroscience & Psychology
- Nursing & Health Care
- Pharmaceutical Sciences
Research Article - (2019) Volume 10, Issue 4
Predicting Performance Of High Deliverability Horizontal Gas Wells And Control Of Water Cresting In Tertiary Sands East Africa
John Michael Tesha1,2, Ferney Moreno2, James McLean Somerville1,3,4* and Saood Qaseem52BG Group (UK), Royal Dutch Shell, Thames Valley Park, Reading, Berkshire, RG6 1PT, UK
3Research Centre and Themes Energy Academy, UK
4Edinburgh Research partnership in Engineering, UK
5State Key Laboratory of Separation Membranes and Membrane Processes, National Centre for International Joint research on Separation Membranes, Tianjin Polytechnic University, School of Materials Science and Engineering, 300387 Tianjin, China
Received: 22-Jun-2019 Published: 30-Jul-2019
Abstract
The field-A1 is an offshore gas field located about 56 km from the coast of East Africa with the water depth of 1153 m. The permeability distribution varies across different layers with an overall permeability of 680 m and porosity distribution for the reservoir field-A1 varies 0.21-023. The reservoir thickness also varies up to 50 m thick. This research work identifies parameters that will contribute to the impact of water coning. Simulation sensitivities are run to observe the effect of water coning/cresting in horizontal gas wells and predicting the performance of these wells using Petrel simulator. Results have shown that put horizontal well in East-west will have early water breakthrough and not recommended due to the impact of edge aquifer due to less recovery compared to north-south and original wells orientation (northwest-southeast). The varying height of perforation and standoff as identified is at the standoff between 30-40 m in the field-A2 will delay water coning high recovery with more extended plateau length period. The gas recovery may happen to be low, due to the distribution of permeability layer for the horizontal wells and low productivity index that is the performance of the well. Rate-dependent skin and mechanical skin evolution in time show that increasing non-Darcy /turbulence factor reduces the performance of the well and decreases gas recovery the high drawdown tendency is observed before water breakthrough time however there is early water breakthrough, thus use of deep penetration. Horizontal gas wells have a constant horizontal length for all cases of 300 m increasing tubing head pressure from 40-100 bars result to decrease plateau length period of the gas production, low water production rate, and low gas recovery. Varying the kv/kh ratio from 0.1, 0.6 to 1 shows early water breakthrough by 6 months earlier from the base case with 0.1 hence will not delay water coning. The gas recovery is reduced by 5%. Gas recovery is increased with an increase in gas rates constrain, and early water breakthrough is observed when producing at high rates. Producing at low rates may delay water coning. However, it is not economical since there is less gas recovery and may take a more extended period for production to reach to its total maximum gas production of which is less compared when producing at high gas rates. There is a stronger of the aquifer from the west side, which is predictable to cause water coning than on the east side. This aquifer impacts the gas recovery reduction by 19%, with water coning radial extension of 1.7 km and peak water production rate for 16 years. The aquifer influx rate is seen to be increased by 69% when the aquifer volume is double. Therefore, from the results producing at a high rate that has high recovery before the impact of aquifer or water has occurred to the wells, known as outrunning of the aquifer. To avoid water coning, using advance completion technique such as inflow control devices (ICD), installing a down hole gauge. Also, it is essential not to perforate if well is near to gas water contact the horizontal wells should be located at maximum distance from gas water contact to maximize gas recovery. Not only that but also use of fully open choke allows much water production rate increase, which leads to water coning.
Keywords
Horizontal gas wells; Water cresting; Reservoir modelling and simulation; Gas Production; Rate dependent skin
Abbrevations
Aquifer AOI: Aquifer Area of Interest; BG: British Gas; D: Turbulence Coefficient; GG1_H_E_W: Horizontal well located at original well GG1_Ref at orientation East West; GG1_H_N_S: Horizontal well located at original well GG1_Ref at orientation north-south; GG1_Ref: Original well suggested by Geologists and geophysicists at standoff 30 m; GG1_Vert: Vertical well located at the location of original GG1_Ref well; GG2_H_E_W: Horizontal well located at original well GG2_Ref at orientation East West; GG2_H_N_S: Horizontal well located at original well GG2_Ref at orientation north-south; GG2_Ref: Second original well suggested by geologists and geophysicists at standoff 30 m; GG2_Vert: Vertical well located at the location of original GG2_Ref well; GIIP – Gas Initial In Place; GRV: Gross Rock Volume; GWC: Gas Water Contact; krg: Gas relative Permeability; krw: Relative Permeability of water; kv/kh: Vertical permeability to horizontal permeability ratio; LNG: Liquefied Natural Gas; MD: Measured Depth; PI : Productivity Index; PVT: Pressure Volume Temperature analysis; RDS: Rate Dependent Skin; Sg: Gas saturation; Sm3: Standard cubic meter; Sm3/d – Standard cubic meter per day; SO – Standoff (Distance from gas water contact) SPE: Society of Petroleum Engineers SQRT(PI): Square root of productivity index THP – Tubing Head Pressure Tscf: Trillion Standard Cubic feet; TVD – True Vertical Depth; TVDSS: True Vertical Depth Subsea; VLP: Vertical Lift Performance; W.B.T: Water breakthrough Time
Introduction
Substance and alcohol abuse is an important issue worldwide [1]. It has a strong relationship with financial, social and emotional problems [2,3]. Water cresting in horizontal gas wells is a problem to gas fields around the world has also been identified to different literature surveys. Water coning in gas wells reduces the recovery factors and increase water production volumes, these two parameters have an economic impact on field development such as low recovery factor and high investment of water handling such as the use of separators, compressors, etc. Historically using the horizontal well increases development production even to a bottom-water and edge aquifer reservoir but water cresting leads to the problem also to homogeneous and uniform, bulk sand gas reservoirs (high-class gas reservoir), this is because of early water breakthrough which leads to increase in water cut and reduce gas production. The decrease in gas production and water handling and processing cost rise, which is not economically advisable for an investment of a gas field. This situation also has a negative influence on the gas reservoir development plans.
The other problem to think about on water producing wells may lead to deposition of scale that is deposits of inorganic scale are developed, and hence scales may coat casing, perforations, production tubes, pumps, valves, and any other completion and production equipment such as gas lift mandrels. If continual water production, this scaling will reduce production, eventually leading to abandoning the well. Water in production wells problems in a high-class reservoir can also be due to other causes including depletion of the bottom and edge aquifer, improper well design and construction, failure of equipment and corrosive qualities of water. Identifying the causes enable to arrive stepwise and numerical simulations to solve the problem of producing water to a geological model example outrunning the aquifer that means (producing at very high rates to remove all gas before water breakthrough in the reservoir). This research work recognizes this problem and selects the appropriate course of action, or how to tackle the problem, technical assistance from the numerical simulator consultants is valuable.
Based on the geological model of given gas field (Field-A) on the data gathered during the appraisal stage, this research is aim to identify parameters that may have impact on water cresting for horizontal gas wells completed with gravel pack and changing other parameters like well orientation aquifer size, height above perforation, ratio of vertical permeability to horizontal permeability (kv/kh), that will accelerate or delay the impact of water production, as well as impact with the aquifer at high production rates, subsequently determine the impact of gas recovery. In general, all the reservoirs are characterized as high quality- homogenous reservoirs. The discoveries of Field-A is Paleocene geological age regional setting tertiary period sand and can be divided into two fields separated by stratigraphic sealing between two reservoirs with different contact as a sign of compartmentalization. The depositional system in Field-A1 where this research work will concentrate is in the north, is a mainly confine channel sandstone with reservoir thickness of around 50 m and with second Field-A2 in the south recognized as the main field with reservoir thickness of 114.2 m although there is a variation of reservoir thickness to 44.9 m.
Field-A2 can be defined, as a high-quality gas reservoir comprise in multiple structural segments and vertically stacked in discrete depositional sequences. It is believed that an edge and bottom aquifers influence this reservoir. Both reservoirs were deposited in the same environment deep marine, clean sand and due to the variation in the reservoir thickness, pressure (4878 psi from well test), permeability (680 mD), aquifer pore volume for Field-A1 is 0.3 km3 and Field-A2 is 1.0 km3 this make the aquifer pore volume of clean sand inside the Field-A 1.3 km3 of gross rock volume GRV 6.5 km3 and other geological properties among the reservoir models for the different reservoirs is built to minimize water cresting and outrunning aquifer. This research will not focus mainly on the reservoir quality for this particular gas fields instead using rate dependent skin to reduce an effect of coning and test other parameters mentioned earlier that may have an impact of water and/or accelerates or delay water coning for the optimized gas production rate.
Studies like SPE 12068 [1] “Develops an analytical solution for water coning in gas wells and provide guideline”, but the paper did not take into account numerical solution based on rate dependent skin also other papers which develops numerical simulations based on their assumptions example SPE 107169 [2] “Not clear on producing high rate as the best recovery strategy in gas reservoir”, they base on rate sensitivities base on the assumptions of the constant porosity, reservoir as a grid of equal square box, and not consider effect of near wellbore turbulence or non-Darcy flow behaviour. And other essential works of literature I have discussed in the first chapter that is carried on this topic, but rate dependent skin effect to water coning was not seen, change permeability with depletion (overburden pressure) and increase on mechanical damage impact on the water coning.
The critical parameter is the rate dependent skin and mechanical skin evolution in time for high productivity horizontal gas wells that have been completed with a gravel pack. Therefore, as part of the scope of this research is that the performance of the horizontal gas wells and water cresting control will be studied by reservoir simulator (Petrel-2013), running cases to evaluate the impact on a set of the parameter that has been chosen for the evaluation or analysis.
Horizontal well
Joshi defined horizontal well as the well with an inclination angle of 90 degrees for producing oil and/or gas designed with build-up rate range from 2 up to 150 degrees per 100 ft depending on the radius and horizontal drain.
Drilling horizontal wells are essential to maximizing gas production compared to vertical wells as well as to reduce near wellbore turbulence in high and low permeability reservoir. The economic success with the horizontal wells not only large with reserves but also the production is of the short period compared to vertical wells [3]. Although this history may be the case, in high permeability and thick reservoirs, the recovery per well between horizontal and vertical well is very similar. Joshi [3] identify another critical objective of drilling the horizontal gas well is that it is possible to intersect almost vertical multiple pay zones compared to vertical well. Thus, it is vital to predict or analyze the horizontal gas well performance and its deliverability. The productivity of horizontal gas well also depends on well length and completion techniques. The challenges that are observed to the horizontal wells, including for single horizontal well can only be drained from one pay zone through the horizontal wells used to drain gas from multiple layers. The other difficulty is the cost of drilling horizontal gas wells and the cost of its completion, which is higher than vertical wells.
Non-Darcy flow behavior
High rate gas wells are affected by non-Darcy flow behavior, and this flow near to the sand face in gas wells is the origin of the rate dependent skin effect. Non-Darcy flow behavior varies due to the reservoir characteristics (permeability thickness kh) and type of completion. Non-Darcy skin is the component of the total skin increases at a high rate in the wells, which have high non-Darcy skin.
Darcy flow relationship does not take into consideration the effect of pressure drop and developed at low fluid velocity, however, and additional non-Darcy flow term needed to be included to the relationship taking into account high fluid velocities at near wellbore region [4]. This additional term accounts the fluid flow in pore spaces due to turbulent nature. There are three methods of determination of non-Darcy skin which are; from existing correlations based on laboratory experiments, from analysis of well tests and experimental measurements. Between these methods, well testing is expected to give more reliable results as this non- Darcy skin is obtained in-situ for specific completion of the well and reservoir characterization.
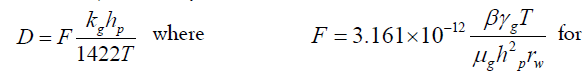
Forchheimer’s work suggests gas inflow equation for real gas pseudo pressures as follows [5].
Where,

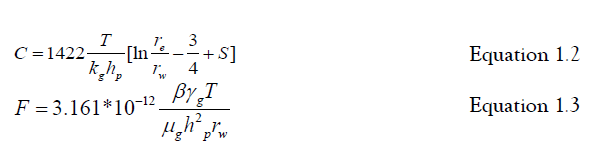
Notations
m(Pr)=Dimensionless real gas reservoir pressure
m(Pwf)=Dimensionless real gas bottom hole flowing pseudo pressure
Q=Production rate, (Mscf/d)
T=Temperature (°R)
kg=Permeability to gas, (mD)
hp=Interval Perforation, (ft)
re=Reservoir Drainage radius, (ft)
rw=Wellbore radius, (ft)
S=Skin factor
β=Turbulence factor (inertia coefficient or beta factor), 1/ft
D is Turbulence coefficient/factor (in terms of 1/Mscf/d) or Non- Darcy factor
DQ is rate dependent skin factor or Turbulence skin, which accounts the pressure drop in the wellbore region because of high gas velocity. (e.g. 100-270 sm3)
It has also been suggested and analyzed that D is due to non- Darcy flow behavior by Schell and Meehan [6], SPE 12176, he "analysed the rate dependent skin in gas wells by three build-up tests and isochronal test" and arrived into conclusion that "the scale formation causes the skin due to completion and rate dependent skin".
Studies example SPE 68144 or SPE 68684 [7,8] have shown that skin factor that is obtained from well test can indicate the flow efficiency of the well. Rate-dependent skin is due to non-Darcy flow behavior as shown in equation 1.5 and is a function of formation damage skin, completion and perforation skin, and well deviation. Also, for highly permeability reservoirs the rate dependent skin is high due to high flow rate as well as with low permeability reservoir, this rate dependent skin becomes low.
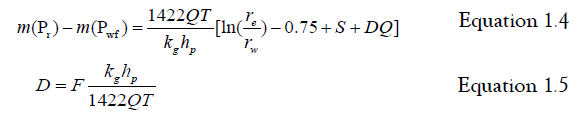
This is often known as Non-Darcy skin or turbulence induced skin can also be expressed in another coefficient known as beta factor (also is called turbulence factor or inertia coefficient) base on laboratory experiment as the following equation,
The rate-dependent skin is a component of the total skin, and the sum of the true skin and rate dependent skin factors results in the total skin factor. To determine non-Darcy skin involves three conventional methods, which are; from existing correlations based on laboratory experiments, from analysis of well test as previously stated and experimental measurements [4].
BG previous drilled gas wells have observed that non-Darcy skin increases with the product of permeability and thickness (kh) characteristic, which was supposed to decrease with kh theoretically. This is thought that non-Darcy behavior could be influenced not only with and k but another factor like pore throat size thus result in uncertainty estimation of non-Darcy skin. This will not only increase effective wellbore radius but also will avoid non-Darcy behavior increase that is created from in gravel pack [9].
There is a need for correction of non-darcy coefficient D and skin from the exploration and appraisal well tests considering completions to obtain accurate values for development of the field. This becomes important for gas reservoirs with high transmissibility and correlates with the D coefficient from theoretical calculations [10].
Suggestion for using extrapolated pressure matching with simulated pressure to a pressure transient in well testing then plot the obtain slope from the plot of reduced total skin versus gas flow rate, taking into consideration number of development wells decreased over the period due to an increase of well deliverability prediction. Example is 15% reduction for over 20 year’s period seen from this study. To this work, total skin was corrected during well test analysis; therefore, no need for correcting Non-Darcy coefficient D by matching pressure test.
Permeability change due to overburden
Permeability is known to be a measure of the ability of fluid to flow through porous rock, there are numerous factors that possibly will affect magnitude and direction permeability like overburden pressure is one of them, the other factors including; textural properties (grain size and distribution), gas slippage, secondary porosity, reactive fluids and high velocity flow effect [11].
The overburden pressure is due to the pressure of the rock that is transmitted through the subsurface grain to grain contact. The reservoir that is subjected to overburden pressure, which is equivalent to about 1 psi/ft of depth is due to the weight of formation above the reservoir. Studies example [5,11] have indicated the pore pressure (pressure in the pore space) does not approach overburden pressure, which is about 0.5 psi/ft. If the reservoir sands are high unconsolidated, the pore pressure becomes high as the overburden pressure is transmitted to the fluids in pore space [5]. Permeability is decreased with an increase of confining pressure that also indicates it reduces the ability to transmit fluids through porous media. Therefore, this overburden pressure shows permeability reduction magnitude, as Figure 1 illustrates this permeability reduction with an increase of overburden pressure [11].

Figure 1: Permeability depletion measured for Field-A1.
As shown from Figure 1, studies have indicated that in unconsolidated or poorly consolidated rocks have higher reductions of permeability under confining pressure. Therefore, higher reduction in permeability is affected in low permeable rocks than highly permeable rocks example for permeability rock higher than 10 mD the decline due to overburden is low compared when permeability rock is less than 5 mD.
Outrunning the aquifer
An aquifer is the water-bearing rocks that surround the hydrocarbon reservoirs, and this aquifer size may is either be small in proportion to neglect its effect towards the reservoir performance or large. During production as hydrocarbons produced from the reservoir, the reservoir pressure is decreased, and the differential pressure is created between a surrounding aquifer and the reservoir. Ahmed [12], he explained this idea in water influx that for high permeability rocks, there is an occurrence water influx in the reservoir aquifer system as the reservoir is depleted.
The rate of water that comes into the reservoir is influenced by three flow regimes which are commonly known as the steady state, semi-steady (Pseudo steady) state and unsteady state. Studies like [12,13] SPE 19068 have shown reservoir aquifer system is classified based on flow geometry, and simulation model can be built to run cases for recovery optimization, these classes including Edgewater aquifer, Bottom-water aquifer, and Linear-water aquifer. The described Field-A in this work is classified to have bottom-water aquifer and Edge-water aquifer.
Edge-water aquifer; during production, it is observed that water tend to move in radial direction flow neglecting the vertical direction flow and pressure drop is at the aquifer and reservoir boundary as shown in the Figure 2, the only difference between Bottom-water aquifer and Edge-water aquifer is that Bottom-water aquifer flow is radial and has a significant vertical flow, this occurs in a reservoir with a large area, and gentle dip as contact between reservoir and water underlies reservoir entirely as shown in Figure 2.

Figure 2: Example of edge-water aquifer and bottom-water aquifer showing flow geometries.
Outrunning of the aquifer, hydrocarbons example gas is produced at high production rate for more less period than standard low production flow rate and the recovery is much higher compared to average production, occur before water breakthrough to the production well. The critical reason for outrunning of an aquifer is to ensure that all hydrocarbons have been recovered during production by the time water expanding from aquifer towards a production well due to differential pressure, no gas is left back to low permeable layers as water finds easier to flow through high permeable layers.
Producing gas normal at low production rate, delays water breakthrough time to the production well as the water expanding from aquifer due to differential pressure between surrounding of aquifer and reservoir, but this also has low recovery compared to the outrunning of aquifer because gas is left back to low permeable layers as water finds it more comfortable to flow through high permeable layers to reach production well.
Studies example from SPE 107169 termed the outrunning of the aquifer as "the volume of gas that is trapped at high pressure by the advancing water for the gas reservoir with water drive mechanism producing at high rates." From his work, he suggests that this outrunning aquifer eliminates the effect of coning for vertical wells and leads to an increase of risk for early water breakthrough time. The only case where outrunning of aquifer gives higher recovery is when we have a higher ratio of vertical permeability to horizontal permeability (kV/kh) low (<0.01), and the reservoir has strong aquifer support.
He continued explaining that on producing at high rates by outrunning the aquifer does not give higher recovery for bottomwater aquifer reservoir system unless situation for horizontal well by outrunning basal aquifer which is of no benefit. Therefore, his work ended up by taking into account reservoir heterogeneity to stop water cresting in higher gas recovery rather than outrunning of aquifer production at a high rate.
Water coning/cresting in a gas reservoir
Water coning commonly known in vertical wells as well as water cresting in horizontal wells reducing gas production in the gas reservoir by infiltrates the perforation zone in near wellbore area and should not be confused from water production which is the rise of water/gas contact from water influx.
Studies have indicated that water cresting in oil and/or gas wells is a rate-sensitive phenomenon associated with high producing gas rates and is predicted by methods using critical rate. Hampson et al. [2] The theory from studies shows that at producing at the rate below the critical rate, the coning/cresting tendency will not reach perforation as well as when producing at rate higher than critical rate, fluid production will increase with time and growing trend fors cresting/coning [14].
However, this technique based on the critical rate cannot tell when the water breakthrough will occur and do not predict the water gas ratio after water breakthrough unless for stated assumptions.
It should also be clear that water cresting in oil reservoir with the gas cap or oil reservoir without a gas cap is different from the gas reservoir, this is because of the density difference between gas and oil usually higher than density difference between water and oil, and it applies to interfacial tension.
Also, gas viscosity is lower than oil viscosity; therefore, the gas flow rate will be higher than the oil flow rate. As shown from Figure 3, there are several reasons for water coning available in different kinds of literature, and the main reason is the pressure drawdown and the perforation intervals in near to gas water contact. Studies have also indicated that with higher pressure drawdown near wellbore conning effect will be highly seen through to achieve a given production in low permeability reservoir, higher drawdown is used compared to high permeability reservoir [3]. Environment Considerations on cresting/coning process is important in a sense that disposing high volume of water may have high contents of alkalinity, salinity.

Figure 3: Water cresting/coning in horizontal and vertical gas wells and Petrel model showing water coning.
Fines migration
Water production can limit gas horizontal well productivity and can cause a severe problem like fines migration [3].
Fines are materials such as silts (composed of silicates or aluminosilicates with the size range from 4 to 64 microns), clays (this is phyllosilicates smaller than 4 microns) causing permeability reduction. Field studies and laboratory works have shown that because of mobile fines are made of a wide variety of minerals, and the clay content in the reservoir is not always a good indicator of water sensitivity of the formation [15]. Fines movement or quartz particle and similar materials movement in the reservoir due to drag force during production is known as fines migration. Studies have indicated that this fine migration result from unconsolidated formations and fines particles liberated from an incompatible treatment of the fluid. During production, well productivity is reduced as fines movement causes particles suspended in the produced fluid to bridge the pore throat near the wellbore considered as the source of formation damage [16].
Kaolinite and illite are well known migrating clays, and the damage created by fines is about is near to the wellbore and also happen to the gravel pack completions. The fines movement is mostly controlled and due to wet ability state of the fines, fluid wetting phase flow velocity and nature of fines in sand grain surface and its concentration in the pore [16]. Most oil and gas industries use Hydrofluoric acid (HF) mixture to dissolve the fines in sandstone formations, and for Carbonate formations, dissolving is not focused but instead dispersing fines in wormholes thus hydrochloric acid is used as treatment fluid for this case.
Field-A brief geological description
Field-A is a gas field discovered 2011 by the exploration of one well A1 and is located 56 km offshore East Africa Indian ocean owned by BG Group as an operator a world leader in exploration and production of Liquefied Natural Gas (LNG) as shown in Figure 4.

Figure 4:Location of Field-A at block A East Africa and other blocks for geological comparison.
This well was drilled in a water depth of 1100m in the south of Field-A to test several stacked deepwater turbidity reservoirs that were deposited within slope-channel cut sandstone that have developed. After discovery, the total number of three appraisal wells was drilled between 2011 and 2014. These discoveries of Field-A resulted in 3.6 tcf of proved gas reserve and showed Gas Initial In place (GIIP) is around 5.44 tscf.
The Field-A has Paleocene geological age tertiary period sands regional setting and can be divided into two fields, separated by stratigraphic sealing between two reservoirs with different contact as a sign of compartmentalization Field-A1 located in the north is a mainly confine channel sandstone with reservoir thickness of around 32 m, net to gross (N/G) 0.91, average porosity and average water saturation being 0.22 and 0.3 respectively where this research work will concentrate on. Field-A2 in the south recognized as the main field with reservoir thickness of 114.2 m net to gross (N/G) 0.83-0.98, average porosity and average water saturation being 0.22- 0.23 and 0.12-0.2 respectively although there is also the variation of reservoir thickness to 44.9 m as well.
Field-A2 can be defined, as high-quality gas reservoir comprises multiple structural segments and vertically stacked in discrete depositional sequences. It is believed that this reservoir is influenced by an edge and bottom aquifers with gross rock volume (GRV) of 6.5 km3. Both reservoirs were deposited in the same environment deep marine seen in Figure 5.

Figure 5:Offshore location of the Field-A in East Africa showing contour for block area of interest.
Depositional environment and lithology of Field-A
The primary environmental deposition is a deep marine, Turbidity from gravity flow in SW (away from the original shoreline) that pinches out towards the crest succeeded by marine shale over the entire structure. The reservoir is of high quality since it is close to the source and two channels coming from west to east joining together and form upper sand, the top structure can be seen in Figure 6. The gravity flow deposits with very poorly sorted mud matrix, seal with debris flows were observed according to different intervals when the well A1 drilled for study and discovery.

Figure 6:Field-A top structure.
Interval 3164.4 m to 3360 m MD (-3139.7 m to -3335.3 mtvdss)
This is the main target of the well. It consists of massive sandstone units interspersed with thin claystone and limestone beds.
Sandstone: Off-white to very light grey, yellowish grey, soft to firm, crumbly, very fine to fine, moderately sorted, sub-angular to sub-rounded, occasionally rounded, sub-spherical, abundant white argillaceous matrix, common carbonaceous debris, Quartz grains, poorly visible porosity, no shows. With Sandstone loose as above, coarse to very coarse with occasional granules, Pyritic, good inferred porosity, no shows.
Claystone: Greenish grey, locally pale green, moderately hard, brittle, dull, generally smooth, locally silty, sub-blocky, locally subelongated, common fines disseminated Pyrite, trace foams, noncalcareous.
Interval 3360 m to 3393.8 m MD (-3335.3 m to -3369.1 mtvdss)
This is a short interval of massive claystone with rare, thin limestone stringers easily defined on both LWD log character and cuttings lithology.
Interval 3393.8 m to 3591.5 m MD (-3369.1 m to -3566.76 mtvdss)
Passage of the well from Claystone into a Sandstone dominated unit defines the top of the interval and a well secondary reservoir target. The interbedded interval consists of sandstones and claystone with minor limestone intercalations. This sandstone is better cemented than the interval above. Limestone described in cuttings samples through this interval is very calcareous well-cemented sandstones. This interval 3549 m to 3591.5 m is predominantly claystone with localized limestone stringers.
Fancies that are used to model the field-A are mainly concretions which show relation, and concretions is a cemented unit boarder of massive rock with randomly distributed sands as shown in Figure 7.

Figure 7:Structural cross section schematic of Field-A2 (South–main field) showing possible fault.
From Figure 8, Field-A1 is separated to Field-A2 by stratigraphic sealing and between two reservoirs with different contact as a sign of compartmentalization. It is also seen from a seismic interpretation that there is a presence of a fault at the end of Field-A2 southsouth, but with the good test data is not seen the radial flow.

Figure 8: Structural cross section schematic of Field-A1 (North) separated to Field-A2.
Research Methodology
Reservoir and grid properties
This research methodology designed to run several simulation cases at field-A1 in which will apply to the separated field-A2. The model of field-A1 is built in petrel in the metric system for simulation results discussed later taking into account the unit conversions and has following grid properties,
Average porosity for clean sand varies from 0.21-0.23; the total number of cells is 3294060 (186 In x-direction, 161 in the y-direction and 110 layers z-direction), The grid size is 100 m × 100 m × 2 m, geological horizons of 111 and two horizontal wells suggested to be drilled by geologists and geophysicists (GG1 and GG2) where there is highly pay thickness and high gas saturation of the reservoir at field-A1. Also the model Figure 9 is set with the bottom aquifer clean sand for simulation and then edge aquifer along east and west sides, Table 1 below shows reservoir model initial conditions Inserting other vertical and horizontal wells pointing in northsouth and other east-west at same locations as GG1 and GG2 original wells with varying different parameters seen in Figure 10, the distance between GG1 and GG2 is around 1.4 km.

Figure 9:Well location for field-A1 gas saturation model.
| Reservoir property | Input value |
|---|---|
| Gas Water contact | 3254 m |
| Reservoir pressure | 334 bar |
| Water density | 1015.41 kg/m3 |
| Water salinity | 30000 ppm ~ 29.96577 kg/m3 |
| Water saturation | 0.146 |
| Water compressibility (cw) | 0.0000414 (1/bar) |
| Average rock compressibility | 0.0000306 (1/bar) |
| Gas gravity | 0.569 sg air |
| Minimum pressure | 20 bar |
| Maximum pressure | 450 bar |
| Gas Initial In place (GIIP) for field-A1 | 1.005 tscf ~ 2.8458E+10 m3 |
Table 1: Reservoir model Initial conditions inputs.

Figure 10:Eclipse model showing GWC for the field-A1.
Non-Darcy factor
The turbulence factor is determined using permeability thickness (kh) obtained from well test property for the field-A1 and input to the model using the keyword "WDFAC" to calculate the Non-Darcy Skin at plateau rate and after a plateau period. From the good test in most wells in East Africa shows that kh (permeability thickness) of 93000 (mDm) in Tertiary sands and Cretaceous is 677 mDm, however, for the field-A1 has kh of 77700 mDm ~ 254,921.3 mDft [17].
Assumptions are made for the open-hole completion and gravel pack non-Darcy coefficient is calculated from the Firoozabardi & Katz equation because of nature of rock type sandstone for the horizontal type of well, using the following gravel pack parameters Table 2 to the equations:
| kg - Gravel pack permeability kg (mD) | 40000 |
| hp - Interval perforation for horizontal well (m) | 300 |
| T - Temperature (°R) | 678 |
| f - Porosity fraction | 0.23 |
| Sw - Water Saturation (sw) | 0.11 |
| gg - Gas relative density (air=1) | 0.58 |
| m - Fluid viscosity (cp) | 0.0277 |
| rw - Wellbore radius (m) | 0.16 |
| kh (mD) | 40000 |
Table 2: Gravel pack properties.
• The gravel pack has the following properties; 300m horizontal section with 8.5” open hole Screen outside diameter: 6.5” Screen inside diameter: 6.0”.
Gravel pack
16/30 gravel (undamaged permeability is of the order of 520,000 md, however
40,000 md is used to represent a damaged and stressed pack), taking into account metric unit conversion.
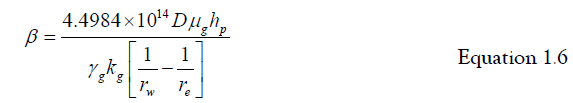
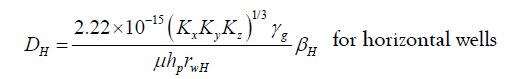
For horizontal wells, Wang X, Economides M [18] turbulence factor
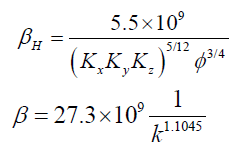
From the data in Table 2 above, taking consideration changing to the field unit and subject input to the equation above;
Therefore, non-Darcy factor DH is calculated as
vertical wells and
Where in the horizontal well equation above; 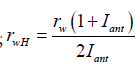 and
and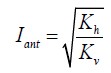
Iant=3.162278, therefore rwH=0.335901, and substitute to equation above non-Darcy factor DH becomes 0.0467 d/MMscf. Varying non-Darcy skin for different to 0.467 to the maximum of 4.67 d/MMScf as in Figure 11 indicated different fields data some of the north sea fields at 254,921 mDft k. H (permeability thickness).

Figure 11:Non-Darcy vs. permeability thickness (kH) for different fields analyzed at BG group (BG 2002).
“WDFAC” keyword is used to process the values of the corresponding well to the petrel simulator to observe the impact of the gas recovery through this rate dependent skin method by considering Table 3 showing unit conversion for a gas field.
| Metric Unit | Field unit |
|---|---|
| Pressure | |
| 1 bar | 14.50377 psi |
| Gas flow rate | |
| 1 Sm3/d | 35.31467 ft3/d = 3.5314 E-11 tscf |
| Volume | |
| 1 km3 | 35314.67 MMScf |
| Productivity Index | |
| 1sm3/(d.bar) | 0.002434861 MMScf/(d.psi) |
| Depth | |
| 1 m | 3.28084 ft |
| Density | |
| 1 kg/m3 | 62.42796 lb/ft3 |
| Permeability thickness (k.H) | |
| 1mD.m | 3.28084 mD.ft |
| Temperature | |
| 1oR | -458.67oF ~ 0.5555556 K |
| Non-Darcy Skin Factor | |
| 1 d/sm3 | 28320.589 d/MMScf |
| Compressibility | |
| 1 (bar-1) | 0.06894757 (Psi-1) |
Table 3: Unit conversion table for the gas field-A1.
Parameters to vary
In order to predict the performance of the horizontal gas wells and vertical taking into consideration the water coning impact, there are several parameters set to be varied as indicated in Table 4.
| Distance from GWC (standoff) - m | 10 | 20 | 30 | 40 | 50 | |||||
|---|---|---|---|---|---|---|---|---|---|---|
| Well Orientation | North-South | East-West | GG Ref | |||||||
| Well Completion | ||||||||||
| Formation skin | 0 | 10 | 20 | |||||||
| Non-Darcy factor (d/MMscf) | 0.0467 | 0.467 | 4.67 | |||||||
| Production Control | ||||||||||
| Gas production rate (Sm3/d) | 1415842 | 4247527 | 6229706 | |||||||
| Water rate limit control (Sm3/d) | 1.6 | 158.9873 | 794.9365 | |||||||
| Tubing Head Pressure (THP) - bar | 40 | 79.97918 | 99.97398 | |||||||
| Reservoir Properties variables | ||||||||||
| kv/kh ratio | 0.1 | 0.6 | 1 | |||||||
| Aquifer | ||||||||||
| Bottom Aquifer | Clean sand | Channel cut | ||||||||
| Edge Aquifer (Fetkovich model) | Out size (AOI) | East | West | |||||||
| Area of Interest | ||||||||||
| Aquifer volumes | 2.6 km3 | 0.9 km3 | ||||||||
| 5.2 km3 | 1.8 km3 | |||||||||
Table 4: parameters set to vary.
Note: Shaded grey color indicates the reference case; changing one parameter keeping other constant will generate the sensitivity case for analysis. The Edge Aquifer along the east and the other on the west is set using Fetkovich aquifer model on the clean sand part with the properties shown in Table 5 Aquifer properties;
| Aquifer model – (Edge Aquifer West) | Fetkovich |
|---|---|
| Aquifer side from | West |
| Aquifer thickness in clean sand | 40m |
| Aquifer volume without area of Interest (AOI) | 0.9 km3 |
| Total Compressibility (rock+water) | 0.0000717 (1/bar) |
| Productivity Index | 4851.031 Sm3/(d.bar) |
| Salt concentration | 29.96577 kg/sm3 |
| Aquifer model – (Edge Aquifer East) | Fetkovich |
| Aquifer side from | East |
| Aquifer thickness in clean sand | 100m |
| Aquifer volume without area of Interest (AOI) | 2.6 km3 |
| Total Compressibility (rock+water) | 0.0000717 (1/bar) |
| Productivity Index | 1679.203031 sm3/(d.bar) |
| Salt concentration | 29.96577 kg/sm3 |
Table 5: Aquifer properties used in the model.
The sensitivity of rock compaction and change in permeability is calculated from permeability depletion study for Field-A1 as shown where the overburden pressure increase with the decrease in water permeability. Thus the percentage change in permeability has used the input to the rock physics model in other cases, and average rock compressibility defined is 0.0000306 (1/bar). The rate-dependent skin after plateau calculated from the turbulence factor and total skin is input to the model for studying water breakthrough time impact to the water coning.
PVT analysis
Appraisal wells samples were analyzed for PVT to obtain fluid properties, PVT gas data used to run simulation depends on the solution gas ratio, gas formation volume factor, gas pressure and gas viscosity at different gas pressures, as shown in appendix 2 taking into account that in the beginning GIIP was calculated based on Bg (gas formation volume factor) from the PVT analysis table in appendix 3; In this appendix 3, typically the overburden pressure will be higher than the fluid pressure, and in this case it is convenient to tabulate compaction against effective stress rather pressure. Therefore, this can be achieved by the ROCKOPTS keyword. Rock properties defined with the rock reference pressure and rock compressibility under ROCK keyword. Another critical part is the water properties in which are determined by PVTW keyword that is used to surfactants modifies the viscosity of the salted water. Also with PVDG keyword, this is output gas PVT table which shows gas pressure, gas formation volume factor and gas viscosity columns respectively. The other table is the relative permeability of gas (SGFN keyword) and relative permeability of water (SWFN keyword), which shows the imbibition characteristic.
Using workflow command, sensitivity cases are generated automatic after input variable to change in the development strategy set up for 35 years from 1st January 2015 to 2050 while keeping other control parameters constant to observe the effect and defining simulation base case in Petrel. Also, the spread sheet to collect results is generated with workflow on input simulation cases, which are loaded with results.
Results and Discussion
Standoff (Distance from GWC) and well orientation
On running simulation cases required to observe the impact of water coning as well located closer to gas water contact, the water breakthrough time will be early seen in the plot below, example for the case in horizontal well located at east-west (changing the direction the original development well GG1 suggested by geologists and geophysicists which is situated in northwest-southeast).
From Figure 12, shows that in order to have the delay of the conning, the well has to be placed at a maximum distance from the gas water contact as the water breakthrough time is high.

Figure 12:Standoff analyses for horizontal well GG1 in the east west.
This is an example for the case in the east-west which is shown to be valid from the literature survey, however there are other scenarios which depend on the well orientation due to the effect of the aquifer as well as shallow permeability layer, water breakthrough seen to be higher in the near gas water contact but general or overall view as distance from gas water contact is increased the water breakthrough time is increased thus delaying the impact of water coning or cresting in horizontal gas wells.
Graphs that were generated from the simulation cases, as shown in Appendix four used to study by input each of the case to the workflow to generate spread sheet figures and plotting the bar graphs for analysis. In this Appendix, four gas recoveries analyses are seen to be high to some cases as increase the distance from gas water contact. Water production rates; in general, is seen to become high after a few years as the well is closer to the gas water contact in which will lead to earlier water breakthrough time and hence coning effect.
In general, the figure below shows the horizontal wells placed into different orientation for the analysis of standoff Thus from the Figure 13 above, It shows that the horizontal gas wells located at northwest and southeast will have the delay on the impact of water conning recommended as better to be drilled for development than other wells.

Figure 13:Example of standoff against well orientation for wells GG1.
Performance of the well
In general, horizontal wells in this type of the reservoir are seen to have higher productivity index compared to vertical wells. Depending on the well orientation and well location as shown from Figure 14. Due to permeability distribution of different layers across the reservoir, other the wells is shown have high performance near to the gas water contact, in overall well located in the northwest and southeast as suggested with geologists and geophysicists have the most top performance of all other wells followed by north-south.

Figure 14:Performance of the different wells standoff compared to vertical.
This will have an impact on the gas total recovery. Also, the results have shown that the two vertical wells in both in the location at GG1 and GG2 as shown in appendix five water start to rise as starting the production that is 0year water breakthrough time, this also because vertical wells have low productivity index that lower performance than horizontal wells.
Production plateau length period and water breakthrough time
The results have shown the peculiar trends when plotting the square root of productivity index multiplied with a standoff against water breakthrough time and production plateau length period. These trends indicate that there might be related due to the orientation and location of the well as shown in Figure 15.

Figure 15:Water breakthrough time and plateau length against product of square root PI and standoff.
From Figure 15 the delay of impact of water coning as well is located at further distance from the gas water contact and increased of its performance, plateau length period increased but It will reach time no further improve on the plateau length period even when well located at further distance at different orientations this might be due to the well has reached the same tubing head pressure constrain and depending on well performance.
Total gas production recoveries for higher standoff after 35 years due to horizontal well orientation has been noticed, and original wells GG1 and GG2 show to have the same recovery followed by the horizontal north-south orientation. For vertical wells are seen to have less recovery than horizontal wells due to the low performance. Figure 16 shows the well orientation different in gas recovery, but there is no much difference across GG1 and GG2 recovery trends.

Figure 16:Water breakthrough time and plateau length against product of square root PI and standoff.
Supplementary information for different graphs scenarios showing the total gas recoveries at different distance from water contacts the recoveries in most of the cases seen to be increased as the well is located further from gas water contact, It happens in another case example well GG2_Ref, the gas recoveries to be so low even when the well is also located from gas water contact.
This is because again, the performance of the well taking into consideration the productivity index is low, and the permeability distribution to the respective layer where the horizontal well is located is low.
Gas Rates sensitivity analysis for high standoff wells.
Changing of the constrain production gas flow rate to high production to the horizontal wells will also show the high total recovery however in some cases it may lead to earlier water breakthrough compared to low gas production constraint. This has been identified from the results, and the overall plateau length is decreased with an increase in gas production rate constraint. In some other case it may occur the well during starting of production there is no plateau length period as water starts to rise up during production due to the impact strength of aquifer. Drawdown is observed to be higher at the peak of water production for horizontal wells when compared before water breakthrough and after water production has reached its maximum. One of the causes for the water coning identified by different literature is the high drawdown since well is produced at the high gas flow rate to reach the gas rate constraint. For the horizontal wells located to close to the gas, water contact has shown to have higher drawdown compared when located further to gas water contact, this also identified with the performance of the wells close to gas water contact is reduced.
From Figure 17 it is possible to identify that, producing at low rates may delay the impact of water coning but has less gas recovery; therefore, it will take a more extended period for gas production recovery to reach its maximum than producing at a high rate. However, it is not economically recommended; therefore, it is advisable producing at a high rate for this type of field in order to reach economic constraint.

Figure 17:Gas rates sensitivity analysis plot for high standoff.
From Figure 17 it is possible to identify that, producing at low rates may delay the impact of water coning but has less gas recovery; therefore, it will take a more extended period for gas production recovery to reach its maximum than producing at a high rate. However, it is not economically recommended; therefore, it is advisable producing at a high rate for this type of field in order to reach economic constraint.
Vertical to horizontal permeability ratio (kv/kh) sensitivity
Vertical to horizontal permeability ratio (kv/kh) varied from 0.1 considering from the well test data, 0.6 as per the core data and 1.0 as per actual data assuming homogeneous system. Results have shown that on increasing the kv/kh (ratio of vertical permeability to horizontal permeability) has very low significance decrease in gas total recovery by 5% due to strength of the bottom aquifer with high kv/kh ratio there is an early water breakthrough half year difference which might have impact to water coning, this change from 0.1 kv/kh to 0.6 and 1 kv/kh is noticed with small recovery change not significance by 5% and hence. This change is also observed in the plot shown in Figure 18; from this plot, it is necessary to take into consideration kh value obtained from the well test and kv multiplier during modeling of the gas field. From the plot, it is shown the initial productivity index is further reduced due to the increase of kv/kh ratio, and it also has an impact on lowering gas production plateau length period.

Figure 18:kv/kh sensitivity analysis.
Aquifer impact on water cresting/coning
The impact of edge aquifer is seen much from the west, where the total gas recovery is reduced highly compared to the east side. Doubling of aquifer volume leads to the early fall of the peak water production rates; this is shown from the simulation plot in Figure 19. The initial productivity index the well is lowered due to highly aquifer strength and highly drawdown since the well is producing at the same initial gas flow rate.

Figure 19:East aquifer analysis.
The analytical aquifer influx rate is shown to increase at the plateau period of the gas production rate of the field. However, the effect is observed much on the west where there is stronger aquifer than in the east.
In the east aquifer, the impact of gas recovery is significance observed by 10% reduction, and the cumulative water influx is increased by 36% when the aquifer volume is doubled. There is no significant impact on the gas production plateau length period, but there is a decrease in the tail gas production rate after tubing head pressure constrains is reached.
In the west aquifer, there is a significant impact of gas recovery, which is reduced by 19%, and the cumulative analytical influx is increased by 69%. The peak water production rate will be for 16 years likely same as on the east aquifer when doubled the aquifer volume the peak water production rate will be reduced by five years. The tail gas production rate will be increased by 1.5 years to reach the end after tubing head pressure constraint is reached, however when double the aquifer volume tail production gas rate is reduced by 3.5 years. This is shown in Figure 20.

Figure 20:West aquifer analysis.
Therefore, the performance of the wells is further reduced due to the impact of the aquifer on either west or east. Moreover, the radial extension of water coning being severe by 1.7 km. as it is seen in Figure 21.

Figure 21:Petrel intersection model showing water cresting and west aquifer.
Tubing head pressure sensitivity analysis
Varying the tubing head pressure has much impact on the gas production flow rate, where the plateau length period is decreased with increasing the tubing head pressure. This is also analyzed when changing the tubing head pressure from 40bar to 80bar then 100bar.
In Figure 22, the results had also shown that, when the tubing head pressure decreased there is an early water breakthrough that is increasing tubing head pressure will enable to delay conning effect, however, the total gas recovery is shown to be reduced with an increase in tubing head pressure. Low tubing head pressure has also shown to have high water production rate peak and increasing tubing head pressure reduce water production rate peak due to drawdown effect, which is also reduced when the tubing head pressure is increased. Different cases have shown the effect on increasing tubing head pressure can be shown in the supporting information.

Figure 22:Tubing Head Pressure (THP) sensitivity analysis.
Formation skin analysis
Mechanical skin evolution in time is set to change from 0, 10 up to 20, the results show that increasing the mechanical skin will lower the good performance of the well, have an early water breakthrough by 3 months. The gas production plateau length period is not significantly affected by increase information skin. However, it has an impact on gas recovery reduction by 10% at each new formation skin defined. Therefore, the higher formation of skin, the lesser the performance of the well shown in Figure 23.

Figure 23:Formation skin analysis.
Tail gas production rate is reduced to one year as compared to when there is no skin after reaching tubing head pressure constraint, which will cause the overall gas production recovery to decrease.
Rate Dependent skin analysis
Increasing non-Darcy/turbulence factor times ten of the initial value 0.0467, 0.467 to 4.67 lowers the performance of the well and decreases gas recovery and take a much longer time for the gas well production to reach its maximum as shown in Figure 24. However, in this case, when a higher turbulence factor is observed, there is no gas production plateau length period, and present higher initially drawdown. The presence of delay of water breakthrough tie is as well found for higher rate dependent skin.

Figure 24:Rate dependent skin analysis.
Although there is higher gas tail production rate ending five years later after the well has reached its tubing head pressure constraint, it is not economically recommended for gas production in this type field thus avoiding partial penetration and deep penetration in order to avoid fluid flow convergence.
Research economic aspect and acknowledgement
From the results have shown that, if water coning present may reduce total gas recovery and affect the plateau length period of the development field-A1. This will affect the economy in one way or the other. However, it is possible for an investment of the field due to high gas initial in place, and drilling suggested development wells taking into consideration delaying of water coning in order to improve gas recovery and economic growth. Cost for drilling these development wells is also a time factor dependent towards the starting of gas production. Table 6 is an example of an estimation of 50% and 25% cost and time for drilling of a development well, taking into account the delay of conning by recommended in the previous page. Sand control completion time is approximately 30 days with the completion cost around 12m $. Inflow control device for eliminating the impact of water coning 4800ft of a horizontal well may cost up to 2m $.
| Well | Type | Water Depth | Reservoir Depth | P50 Dilling Time | P25 Drilling Time | P50 Cost | P25 Cost |
|---|---|---|---|---|---|---|---|
| Field -A | (m) | (m TVDSS) | (days) | (days) | (m) | (m) | |
| Vertical | 1100 m | 3150 m | 32 | 26 | 52.8 | 42.9 | |
| High Angle | 1100 m | 3150 m | 36 | 29 | 59.4 | 47.9 | |
| Horizontal | 1100 m | 3150 m | 41 | 33 | 67.7 | 54.5 | |
| Horizontal | 1100 m | 3150 m | 52 | 40 | 85.8 | 66 |
Table 6: Time cost estimation assumption drilling development wells.
This work is supported and funded by a BG Group (Tanzania section) now owned by Royal Dutch Shell Company, and Heriot- Watt University, working with the model from reservoir field.
Conclusion and Future Prospects
Base on the objectives parameters that will contribute to the water coning is successfully identified. The most prominent parameters as analyzed in the previous pages which are standoff, aquifer especially from west with water coning radial extension of 1.7 km and performance of the well show these parameters have an impact towards total gas recoveries, however the selected well example GG2_Ref has better recoveries and delay of coning than other wells when located at an average of 30 m above gas water contact for 50 m net pay thickness field-A1 reservoir. Therefore, from the results, producing at a high rate, which has high recovery before the impact of aquifer or water, it occurred to the wells, known as outrunning of the aquifer. In order to avoid water coning, using advance completion technique such as inflow control devices (ICD), installing the downhole gauge. Besides, it is essential not to perforate if well is near to gas water contact; the horizontal wells should be located at maximum distance from gas water contact to maximize gas recovery. Not only that but also use of fully open choke allows much water production rate increase, which leads to water coning. Outrunning of the aquifer could be possible because the reservoir has substantial west edge aquifer and supporting bottom aquifer pressure before the water breakthrough to the well. Taking into consideration assumption stated on completion open hole and gravel pack horizontal well with perforation horizontal length of 300m, the performance of the horizontal wells when compared to the vertical wells are shown to be high as indicated in the productivity index plots.
Progress on technical aspect towards geological realization water coning/cresting to the horizontal wells used by many fields around the world by changing geological properties and well locations in the model to solve water coning impact of the other analogy fields. There is a need to review the reservoir field models to undergo the gas field optimization to increase the production of the field and analyse the impact of the designed production equipment. For the case of rate-dependent skin due to non-Darcy or turbulence flow behavior, it is crucial to avoid this pressure drop by avoiding partial penetration of the wells so as fluid flow convergence will not occur. Thus deep penetration will enable for improve gas recovery of the field.
Further work to be done on the sensitivities rate dependent skin using other non-Darcy / turbulence factor equations mentioned in the methodology to investigate the impact of water coning towards oil and gas fields. This suggestion is due to the initial high drawdown effect as the cause of coning. Also, for the other case, high productivity wells rate dependent skin should be taken into consideration before and after the plateau length period of the gas production rate.
REFERENCES
- Kabir C. Predicting gas well performance coning water in bottom-water-drive reservoirs. Society of Petroleum Engineers, San Francisco, California, USA. SPE Annual Technical Conference and Exhibition. 1983.
- Sech RP, Jackson MD, Hampson G. Controls on water cresting in high productivity horizontal gas wells. Society of Petroleum Engineers, London, UK. EUROPEC/EAGE Conference and Exhibition. 2007.
- Joshi SD. Horizontal well technology. PennWell Book Tulsa, USA, 1991.
- Chaudhry A. Gas well testing handbook, Gulf professional publishing, Houston, Texas, USA, 2003.
- Dake L. Fundamentals of Reservoir Engineering, Elsevier. New York, USA, 1983
- Meehan D, Schell E. An analysis of rate-sensitive skin in gas wells, SPE Annual Technical Conference and Exhibition San Francisco ,California, USA. Society of Petroleum Engineers, 1983.
- Elshahawi HM, Gad KH. Estimation of skin for high deliverability gas well tests, SPE Middle East Oil Show, Manama, Bahrain. Society of Petroleum Engineers. 2001.
- Elshahawi HM, Gad KH. Evaluation of Skin for High Deliverability Gas Well Tests, SPE Asia Pacific Oil and Gas Conference and Exhibition Jakarta, Indonesia. Society of Petroleum Engineers, 2001.
- BG Group. Non Darcy skin Technical guideline document 2002.WEMS-01-C10, BG Group.
- Zulfikri B, Adjie BUS. Correction of the non-darcy coefficient for completion effects: Impact on the prediction of Tangguh LNG gas well deliverability, SPE 68667 presented at the SPE Asia Pacific Oil and Gas Conference and Exhibition held in Jakarta, Indonesia. 2001;17-19.
- Engler TW. Multiphase Phenomena—Fluid Flow in Porous Media, Petroleum Engineering. 2010;1-55.
- Ahmed T. Handbook of reservoir engineering. Gulf Publishing Company Houston, USA, 2001.
- Cohen M. Recovery optimization in a bottom/edge water-drive gas reservoir, soehlingen schneverdingen, SPE Gas Technology Symposium Dallas,Texas, USA. Society of Petroleum Engineers. 1989.
- McCarthy J. Gas and water cresting towards horizontal wells. The Anziam. 1993;35:174-197.
- Lever A, Dawe RA. Water-sensitivity and migration of fines in the hopeman sandstone. J Petrol Geol. 1984;7: 97-107.
- Davies D. Production Technology. In: Insititute of Petroleum Engineering Heriot-Watt University, Dubai – UAE, 2014.
- Sharma V, Sircar A, Mohammad N, Patel S. A treatise on non-Darcy flow correlations in porous media, J Pet Environ Biotechnol.2017;8:1-12.
- Wang X, Economides M. Advanced natural gas engineering Elsevier, New York, USA, 2013.
Citation: Tesha JM, Moreno F, Somerville JM, Qaseem S (2019) Predicting Performance of High Deliverability Horizontal Gas Wells and Control of Water Cresting in Tertiary Sands East Africa. J Pet Environ Biotechnol. 10: 394. DOI: 10.35248/2157-7463.19.10.394
Copyright: © 2019 Tesha JM, et al. This is an open-access article distributed under the terms of the Creative Commons Attribution License, which permits unrestricted use, distribution, and reproduction in any medium, provided the original author and source are credited.