Indexed In
- Academic Journals Database
- Open J Gate
- Genamics JournalSeek
- Academic Keys
- JournalTOCs
- China National Knowledge Infrastructure (CNKI)
- CiteFactor
- Scimago
- Ulrich's Periodicals Directory
- Electronic Journals Library
- RefSeek
- Hamdard University
- EBSCO A-Z
- OCLC- WorldCat
- SWB online catalog
- Virtual Library of Biology (vifabio)
- Publons
- MIAR
- University Grants Commission
- Geneva Foundation for Medical Education and Research
- Euro Pub
- Google Scholar
Useful Links
Share This Page
Journal Flyer
Open Access Journals
- Agri and Aquaculture
- Biochemistry
- Bioinformatics & Systems Biology
- Business & Management
- Chemistry
- Clinical Sciences
- Engineering
- Food & Nutrition
- General Science
- Genetics & Molecular Biology
- Immunology & Microbiology
- Medical Sciences
- Neuroscience & Psychology
- Nursing & Health Care
- Pharmaceutical Sciences
Research Article - (2013) Volume 5, Issue 3
Pharmacokinetics of Gentamicin C after IV, IM, SC and Oral Administration , C , C 1 1a and C 2 in Broiler Chickens 2a
Abstract
The pharmacokinetics and bioavailability of four major gentamicin components (C 1 , C 1a , C 2 and C 2a ) in chicken plasma administered at 5 mg/kg body weight by different routes of administration (IV, IM, SC and oral) was determined using reversed-phase high performance liquid chromatography (RP-HPLC) and pre-column derivatization with Phenylisocyanate (PIC). All the components, except for C 1a were well absorbed (bioavailability of 60% or greater) following administration by the IM and SC routes. The bioavailability of C 1a was 58% and 35% following IM and SC administration, respectively. The apparent volume of distribution (V ss and Vd area ) for the C 1 component was significantly smaller than for any of the other components individually or combined. In addition, the C 1 component had a significantly shorter t½β and MRT following intravenous administration and a higher C max /Dose following intramuscular administration. This study showed significant differences in some pharmacokinetics parameters between four gentamicin components (C 1a , C 2a , C 1 and C 2 ) after administration of single mixture of gentamicin by different routes in chickens. The differences may have clinical and toxicological implications, and could explain the high variation in total gentamicin pharmacokinetics.
Keywords: Gentam icin components, Chickens, Pharmacokinetics, Bioavailability
Introduction
Gentamicin is a broad-spectrum bactericidal aminoglycoside antibiotic, produced by fermentation of Micromonospora purpura or M. echinospora. It is effective against wide variety of serious bacterial infections caused by susceptible gram-negative and some grampositive aerobic bacteria [1,2]. Gentamicin is not a uni-molecule but a complex mixture of four major components, designated as C1, C2, C1a, C2a, and minor ones like C2b. The components differ in their degree of methylation on the purpursamine ring [1].
It has been recognized that there is a wide variation in the major component ratio between different pharmaceutical gentamicin preparations [3,4] and therefore, the composition of the final product can vary considerably. Proportions of the different components in most commercial preparations fall within limits that are set and mentioned by the US pharmacopoeia [5] is 25-50% for C1, 10-35% for C1a and for sum of C2 and C2a are 25-55%. The British pharmacopoeia [6] limits are 25-50% for C1, 15-40% for C1a, and 20-50% for sum of gentamicin C2 and C2a. European Pharmacopoeia [7] determines the amount of C1, C1a and the sum of C2 and C2a were limited to 20-35, 10-30 and 40-60%, respectively.
Nephrotoxicity and ototoxicity are the most common side effects associated with the use of gentamicin. The severity of toxicity can vary depending on whether a single or multiple-daily administration plan is used [8]. Moreover, the available data reported remarkable differences in nephrotoxicity for gentamicin components in animals [9]. Consequently, the correlation between toxicity and pharmacokinetics of gentamicin components is important. Gentamicin C1 has different disposition kinetics than the gentamicin complex when given separately to patients [10].
Several methods have been developed for determination of gentamicin. Only chromatographic methods are capable of identifying and quantifying the individual components of the gentamicin complex. Gentamicin has no UV or visible absorbing chromophores and therefore cannot be detected by traditional techniques without derivatisation [11,12]. This necessitates gentamicin derivatization to allow its detection with the required sensitivity. Either pre- or post- column derivatisation for fluorescence or UV detection can be implemented in this process. Gentamicin has been derivatised previously with O-phthalaldehyde (OPA), dansyl chloride, fluorescamine, 9-fluorenylmethyl chloroformate (FMOC-CI), 1-fluoro-2, 4-dinitrobenzene (DNFB) and 2,4,6-trinotrobenzenesulfonic acid (TNBS) [11].
The pharmacokinetics of individual gentamicin components were studied in dogs [13], turkeys [14] and the horse [15] after intravenous administration only. However, there is no available pharmacokinetics data in other species of animals including chicken. The purpose of this study was to determine and calculate the pharmacokinetics and bioavailability of four major gentamicin components in chicken plasma by different route of administration (IV, IM, SC and oral), using reversed-phase high performance liquid chromatography (RPHPLC) and pre-column derivatization with phenylisocyanate (PIC).
Materials and Methods
Experimental animals
Fifty 2-2.5 kg body weight (bw) broiler chickens (Hubbard x Hubbard) of 40-45 days old were used in this study. These chickens were purchased from a local poultry farm at 3 weeks old. They were placed in the Animal House at Jordan University of Science and Technology. The animals were monitored for 2 weeks for any apparent clinical signs and to ensure that they are free from antibiotics before drug administration. The Animal House temperature was maintained at 25 ± 2°C and humidity at 45-65%. All chickens had free access to water and antibacterial-free food.
Drug
Authentic standard powder of gentamicin sulphate with known amounts of gentamicin components (33, 25.5, 22 and 19.5% for C1a, C1, C2a and C2, respectively) was provided by North China Pharmaceutical Group (Hualuan Co. Ltd, Shijiazhuang, China), batch no. (040537). The drug (300 mg) was dissolved in sterile distilled water to a total volume of 15 ml to give a final concentration of 20 mg/ml prior drug administration.
Peak assignment
Peak assignments were made by elution of gentamicin sulphate standard solutions. The relative proportion described from the standard compositions has permitted peak identification. Gentamicin C1a, C1, C2a and C2 were identified by comparison of their retention time with those identified previously [16].
Chemicals and reagents
All the chemicals employed were of analytical grade. Acetonitrile and water were HPLC-grade (Frutarom, UK), Trifluoroacetic acid (TFA) and Triethylamine (TEA) were purchased from Scharlau, Spain. Phenylisocyanate (PIC) was purchased from Merck, Germany.
HPLC system
Chromatography was carried out on binary high pressure HPLC system (Shimadzu, Japan) which consisted of LC-10A DVP HPLC pump, SIL-10A DVP auto injector, SPD-10 AVP UV-vis detector, SCL-10 AVP system controller, DGV-12 A degasser, Shimadzu class- VP software Ver 6.12 SP4. Chromatographic separation was performed using Chromolith RP-18e (4.6 mm i.d. × 50 mm length, macropore 2 μm, mesopore 2 nm, Merck, Germany).
Experimental design
Chickens were individually weighed before drug administration and doses were calculated accordingly. The chickens were divided into 5 equal groups (10 chickens / group) in a parallel design. Chickens of group 1 did not receive any drug and served as a control group. Chickens of group 2, 3, 4 and 5 were received total gentamicin (5 mg/kg) body weight as a single IV, IM, SC and oral administration, respectively. Gentamicin was given in the right brachial vein, pectoral muscle, under the skin of the neck and directly by thin plastic syringe into the crop for IV, IM, SC and oral administration, respectively. Food was withheld for 12 h before drug administration and was offered 6 h after drug administration to exclude any influence of feed on the absorption of the drug. Water was given freely to all groups. Blood samples (1- 1.5 ml) were collected from the left brachial vein into heparinized tubes at 0 (pretreatment), 5, 15 and 30 min and 1, 2, 4, 6, 8, 12, 24 and 48 h after drug administration. The samples were directly centrifuged at ~1000 g for 10 min to obtain clear plasma and stored at –20°C until analysis.
Preparation of standard curve
Daily fresh calibration curves were prepared by dissolving dried gentamicin mixture powder in HPLC-grade water, in a measuring flask to obtain a concentration of 1000 μg/ml. The stock solution was added to HPLC-grade water or chicken plasma to produce 1, 10, 25, 50 and 100 μg/ml. Four calibration curves were made for each concentration according to their ratios. The calibration curves were obtained by plotting the peak height as a function of the respective concentrations for each component and the linear regression was calculated for each component.
Sample preparation
Concentrations of gentamicin components in plasma were assayed according to previously described method [16] with slight modification. The calibration and plasma samples of gentamicin were prepared by adding 200 μl of plasma to 300 μl of triethylamine solution (5 mg/ml in 90% acetonitrile and 10% water) to precipitate plasma protein. The mixture was shaken for 15 second by vortex mixer and centrifuged at ~1000 g for 5 min. The supernatant (400 μl) was transferred to clean glass tubes and 200 μl of phenylisocyanate (5 mg/ml in acetonitril) was added as derivatizing agent. The mixture was shaken by vortex mixer for 10 seconds and transferred to a shaker water-bath. The water path was set at 65°C for 30 min with slow shaking. The mixture was then transferred to Eppindorf tubes and centrifuged at ~1000 g for 5 min to ensure complete precipitation and clearness of the resultant. The clear supernatant was injected directly into the HPLC system using special glass vials.
Chromatographic condition
Gentamicin was eluted with a mobile phase consisting of acetonitrile-water (36:64, v/v) and 0.1% of triflouroacetic acid was added in aqueous acetonitrile. The mobile phase was filtered through a 0.45 μm membrane filter and degassed. The flow rate was performed at 2 ml /min and the UV detector set at a wavelength of 240 nm. The volume of injection was 100 μl.
HPLC methods for gentamicin C1a, C2a, C1 and C2 were validated by measuring the specificity, accuracy, precision, linearity, sensitivity and recovery in chicken plasma. The specificity of this method was assured since there were no interfering peaks present in chromatograms corresponding to the retention time of gentamicin –PIC derivatives. The accuracy of the method was 98.6, 100.2, 99 and 99.2% for gentamicin C1a, C2a, C1 and C2, respectively. The intra-day coefficients of variation (CV) for 4 major components ranged from 3.2 to 6, whereas, the interday CV ranged from 2 to 7. The limit of quantification (LOQ) was 0.3, 0.25, 0.25 and 0.2 μg/ml for gentamicin C1a, C2a, C1 and C2, respectively based on signal-to-noise ratio of 6:1. Moreover the mean percentage recoveries of gentamicin C1a, C2a, C1 and C2 from the plasma were 93%, 95%, 94% and 98%, respectively. Gentamicin derivatives C1a, C2a, C1 and C2 were stable during 24 h from preparation.
Pharmacokinetics analysis
The pharmacokinetic analysis of the data was performed using non-compartmental analysis based on statistical moment theory (SMT) according to previously described methods (Gibaldi and Perrier, 1982), with the help of a commercially available software program (WinNonlin®, Pharsight Corporation, Cary, NC, USA). The parameters calculated were: area under plasma concentrationtime curve (AUC) using linear trapezoid method; area under the first moment curve (AUMC); mean residence time (MRT), where MRT= AUMC/AUC; volume of distribution (Vdarea), where Vdarea=(dose/ AUC × β); total body clearance (CLB), where CLB = dose/AUC; and apparent volume of distribution at steady state (Vss), where Vss=MRT × CLB. The absolute bioavailability (F) was calculated as (AUCnon IV/ AUCIV) ×100. The maximum plasma concentration (Cmax) and time to maximum concentration (Tmax) following extravascular administration were determined empirically directly from the time-concentration curve. Doses of the individual components were calculated by multiplying the administered dose (5 mg/kg) by the percentage of the component contained in the gentamicin formulation. Cmax and AUC0-∞ were normalized by dose prior to comparison.
Statistical analysis
One-way analysis of variance (ANOVA) was used to test the hypothesis of no differences between the average pharmacokinetic parameter values between the 4 major gentamicin components. If the means were different, a multiple comparison of the means was performed using the Fisher’s Least Significant Difference test (LSD). The data were log-transformed prior to analysis, since they were not normally distributed on a linear scale. Some parameters (Cmax and Tmax) were not normally distributed, even after log-transformation, and the Kruskall-Wallis ANOVA on ranks and Tukey test were used for these data. The differences were considered significant when P<0.05. All data are expressed as the geometric mean ± SD of the log data, the latter being an approximation of the co-efficient of variation [17]. For Cmax and Tmax, the median, 25th percentile and 75th percentile are reported.
Results
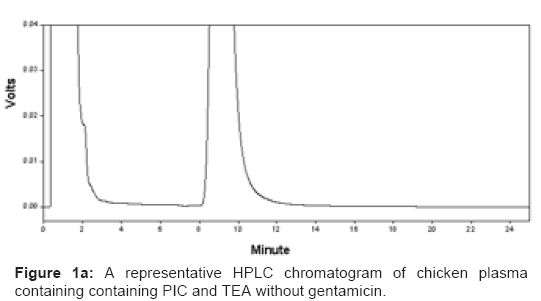
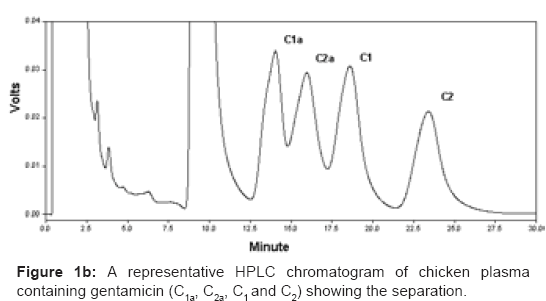
A representative HPLC chromatogram of blank chicken plasma containing PIC and TEA without gentamicin and the separation of the gentamicin components in chicken plasma are illustrated in figures 1A and 1B, respectively. The calibration curves of gentamicin components, spiked in chicken plasma, were linear (data not shown). Close correlation with the linear regression equations were observed for all four components (r2=0.999, 0.998, 0.998 and 0.997 for C1a, C2a, C1 and C2, respectively). The peak heights were proportionally related to gentamicin component concentrations.
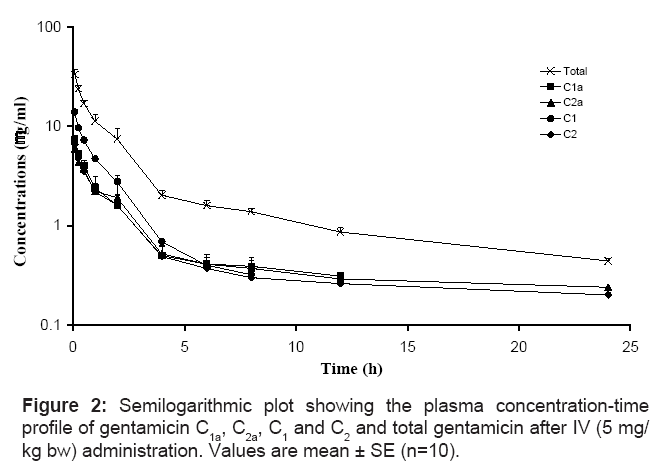
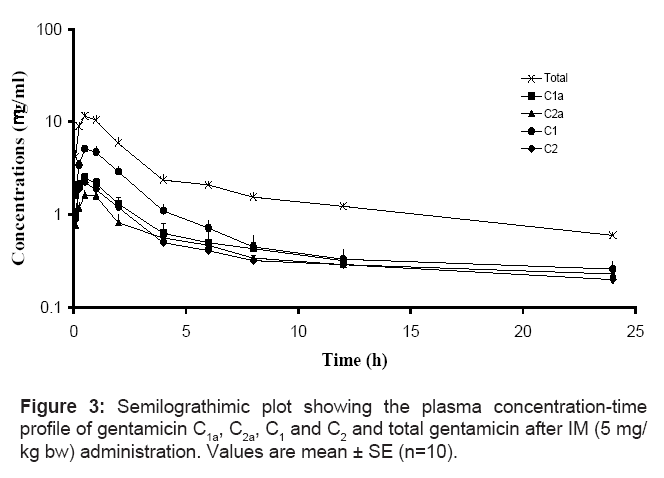
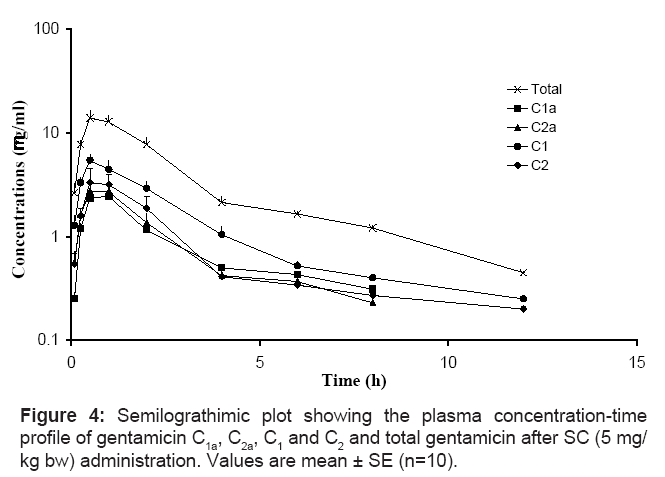
The mean concentrations ± SE of gentamicin C1a, C2a, C1, C2 and total gentamicin (determined by summation of the concentrations of 4 major components) after single IV, IM and SC administration of a single dose of gentamicin (5 mg/kg bw) are shown in figures 2, 3 and 4, respectively. The pharmacokinetics parameters of gentamicin C1a, C2a, C1, C2 and total gentamicin following single IV, IM and SC administration of a single dose of gentamicin (5 mg/kg bw) are shown in tables 1, 2 and 3, respectively.
| Parameters | C1 (1.28 mg/kg) | C1a (1.65 mg/kg) | C2 (0.98 mg/kg) | C2a (1.10 mg/kg) | Total (5.00 mg/kg) |
|---|---|---|---|---|---|
| t1/2b (h) | 1.69 ± 0.56a | 6.45 ± 1.12b | 3.87 ± 0.62b | 5.24 ± 0.90b | 4.00 ± 0.49b |
| MRT (h) | 1.66 ± 0.44a | 6.76 ± 1.05b | 4.02 ± 0.41b | 6.05 ± 0.77b | 3.37 ± 0.36b |
| Vdarea (ml/kg) | 193.64a ± 0.45 | 741.74b ± 0.96 | 629.55b ± 0.47 | 627.66b ± 0.86 | 557.80b ± 0.41 |
| Vss (ml/kg) | 132.42a ± 0.50 | 539.15b ± 0.87 | 453.50b ± 0.42 | 502.70b ± 0.70 | 325.06b ± 0.43 |
| CLB (ml/hr/kg) | 79.60 ± 0.56 | 79.76 ± 0.49 | 112.73 ± 0.39 | 83.10 ± 0.46 | 96.35 ± 0.30 |
| AUC0-∞/Dose (mg.h.kg/ml/mg) | 12.57 ± 0.56 | 12.54 ± 0.49 | 8.86 ± 0.39 | 12.04 ± 0.46 | 10.38 ± 0.30 |
| Extrapolated AUC (%) | 5 ± 0.66 | 31 ± 0.65 | 10 ± 0.45 | 25 ± 0.73 | 5 ± 0.69 |
a,bDifferent superscripts indicate statistically significant differences
Table 1: The pharmacokinetics parameters of gentamicin C1a, C2a, C1, C2 and total gentamicin following single IV administration. Values are geometric mean ± SE of the log-transformed data (n=10).
| Parameters | C1 (1.28 mg/kg) | C1a (1.65 mg/kg) | C2 (0.98 mg/kg) | C2a (1.10 mg/kg) | Total (5.00 mg/kg) |
|---|---|---|---|---|---|
| t1/2b (h) | 2.67 ± 0.76 | 3.39 ± 1.15 | 4.70 ± 0.63 | 6.61 ± 0.94 | 3.78 ± 0.35 |
| MRT (h) | 3.45 ± 0.54 | 4.85 ± 0.98 | 5.93 ± 0.53 | 8.76 ± 0.90 | 4.43 ± 0.24 |
| Vdarea/F (ml/kg) | 304.30a ± 0.57 | 674.52b ± 0.74 | 972.63b,c ± 0.50 | 1242.65c ± 0.62 | 679.26b ± 0.33 |
| CLB/F (ml/hr/kg) | 79.04 ± 0.43 | 137.68 ± 0.90 | 144.46 ± 0.40 | 130.32 ± 0.68 | 124.59 ± 0.37 |
| AUC0-∞/Dose (mg.h.kg/ml/mg) | 12.65 ± 0.43 | 7.26 ± 0.90 | 6.92 ± 0.40 | 7.68 ± 0.68 | 8.03 ± 0.37 |
| Extrapolated AUC (%) | 10 ± 0.69 | 23 ± 0.69 | 22 ± 0.37 | 40 ± 0.35 | 12 ± 0.64 |
| Bioavailability (%) | 101 ± 0.65 | 58 ± 0.88 | 78 ± 0.48 | 64 ± 0.79 | 77 ± 0.42 |
| Cmax/Dose Median (25th-75th percentile) (µg/mL) | 4.48a (3.81-5.82) | 2.49b (1.59-3.05) | 1.94b (1.51-2.37) | 1.73b (1.25-2.05) | 2.51a.b (2.19-2.30) |
| Tmax Median (25th-75th percentile) (h) | 0.50 (0.50-1.00) | 0.50 (0.50-1.00) | 0.50 (0.50-0.50) | 0.50 (0.50-1.00) | 0.50 (0.50-1.00) |
Values are mean ± SE (n=10)
a,bDifferent superscripts indicate statistically significant differences
Table 2: The pharmacokinetics parameters of gentamicin C1a, C2a, C1, C2, and total gentamicin following single IM administration.
| Parameters | C1 (1.28 mg/kg) | C1a (1.65 mg/kg) | C2 (0.98 mg/kg) | C2a (1.10 mg/kg) | Total (5.00 mg/kg) |
|---|---|---|---|---|---|
| t1/2(h) | 1.54 ± 0.86a | 2.37 ± 0.65a,b | 3.32 ± 0.59b | 3.54 ± 0.45b | 2.21 ± 0.27a,b |
| MRT (h) | 2.35 ± 0.56a | 3.26 ± 0.48a,b | 3.81 ± 0.35b | 4.09 ± 0.32b | 2.71 ± 0.20a,b |
| Vdarea/F (ml/kg) | 217.89a ± 0.77 | 785.25b ± 0.50 | 586.99b,c ± 0.24 | 603.05b,c ± 0.35 | 443.63c ± 0.40 |
| CLB/F (ml/hr/kg) | 98.20a ± 0.48 | 229.29b ± 0.34 | 122.49a ± 0.53 | 118.04a ± 0.36 | 139.07a ± 0.34 |
| AUC0-∞/Dose (mg.h.kg/ml/mg) | 10.18 ± 0.48a | 4.36 ± 0.34b | 8.16 ± 0.53a | 8.47 ± 0.36a | 7.20 ± 0.34a |
| Extrapolated AUC (%) | 11 ± 0.84 | 18 ± 0.44 | 15 ± 0.64 | 18 ± 0.56 | 3 ± 0.39 |
| Bioavailability (%) | 81 ± 0.66a | 35 ± 0.65b | 92 ± 0.52a | 70 ± 0.43a | 69 ± 0.29a |
| Cmax/Dose Median (25th-75th percentile) (µg/mL) | 4.74a (4.01-7.06) | 1.79b (1.35-1.87) | 2.81a (1.91-3.27) | 2.78a (2.08-3.80) | 2.85a (2.70-3.62) |
| Tmax Median (25th-75th percentile) (h) | 0.50 (0.50-1.00) | 1.00 (0.50-1.00) | 0.75 (0.50-1.00) | 0.50 (0.50-1.00) | 0.50 (0.50-1.00) |
a,bDifferent superscripts indicate statistically significant differences
Table 3: The pharmacokinetics parameters of gentamicin C1a, C2a, C1, C2, and total gentamicin following single SC administration. Values are mean ± SE (n=10).
The apparent volume of distribution (Vss and Vdarea) for the C1 component was significantly smaller than for any of the other components individually or combined. In addition, the t&fraC12;β and MRT were significantly shorter for C1 following intravenous administration (Table 1). The data collected after intramuscular administration also suggests that C1 has a smaller apparent volume of distribution (Vdarea/F). This is also the most likely reason for C1 having a significantly higher Cmax/Dose following intramuscular administration. All gentamicin components were rapidly and extensively absorbed following intramuscular and subcutaneous administration with the exception of C1a, which had a bioavailability of 58 and 35%, respectively. This component also had a lower Cmax/Dose and AUC0-∞/Dose as well as a higher Vdarea/F and CLB/F. Gentamicin was not detected in chicken plasma, after a single oral administration of gentamicin (5 mg/kg bw).
Discussion
Gentamicin is a polarized water-soluble compound; it is excreted un-metabolized via the kidney and has very poor intestinal membrane permeability [12,18]. There are numerous reports of gentamicin pharmacokinetics in human and animals. With few exceptions, these consider gentamicin to be single molecule and describe the pharmacokinetics of total gentamicin only. It is interesting that gentamicin consists from 4 major components (C1a, C2a, C1 and C2) and other minors. The pharmacokinetics of individual gentamicin components has not been targeted by many researchers, but this does not detract from its importance. On the contrary, the pharmacokinetics of gentamicin components has been a subject of interest due to clinical and toxicological considerations. The study of the individual components has been hampered by the lack of a suitable calibrated method of detection and the analytical problems associated with gentamicin derivatization.
Direct UV detection of gentamicin is not possible because gentamicin has no UV or visible chromophores and cannot be detected by traditional techniques [19,20]. Therefore, derivatization of gentamicin to allow its detection with suitable sensitivity is necessary. Pre-column derivatization with a suitable fluorescent reagent allows for the simplest, accurate and most sensitive analysis. Derivatization of gentamicin by O-phthalaldehyde (OPA) [21], dansyl chloride [21], fluorescamine [22], 9-fluorenylmethyl chloroformate [1], 1-fluoro-2, 4-dinitrobenzene [21] and 2,4,6-trinitrobenzenesulfonic acid [23,24] were reported. However, these reagents are with drawbacks related to reagent stability, time consuming and detection sensitivity. For example, OPA is unstable and the elution of the OPA derivatives has been found to affect by the concentration of inorganic cations in the HPLC mobile phase [19,11].
In our previous study, the concentrations of gentamicin in chicken plasma after IV, IM, SC and oral administration were determined using microbiological assay [25]. This bioassay method is simple and inexpensive, but unable to quantify of the individual components of gentamicin [12,25]. High correlation (r2=0.97) was found between HPLC and bioassay methods in determining the mean plasma gentamicin in chickens. However, there were significant differences in some pharmacokinetics parameters when HPLC and bioassay were compared [25].
We modified a simple and rapid liquid chromatographic method for determination of gentamicin components in plasma using Phenylisocyanate (PIC) as pre-column derivating reagent. This method shows good specificity, accuracy, stability, precision and linearity. To our knowledge, this is the first study that determined and calculated the pharmacokinetics of each gentamicin component (C1a, C2a, C1 and C2) separately in chicken plasma using RP-HPLC and phenylisocyanate as derivatizing reagent.
After single IV administration, gentamicin C1 has the shortest t1/2β (1.69 h) followed by C2 (3.87), C2a (5.24 h) and C1a (6.45 h). These differences are attributable to differences in both clearance and apparent volume of distribution between the components. The estimated value for CLB is highest for C2 (112.73 ml/hr/kg), followed by 79.60, 79.76 and 83.1 ml/hr/kg for C1, C1a and C2a respectively. In contrast, the estimated value for Vss is highest for C1a (539.15 mL/kg) followed by 502.70, 453.50 and 132.42 mL/kg for C2a, C2 and C1 respectively.
After a single IM administration of 5 mg/kg bw of gentamicin the Cmax/Dose were 4.48, 2.49 1.94 and 1.73 μg/ml all occurring at 0.5 hours for gentamicin C1, C1a, C2 and C2a, respectively. The higher Cmax/Dose for C1 can be ascribed to the smaller apparent volume of distribution for this component. The calculated value for Vdarea/F was 304.30, 674.52, 972.63 and 1242.65 ml/kg for components C1, C1a, C2 and C2a respectively. The shortest t1/2β was noted for gentamicin C1 (2.67 h), whereas 3.39, 4.70 and 6.61 h were calculated for gentamicin C1a, C2 and C2a respectively. Once again, this can be accounted for by the smaller apparent volume of distribution for this component. Gentamicin C1 had the highest bioavailability (F=101%), while gentamicin C1a had the lowest (F=58%). The bioavailabilities of gentamicin C2 and C2a were 78 and 64%, respectively.
After a single SC administration of gentamicin at a dose of 5 mg/ kg bw, Cmax/Dose were 4.74, 1.79, 2.81 and 2.78 μg/ml at 0.50, 1.00, 0.75 and 0.50 h for gentamicin C1, C1a, C2 and C2a, respectively. The shortest t1/2β was once again noted for gentamicin C1 (1.54 h), while gentamicin C1a, C2 and C2a had higher t1/2β values 2.37, 3.32 and 3.54 h, respectively. Gentamicin C1a had the lowest bioavailability (35%), resulting in a significantly lower Cmax/Dose (1.79 μg/ml) compared with the other components. The Cmax/Dose was 4.74, 2.81 and 2.78 μg/ml for components C1a, C2 and C2a, respectively.
The extrapolated percentages of the AUC0-∞ for components C1a and C2a were greater than the generally accepted 20% following both intravenous and intramuscular administration (IV: 31% and 25% respectively; IM: 23% and 40%). This may have affected the accuracy with which some of the pharmacokinetic parameters were estimated for these components.
Our results showed significant differences between the 4 major components in some pharmacokinetics parameters after IV, IM and SC administration of gentamicin at a dose of 5 mg/kg bw in broiler chickens. Specifically, the apparent volume of distribution was smaller and the t&fraC12;β was shorter for component C1. Also notable was that C1a seemed to have been poorly absorbed following SC administration. Differences have also been reported in the pharmacokinetic parameters of the different gentamicin components in dogs (larger apparent volume of distribution and slower clearance of component C1) [13] and horses (faster clearance of C1a) [15]. The differences in PK were mainly attributed to higher tissue binding for C1 compared with others [13]. This supports the hypothesis that there are significant differences in the pharmacokinetics of gentamicin components, but these differences are not consistent across species.
Other study conducted by Shem-Tov et al. [14] found significant differences in the pharmacokinetics profiles between major components in body tissue when the drug was given to turkeys. Therefore, the differences in total gentamicin pharmacokinetics and nephrotoxicity reported in the previous studies may result from the differences in the pharmacokinetics behavior of the different component.
After oral administration of gentamicin at a dose of 5 mg/kg bw, no component could be detected in plasma samples in all tested chickens. The oral bioavailability (F) was 0.0%. These finding are in consistent to those described previously [23]. This may due to high polarity and cationic nature of the drug that result in scant absorption from gastrointestinal tract.
In conclusion, our results showed significant differences in some pharmacokinetics parameters between four gentamicin components (C1a, C2a, C1 and C2) after administration of single mixture of gentamicin by IV, IM, SC and oral routes. The differences may have clinical and toxicological implications, and could explain the high variation in total gentamicin pharmacokinetics. A modified rapid and simple method was developed for the determination of gentamicin components in chicken plasma. This RP-HPLC method used precolumn derivatization of gentamicin with Phenylisocyanate (PIC). This method is able to measure 4 major components of gentamicin in plasma at low concentrations. It is therefore, well suited for performing pharmacokinetics and analytical studies. Further studies are needed to determine the minimum inhibitory concentration for each gentamicin component against susceptible microorganisms of interest. In addition, toxicological profile for each of these components should be studies in different animal species. Based on these studies, a determined ratio of gentamicin components should be recommended to avoid the wide variation in pharmaceutical preparations.
Acknowledgements
This study was funded by the Deanship of Scientific Research at Jordan University of Science and Technology (grant no. 121/2004).
References
- Riviere JE, Spoo JW (1995) Aminoglycoside antibiotics. In Veterinary Pharmacology and Therapeutics (7thedn) Ed Adams, HR pp 806-810 Iowa state University Press, Ames.
- Soltes L (1999) Aminoglycoside antibiotics--two decades of their HPLC bioanalysis. Biomed Chromatogr 13: 3-10.
- White LO, Lovering A, Reeves DS (1983) Variations in gentamicin C1, C1a, C2, and C2a content of some preparations of gentamicin sulphate used clinically as determined by high-performance liquid chromatography. Ther Drug Monit 5: 123-126.
- Claes PJ, Busson R, Vanderhaeghe H (1984) Determination of the component ratio of commercial gentamicins by high-performance liquid chromatography using pre-column derivatization. J Chromatogr 298: 445-457.
- United States Pharmacopoeia 26 (2003) United States Pharmacopoeial Convention, Rockville, MD.
- British Pharmacopoeia (1993) H.M.S.O. London.
- European Pharmacopoeia (2002) European Department for the Quality of Medicines, Strasbourg, 4th ed.
- Albarellos G, Montoya L, Ambros L, Kreil V, Hallu R, et al. (2004) Multiple once-daily dose pharmacokinetics and renal safety of gentamicin in dogs. J Vet Pharmacol Ther 27: 21-25.
- Kohlhepp SJ, Loveless MO, Kohnen PW, Houghton DC, Bennett WM, et al. (1984) Nephrotoxicity of the constituents of the gentamicin complex. J Infect Dis 149: 605-614.
- Mosegaard A, Welling PG, Madsen PO (1975) Gentamicin and gentamicin C1 in the treatment of complicated urinary tract infections: comparative study of efficacy, tolerance, and pharmacokinetics. Antimicrob Agents Chemother 7: 328-332.
- Stead DA (2000) Current methodologies for the analysis of aminoglycosides. J Chromatogr B Biomed Sci Appl 747: 69-93.
- Al-Amoud AI, Clark BJ and Chrystyn HJ (2002) Determination of gentamicin in urine samples after inhalation by reversed-phase high-performance liquid chromatography using pre-column derivatisation with o-phthalaldehyde. J Chromatogr B Analyt Technol Biomed Life Sci 769: 89-95.
- Isoherranen N, Lavy E, Soback S (2000) Pharmacokinetics of gentamicin C(1), C(1a), and C(2) in beagles after a single intravenous dose. Antimicrob Agents Chemother 44: 1443-1447.
- Shem-Tov M, Gabor N, Suth M, Kormoczy P (2003) Depletion of gentamicin and its major components from various tissues of turkeys. Am J Vet Res 64: 1234-1236.
- Steinman A, Isoherranen N, Ashoach O, Soback S (2002) Pharmacokinetics of gentamicin C1, C1a and C2 in horses after single intravenous dose. Equine Vet J 34: 615-618.
- Kim BH, Lee SC, Lee HJ, Ok JH (2003) Reversed-phase liquid chromatographic method for the analysis of aminoglycoside antibiotics using pre-column derivatization with phenylisocyanate. Biomed Chromatogr 17: 396-403.
- Julious SA, Debarnot CA (2000) Why are pharmacokinetic data summarized by arithmetic means? J Biopharm Stat 10: 55-71.
- Gemer O, Zaltztein E, Gorodischer R (1983) Absorption of orally administered gentamicin in infants with diarrhea. Pediatr Pharmacol (New York) 3: 119-123.
- Stead DA, Richard RM (1996) Sensitive fluorimetric determination of gentamicin sulfate in biological matrices using solid-phase extraction, pre-column derivatization with 9-fluorenylmethyl chloroformate and reversed-phase high-performance liquid chromatography. J Chromatogr B 675: 295-302.
- Clarot I, Chaimbault P, Hasdenteufel F, Netter P, Nicolas A (2004) Determination of gentamicin sulfate and related compounds by high-performance liquid chromatography with evaporative light scattering detection. J Chromatogr A 1031: 281-287.
- Preu M, Guyot D, Petz M (1998) Development of a gas chromatography-mass spectrometry method for the analysis of aminoglycoside antibiotics using experimental design for the optimisation of the derivatisation reactions. J Chromatogr A 818: 95-108.
- Boison JO, MacNeil JD (1995) Chemical analysis of for antibiotics used in agriculture. In AOAC Eds Oka H, Nakazawa H, Harada K, MacNeil, JD Arlington, VA.
- Brown SA, Riviere JE (1991) Comparative pharmacokinetics of aminoglycoside antibiotics. J Vet Pharmacol Ther 14: 1-35.
- Calcara M, Enea V, Pricoco A, Miano F (2005) Capillary electrophoresis assay of netilmicin sulphate. J Pharm Biomed Anal 38: 344-348.
- Abu-Basha EA, Idkaidek NM, Al-Shunnaq AF (2007) Comparative pharmacokinetics of gentamicin after intravenous, intramuscular, subcutaneous and oral administration in broiler chickens. Vet Res Commun 31: 765-773.
Copyright: © 2013 Abu-Basha EA, et al. This is an open-access article distributed under the terms of the Creative Commons Attribution License, which permits unrestricted use, distribution, and reproduction in any medium, provided the original author and source are credited.
