


Indexed In
- Open J Gate
- Genamics JournalSeek
- Academic Keys
- JournalTOCs
- CiteFactor
- Ulrich's Periodicals Directory
- Access to Global Online Research in Agriculture (AGORA)
- Electronic Journals Library
- Centre for Agriculture and Biosciences International (CABI)
- RefSeek
- Directory of Research Journal Indexing (DRJI)
- Hamdard University
- EBSCO A-Z
- OCLC- WorldCat
- Scholarsteer
- SWB online catalog
- Virtual Library of Biology (vifabio)
- Publons
- Geneva Foundation for Medical Education and Research
- Euro Pub
- Google Scholar
Useful Links
Share This Page
Journal Flyer
Open Access Journals
- Agri and Aquaculture
- Biochemistry
- Bioinformatics & Systems Biology
- Business & Management
- Chemistry
- Clinical Sciences
- Engineering
- Food & Nutrition
- General Science
- Genetics & Molecular Biology
- Immunology & Microbiology
- Medical Sciences
- Neuroscience & Psychology
- Nursing & Health Care
- Pharmaceutical Sciences
Research Article - (2025) Volume 15, Issue 3
Performance Evaluation and Diseases Reaction of Bread Wheat (Triticum aestivum L.) Varieties in East Gojjam, North Western Ethiopia
Belachew Bekele*Received: 10-Oct-2024, Manuscript No. JPPM-24-27143; Editor assigned: 14-Oct-2024, Pre QC No. JPPM-24-27143 (PQ); Reviewed: 28-Oct-2024, QC No. JPPM-24-27143; Revised: 04-Sep-2025, Manuscript No. JPPM-24-27143 (R); Published: 11-Sep-2025, DOI: 10.35248/2157-7471.25.16.767
Abstract
Bread wheat is an important staple food for Ethiopian people and cultivated in the mid and high land areas of the country. However; the productivity of the crop has been very low, due to numerous factors. Lack of improved disease resistance varieties are among the major factors in the area. To alleviate such problem evaluation of the performance varieties for disease and yielding potentials across locations is a paramount. Therefore, this study was conducted with the objectives of evaluating the performance of improved bread wheat varieties for diseases resistance and yielding potential under different agro-ecological conditions of the area. Ten bread wheat varieties were evaluated in Randomized Completed Block Design (RCBD) across three locations with two replications during 2023/24 cropping season. The combined analysis of ANOVA revealed that testing locations, varieties and location by varieties interactions showed significant variations for plant height, above ground biomass, septoria disease severity, AUDPC, yellow rust, spike length and grain yield. The highest septoria disease severity (84.0%) and AUDPC value of 2539.8% was recorded on wane variety at Debre Elias testing location. Ogolcho and Hidase varieties were recorded the highest yellow rust infection. Boru and Daka varieties recorded the highest grain yield associated with lower diseases severities across the testing environments. However, the resistance of varieties will break through time thus continues evaluation of released varieties across location is an important strategy to improve the grain yield and quality of produce in the country.
Keywords
AUDPC; Correlations; Diseases severity; Grain yield; Varieties
Introduction
Wheat is the most important food security crop at the global level with a production of 750 Million Tons (MT) on about 220 million hectares. Wheat alone plays a particularly crucial role in ensuring global food/nutrition security, supplying a fifth of global food calories and protein. Sub-Sahara Africa produced a total of 7.5 MT on a total area of 2.9 Mha accounting for 40 and 1.4% of the wheat production in Africa and at global levels, respectively. Ethiopia is the largest wheat producer in subSaharan Africa and is cultivated over 1.89 million hectares of land, accounting for 14.62% of the total grain crop area, with an annual production of 5.8 million tons, contributing about 16.91% of the total grain production. In terms of area production, wheat ranks third after teff and maize. In total grain production, wheat ranks second after maize in the country. It plays an important role in everyday life of the world’s population and provides over 21% of the food calories and 20% of the protein to more than 4.5 billion people, thereby playing a fundamental role in food security. It is one of the miracle crops of the 20th century playing a significant role in the Green Revolution led by Norman Borlaug, which dramatically reduced poverty, hunger and saved millions of lives worldwide [1].
Wheat is largely grown in the mid and highland areas of Ethiopia spanning at altitudes of 1500 to 3000 meter above sea level (masl). However, enhancing its production is facing many challenges i.e., changing of climatic factors and biotic stresses that cause significant yield loss. Among various biotic stresses, three rust diseases i.e., stem, yellow and leaf rusts are still the major threats to wheat production globally. Yellow rust is one of the most widely destructive plant diseases in modern winter cereal production. Septoria is also the major disease of wheat in all wheat growing areas of the world causing serious economic losses. The diseases are the major production bottlenecks in the country and in the area. Yellow rust can cause a yield loss up to 91% and till complete crop failure, and also Septoria causes up to 54.4%. In the area both improved varieties as well as, local cultivars were become out of production because of the diseases. Since, each variety has a genotype-specific ability to maintain performance over a wide range of environmental conditions varieties should be evaluated across many agro ecologies. This ability shows the performance adaptability of a variety. Such ability is important because growers naturally want to use varieties which perform well in their own fields. However, the performance of a genotype in a given environment is more important for wheat cultivation and improvement. Demand for differential agronomic traits depends on the production environment of farmers and the extent to which they rely on genetic traits, rather than purchased inputs, to combat biotic and abiotic pressures. Thus the experiment was conducted with the objectives of evaluating the performance of improved bread wheat varieties for diseases resistance and yielding potential under different agro-ecological conditions of the area.
Materials and Methods
Description of the study areas
The study was carried out on three locations i.e., Aneded (On station), Baso Liben and Debire Elias districts of East Gojjam; major wheat potential growing areas of the region. The study zone is dominated by three major agro-ecologies: highlands (2300-3200 masl), midlands (1500-2300 masl) and lowlands (500-1500 masl). In all study areas mixed crop-livestock farming is the predominant mode of agricultural production. Wheat, tef, barley and maize are the major cereal crops, together with pulses, oil crops and vegetables. Aneded’s testing site was located at an altitude of 2480 meter above sea level (masl). The minimum and maximum temperature ranges from 11.8°C to 27.2°C and receives adequate rainfall of 1500 mm per annum. The site at Baso Liben district was located at 2780 masl and receives a mean annual rainfall of 1020 mm with a monthly mean minimum and maximum temperature of 7.9°C and 18.6°C, respectively. Whereas, Debre Elias testing site was located at an altitude of 2220 masl with average annual rainfall of 1600 mm with minimum and maximum temperature of 17°C and 27°C [2].
Materials and experimental design
Ten improved commercial varieties released from Ethiopian Institute of Agricultural Research, were used to execute the experiment. Randomized Complete Block Design (RCBD) with two replications at three testing locations was applied for the experiment. Four rows of 0.2 m spacing between rows and 3.0 m row length was used for harvestable plot size of (2.4 m2). Seed rate of 150 kg ha-1 and fertilizer rate of 200 kg ha-1 NPS and 150 kgha-1 UREA were used. UREA was applied in split form. All other agronomic practices were performed as per the recommendation across all the test locations.
Agronomic data: All agronomic, yield and yield related components were recorded on the middle four rows of each plot. The parameters from which data was collected along with their details are mentioned below:
Plant Height (PH): Average heights of ten plants in each experimental plot were measured in centimeters from ground level to the tip of the spike, excluding awns.
Above Ground Biomass Yield (AGBY): The weight of all four central row plants including tillers harvested at the level of the ground.
Spike Length (SL): The main spikes from ten plants were measured and averaged to represent the spikes length in centimeters.
Grain yield (GY): Grain yield in g/plot at 12% moisture content was recorded and converted to kg/hectare.
Diseases assessment
Disease assessments were conducted on weekly basis after the disease on set date. Septoria disease was measured on the basis of a double-digit scale. The first digit (0-9) represents the leaf blotch upward migration on the plant, and the second digit (0-9) determines the severity of the total foliar infection of leaves. Scoring of yellow rust diseases were conducted based on the field response and the percentage of infected tissue (severity) [3]. Rust severity (%) was estimated as a percentage of leaf area covered by rust. Plant reaction (infection type) was expressed in five types; immune (0), Resistant (R), Moderately Resistant (MR), Moderately Susceptible (MS) and Susceptible (S). Disease parameters for individual varieties were recorded using the following formula.
Disease incidence (%)=(No. of diseased plants/Total no. of plants examined) × 100
Disease severity (%)=(Area of plant tissue infected/Total area of the plant part examined) × 100
Area under disease progress curve was calculated using the equation suggested by Arama, et al.
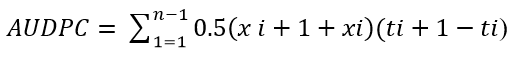
Where, xi=The average coefficient of infection of ith record
X i+1=The average coefficient of infection of i+1th record
t i+1-ti=Number of days between the ith record and i+1th record
n=Number of observations.
Statistical analysis
The collected data from each of the three locations were subjected to Analysis of Variance (ANOVA). Comparison of treatment means was made using least significant difference (LSD0.01 and LSD0.05) values were used for mean separation. The relationship between disease parameters with yield and yield components were correlated using the Pearson’s correlation procedures of SAS computer software package version 9.0.
Results and Discussion
The combined Analysis of Variance (ANOVA), revealed statistically significant differences in growth parameters, disease intensity, mean grain yield and other quantity traits between varieties, locations and varieties by locations interactions across the testing sites (P<0.01 and P<0.05) [4,5]. However, non-significant variations were observed on locations by varieties interaction effect on terminal septoria and yellow rust diseases (Table 1).
| Source of variation | DF | Squares mean | ||||||
| PH (cm) | AGBM (t/ha-1) | Septoria (TS) | AUDPC (% days) | Yellow rust | SPL (cm) | Yield (t/ha-1) | ||
| Replication | 1 | 11.21ns | 0.07ns | 416.07** | 537706.67** | 20.42ns | 0.50ns | 0.22ns |
| Locations | 2 | 286.80** | 72.95** | 328.47** | 823734.02** | 458.75** | 11.93** | 3.40** |
| Varieties | 9 | 133.45** | 9.17** | 1509.44** | 1180895.29** | 1949.12** | 2.43** | 2.43** |
| Location × Varieties | 18 | 26.33** | 4.83** | 190.02ns | 207078.28** | 48.57ns | 0.47* | 0.59** |
| Error | 18 | 5.48 | 1.46 | 90.14 | 62614.3 | 26.44 | 0.17 | 0.11 |
| R2 | 0.96 | 0.93 | 0.92 | 0.94 | 0.98 | 0.95 | 0.95 | |
| CV (%) | 2.52 | 10.68 | 16.56 | 19.44 | 22.6 | 4.94 | 7.23 | |
| Note: DF: Degree of Freedom; PH: Plant Height in cm; AGBM: Above Ground Biomass Weight in ton per hectare, Septoria TS: Terminal Severity; AUDPC: Area Under Disease Progress Curve % in days, SPL: Spike Length in cm, *Significant at 0.05, **Significant at 0.01, ns: non-significant. | ||||||||
Table 1: Combined analysis of variance for various traits of improved bread wheat varieties evaluated at three locations during 2022/23 cropping season.
Septoria disease severity and area under disease progress curve
There were significant (P<0.05) variations among the varieties in levels of terminal septoria disease severity and Area Under Disease Progress Curve (AUDPC) (Table 2). Among the tested locations, the highest septoria disease severity 84.0%, 83.5% and 78.5% were recorded on Wane, Lemu and Hidase varieties at Debre Elias testing site in the ordered mentioned. Also, the highest AUDPC value of 2539.8%, 2413.3% and 2041.8%-days were also recorded on Wane, Lemu and Dursa varieties, at this testing site, respectively. This may be due to the environmental suitability for disease development in this area [6]. While the lowest disease severity, 26.5% on Boru and 32.0% on Danda’a varieties were recorded at on station and Baso Liben testing locations, respectively. Similarly, the lowest AUDPC values of 574.5% days was recorded on Boru variety at Baso Liben testing site followed by 656.0 % days AUDPC record at Debre Elias testing site on Danda'a variety. The area under the disease progress curve is a useful quantitative summary of disease intensity over time, for comparison across years, locations, or management tactics. This is because; AUDPC represents both the amount of infection of the disease and the rate at which the disease or pathogen has increased during an epidemic. Boru and Danda'a varieties showed the lowest AUDPC values in areas of higher septoria disease prevailing areas.
Yellow rust disease
There were a significant (P<0.01) variations among the tested varieties in reactions of yellow rust severity at all locations (Table 2). The highest yellow rust disease severity was recorded on Ogolcho (70% S) and Hidase (65% S) varieties which are widely grown in the area and becoming out of production because of the disease. However, the lowest yellow rust disease severity was recorded on Boru (5%) variety at all testing locations. Boru variety showed lower disease severity for major disease (yellow rust, septoria, fusarium head blight) of the area and can be grown for broad agro ecologies. Even if, variability existed across the testing locations for yellow rust severity among the bread wheat varieties, no varieties showed immune rust reaction throughout the season in all tested locations. This might be due to the evolvement of new race in the involvement of exotic race of pathogen. The growth and development of wheat was adversely affected by yellow rust at all testing locations. The result is in line with the finding that early disruption of the plant’s photosynthetic capacity and competition with reproductive structures by the pathogen leaves less assimilate available for grain fill than situations where rust infection occur later.
| On station | Debre Elias | Baso Liben | |||||||
| Variety | Septoria (TS) | AUDPC (% days) | Yellow rust | Septoria (TS) | AUDPC (% days) | Yellow rust | Septoria (TS) | AUDPC (% days) | Yellow rust |
| Boru | 26.5d | 590.5c | 12.5b | 37.0c | 932.3de | 2.5d | 37.0d | 574.5d | 5.0d |
| Kakaba | 75.5a | 1691.8a | 15.0b | 69.0ab | 1824.5bc | 15.0c | 72.0ab | 1383.0bc | 12.5cd |
| Balicha | 42.0dc | 736.5bc | 10.0b | 57.0b | 1177.8de | 10.0c | 62.5abc | 1438.0abc | 15.0cd |
| Daka | 47.5bcd | 993.5abc | 15.0b | 32.5c | 706.0e | 12.5c | 37.0d | 730.d | 22.5c |
| Danda’a | 52.5abcd | 1218.3abc | 15.0b | 32.5c | 656.0e | 15.0c | 32.0d | 663.0d | 17.5c |
| Dursa | 59.0abc | 1354.5abc | 17.5b | 78.0a | 2041.8ab | 10.0c | 68.0ab | 1736.0ab | 20.0c |
| Lemu | 68.5ab | 1367.0ab | 15.0b | 83.5a | 2539.8a | 10.0c | 77.5a | 1925.0a | 22.5c |
| Wane | 72.5ab | 1558.3a | 25.0b | 84.0a | 2413.3a | 15.0c | 67.5ab | 1295.3bc | 20.0c |
| Ogolcho | 56.5abc | 1201.8abc | 60.0a | 69.0ab | 1452.0cd | 55.0a | 51.5bcd | 924.5cd | 70.0a |
| Hidase | 53.5abc | 1266.8abc | 65.0a | 78.5a | 1448.3cd | 27.50b | 42.0cd | 764.8d | 55.0b |
| Mean | 55.3 | 1198.35 | 25 | 62 | 1519.15 | 17.25 | 54.7 | 1143.4 | 26 |
| CV (%) | 20.84 | 28.71 | 28.13 | 13.24 | 16.23 | 16.87 | 20.56 | 20.12 | 17.2 |
| LSD(0.05) | 26.09 | 778.37 | 19.15 | 18.56 | 557.74 | 6.59 | 25.44 | 520.34 | 10.12 |
| Note: Septoria TS: Terminal Severity, AUDPC: Area Under Disease Progress Curve % in days, SPL: Spike Length in cm, *significant at 0.05. | |||||||||
Table 2: Combined analysis of variance for various traits of improved bread wheat varieties evaluated at three locations during 2022/23 cropping season.
Plant height
The analysis of variance indicated that plant height was significantly varied at p<0.05 among the tested varieties under testing locations. Among wheat varieties, the maximum (102.0 cm) plant height was recorded on Ogolcho variety, followed by 101.4 cm plant height noted in variety Danda’a (Table 3) which were recorded at Baso liben experimental site. The shortest plant height of 78.83 cm was observed on Wane variety at Debre Elias experimental site. In agreement with the present study, Solomon reported a significant variation in plant height among different bread wheat varieties. These results are further supported by Yu who reported considerable variation in the plant height of different wheat varieties when planted under various environments. Biological diversity was observed in different wheat varieties and advanced lines under multienvironment trials by Ozgen and Voltas et al., while the growth response in varieties differed with the environmental conditions [7].
Above ground biomass yield (t/ha-1)
Above ground biomass yield was showed significant (P<0.01) variations among varieties tested across locations and the maximum biological yield (15.63 t/ha-1) was recorded on Danda’a variety at Baso Liben testing site. It was also observed that above ground biomass yield was markedly higher on Boru and Daka when compared to the rest of the varieties tested. While, Hidase (6.58 t/ha-1) and Wane (6.96 t/ha-1) varieties at Debre Elias testing site recorded the lowest biomass yield than other varieties because of higher septoria diseases severity. There was a severe defoliation and destruction of the green leaf tissues of photosynthetic area of infected leaves causes withering of leaves of the crop. Moreover, for the biomass yield, since disease severity was higher at Debre Elias, a high significant difference was observed between varieties across testing locations. Biomass reductions were due to the effects of disease associated with a reduced capacity of the canopy to absorb solar radiation, suggesting that the disease could affect the photo-synthetic activity at the leaf or canopy level.
Spike length (cm)
The spike length was influenced significantly (P<0.05) by testing bread wheat varieties of wheat. The highest (10.5 cm) spike length was recorded at Aneded (On-station) on Daka variety followed by Boru and Lemu varieties with average spike length of 10.3 cm and 10.0 cm, respectively. However, non-significant variations were observed between them. The lowest spike length of 6.50 cm was recorded in variety wane at Debre Elias testing site. Statistically the differences between Wane, Balcha, Ogolcho and Kakaba were non-significant (P>0.05). Similarly, it was observed that Boru variety showed remarkable position in spike length under soil and climatic conditions of all experimental locations. Most of the evaluated cultivars exhibited better performance in spike length at on-station and Baso Liben testing locations than Debre Elias site due to relatively lower septoria disease severity in those locations [8]. These results are in concurrence to the finding of Voltas et al. who found that spike length were genetically influenced by the breeding material for development of wheat cultivars developed in different environmental conditions.
Grain yield (GY) (ton ha-1)
According to the results of ANOVA, the tested varieties were found to have a statistically significant effects (p<0.01) on grain yield in the tested locations (Table 3). The variations for grain yield was ranged from 2.96 t ha-1 to 6.33 t ha-1 with a mean value of 4.66 t ha-1 during the growing season. The maximum grain yield of (6.33 t ha-1) at Baso Liben, (6.0 t ha-1) at on station and (5.56 t ha-1) at Debre Elias was obtained from Boru variety The second highest grain yield (5.68 t/ha-1) was recorded from Daka variety at Baso Liben testing site. Thus, the highest grain yield (6.33 t ha-1) obtained from Boru variety at Baso Liben testing site exceeded the yield obtained from Daka, Hidase, Ogolcho and Lemu by about 11%, 31%, 55% and 68%, respectively at the same location. This higher grain yield might be associated with genetic make of parental material of these varieties, because under similar soil, climate, input and crop management conditions, the grain yield differed significantly. Thus the adaptability and genetic make-up of the parental material leads low disease severity of the variety in the tested environmental conditions. Similar study has been reported that the main factor affecting yield in wheat is its genetic structure. Therefore, genotypes should be evaluated in different environments; i.e., on multiple locations or over different years to determine the grain yield potential. While the lowest grain yields of 2.96 t ha-1 were recorded on wane variety because of higher septoria infection. Almost all evaluated varieties showed relatively lower grain yield at Debre Elias testing location. This might be of the presence of higher septoria disease pressure in the area. However, some varieties gave higher yield in Debre Elias testing site than other locations because of its genetic resistance for septoria disease. Thus, Danda’a variety evaluated at Debre Elias, recorded the highest grain yield than the other testing sites. These result is in line with the study of Porfiri et al. reported that grain yield of wheat varieties is mostly associated with the environmental conditions. Therefore, genotypes should be evaluated in different environments; i.e., in multiple locations or over different years to determine the grain yield potential. As not only hereditary affects the yield potential of the varieties but also abiotic and biotic stress factors have a role in the variation of genotype responses in different climates and soil structures.
| Variety | Aneded | Debre Elias | Baso Liben | |||||||||
| PH (cm) | AGBM (t/ha-1) | SPL (cm) | Yield (t/ha-1) | PH (cm) | AGBM (t/ha-1) | SPL (cm) | Yield (t/ha-1) | PH (cm) | AGBM (t/ha-1) | SPL (cm) | Yield (t/ha-1) | |
| Boru | 97.0a | 13.13a | 10.3ab | 6.00a | 88.50bc | 10.67b | 8.83a | 5.56a | 97.60c | 13.33abc | 9.25a | 6.33a |
| Kakaba | 90.9dc | 11.25ab | 9.0bcd | 4.78bcd | 92.83ab | 10.04bc | 7.33cd | 4.81bc | 95.50d | 10.63cd | 8.55b | 5.51bc |
| Balicha | 93.5bcd | 13.54a | 7.7d | 5.06bc | 88.50bc | 9.5bcd | 6.67cd | 4.70c | 87.20f | 12.92abc | 8.20bc | 5.26bc |
| Daka | 99.0ab | 13.54a | 10.5a | 5.45ab | 89.33bc | 10.00bc | 8.33ab | 3.77d | 99.80b | 12.50bc | 8.40bc | 5.68ab |
| Danda’a | 100.5a | 12.67ab | 9.1bc | 4.12de | 96.67a | 13.63a | 8.50a | 5.41ab | 101.4ab | 15.63a | 8.20bc | 5.14bcd |
| Dursa | 88.8d | 13.13a | 8.2cd | 5.34ab | 85.67cde | 7.71cde | 7.50bc | 3.74d | 85.80f | 9.58d | 8.15bc | 4.40def |
| Lemu | 99.5a | 13.54a | 10.0ab | 4.35cde | 87.67bcd | 7.38ef | 7.33cd | 3.77d | 90.00e | 10.63cd | 9.05a | 3.77f |
| Wane | 96.2abc | 12.08ab | 8.1cd | 4.79bcd | 78.83e | 6.96ef | 6.50d | 2.96e | 87.0f | 13.54ab | 8.00c | 4.93bcd |
| Ogolcho | 100.1a | 10.25b | 9.4abc | 3.96e | 98.17a | 8.79def | 7.17cd | 3.69d | 102.0a | 13.13abc | 8.30bc | 4.09ef |
| Hidase | 96.0abc | 10.25b | 8.6cd | 4.00e | 81.0de | 6.58f | 7.33cd | 3.57de | 90.60e | 13.33abc | 8.15bc | 4.83cde |
| Mean | 96.15 | 12.34 | 9.09 | 4.78 | 88.72 | 9.13 | 7.55 | 4.2 | 93.69 | 12.52 | 8.43 | 4.99 |
| CV (%) | 2.74 | 9.88 | 6.69 | 6.75 | 3.49 | 8.98 | 5.59 | 6.82 | 0.91 | 9.7 | 2.6 | 7.31 |
| LSD(0.05) | 5.97 | 2.76 | 1.38 | 0.73 | 7.01 | 1.85 | 0.96 | 0.65 | 1.92 | 2.75 | 0.5 | 0.83 |
| Note: PH: Plant Height in cm; AGBM: Above Ground Biomass weight in ton per hectare; SPL: Spike Length in cm, *significant at 0.05. | ||||||||||||
Table 3: Combined analysis of variance for various traits of improved bread wheat varieties evaluated at three locations during 2022/23 cropping season.
Correlation between disease parameters, yield and yield components
Correlation coefficients are useful in finding the degree of overall linear association between any two attributes. Correlation coefficients between the studied traits under the testing locations were presented (Table 4). The significant positive correlations were recorded between plant height and spike length (r=0.531**) and biomass weight (r=0.577**) in the season. Also, spike length and above ground biomass weight were also recorded positive correlations (r=494**). Grain yield was also displayed a significant positive correlation with plant height (r=0.357**), spike length (r=0.405**) and biomass weigh (r=0.646**) in the growing season.
The Pearson correlation coefficient analysis revealed that inverse relation was present between the disease score levels and grain yield (Table 4). This is the implications of septoria disease, AUDPC and yellow rust diseases which directly affects the kernel quality of wheat grains resulting yield reduction. These is an indication of that the yield components are largely responsible for the determination of grain yield in individual plants. On the other hand, grain yield, above ground biomass and spike length displayed significantly negative correlation with yellow rust (r=-0.362**, r=-0.006**, r=-0.034* ), respectively. Also, grain yield, spike length, above ground biomass and plant height was also negatively correlated with septoria disease severity r=-0.568**, r=-0.351**, r=-0.579* , r=-0.0.476**) in the order mentioned [9]. The correlation of above ground biomass and grain yield with septoria disease severity and its AUDPC were relatively strong negative relation indicating that the overall effect of septoria disease severity had high negative impact on above ground biomass weight and grain yield reduction. Similarly, yellow rust disease severity found a negative correlation to above ground biomass and grain yield of bread wheat. A strong positive correlation was also observed between septoria disease severity and audpc with correlation coefficients of r=0.894**. This result indicated that cultivars which were severely infected by septoria disease showed higher AUDPC value.
| Sep | AUDPC | Yr | PH | BM | SPL | YLD | |
| Sep | 1 | ||||||
| AUDPC | 0.894** | 1 | |||||
| Yr | 0.04 | -0.083 | 1 | ||||
| PH | -0.476** | -0.530** | 0.319* | 1 | |||
| BM | -0.579** | -0.645** | -0.006 | 0.577** | 1 | ||
| SPL | -0.351** | -0.353** | -0.034 | 0.531** | 0.494** | 1 | |
| YLD | -0.568** | -0.602** | -0.362** | 0.357** | 0.646** | 0.405** | 1 |
Table 4: Correlation coefficient (r) among disease parameters, yield and yield components during 2023/24 main cropping season.
Conclusion
Based on the results of the study, significant variations among the tested bread wheat varieties for disease reactions as well as yield and yield related traits were recorded. Almost all tested varieties were affected by septoria and yellow rust diseases in different severities in all testing sites. This could be duo to the genetic variability and environmental factors. Among the tested bread wheat varieties Boru and Daka were identified as resistance to yellow rust and septoria leaf blotch diseases across the testing locations. Therefore, Boru and Daka are the best varieties gave the better grain yields recommended for the areas. Lemu, Wane and Dursa varieties were highly infected with septoria disease than yellow rust disease. Thus, these varieties should be grown in areas where septoria disease epidemic is lower. Significant reduction in spike length, grain yield, and thousand kernel weights was occurred due to yellow rust and septoria diseases epidemic. The performance of theses varieties will be decreases due to change in weather condition for prevailing pathogen. There is also a need to a broader genetic base and to replace the old varieties with new and improved ones. Recommendations of several varieties will also help farmers to select high yielder and diseases resistance varieties.
Acknowledgment
The author greatly acknowledged Ethiopian Institute of Agricultural Research, Debre Markos Agricultural Research Center for financial and administrative supports.
Conflict of Interest
The author declared that there is no any conflict of interests.
References
- Alemu A, Getnet M. Yield loss assessment in bread wheat varieties caused by yellow rust (Puccinia striiformis f. sp. Tritici) in Arsi highlands of South Eastern Ethiopia. Am J Biosci. 2019;7:104-112.
- Ali S, Shah SJ, Ibrahim M. Assessment of wheat breeding lines for slow yellow rusting (Puccinia striiformis f. sp. Tritici). Pak J Biol. 2007;10:3440-3444.
- Arama PF, Parlevliet JE, van Silfhout CH. Heading date and resistance to septoria tritici blotch in wheat not genetically associated. Euphytica. 2000;106:63-68.
- Asela K, Yitagesu T. Yield loss assessment of wheat Septoria leaf blotch (Zymoseptoria tritici) disease in Central Highland parts of Ethiopia. World J Agric Sci. 2023;19:138-142.
- Ayele B, Fehrmann H, Yahyaoui A. Status of wheat stripe rust (Puccinia striiformis) races and their virulence in major wheat growing areas of Ethiopia. Pest Manag J Ethiop. 2008;12:1-7.
- Braun HJ, Atlin G, Payne T. Multi-location testing as a tool to identify plant response to global climate change. 2010;115-138.
- Eyal Z, Levy E. Variations in pathogenicity patterns of Mycosphaerella graminicola within Triticum spp. in Israel. Euphytica. 1987;36(1):237-250.
- Gebeyehou G, Knott DR, Baker RJ. Relationships among durations of vegetative and grain filling phases, yield components, and grain yield in durum wheat cultivars. Crop Sci. 1982;22(2):287-290.
- Tabib Ghaffary SM, Faris JD, Friesen TL, Visser RG, van der Lee TA, Robert O, et al. New broad-spectrum resistance to septoria tritici blotch derived from synthetic hexaploid wheat. Theor Appl Genet. 2012;124(1):125-142.
[Crossref] [Google Scholar] PubMed]
Citation: Bekele B (2025) Performance Evaluation and Diseases Reaction of Bread Wheat (Triticum aestivum L.) Varieties in East Gojjam, North Western Ethiopia. J Plant Pathol Microbiol. 16:767.
Copyright: © 2025 Bekele B. This is an open-access article distributed under the terms of the Creative Commons Attribution License, which permits unrestricted use, distribution, and reproduction in any medium, provided the original author and source are credited.