Indexed In
- Academic Journals Database
- Genamics JournalSeek
- Academic Keys
- JournalTOCs
- China National Knowledge Infrastructure (CNKI)
- Scimago
- Access to Global Online Research in Agriculture (AGORA)
- Electronic Journals Library
- RefSeek
- Directory of Research Journal Indexing (DRJI)
- Hamdard University
- EBSCO A-Z
- OCLC- WorldCat
- SWB online catalog
- Virtual Library of Biology (vifabio)
- Publons
- MIAR
- University Grants Commission
- Geneva Foundation for Medical Education and Research
- Euro Pub
- Google Scholar
Useful Links
Share This Page
Journal Flyer
Open Access Journals
- Agri and Aquaculture
- Biochemistry
- Bioinformatics & Systems Biology
- Business & Management
- Chemistry
- Clinical Sciences
- Engineering
- Food & Nutrition
- General Science
- Genetics & Molecular Biology
- Immunology & Microbiology
- Medical Sciences
- Neuroscience & Psychology
- Nursing & Health Care
- Pharmaceutical Sciences
Research Article - (2019) Volume 11, Issue 3
Organic Waste Reduction by Co-digestion of Slaughterhouse Wastewater and Domestic Sludge
Salah SB Dababat*Received: 02-Apr-2019 Published: 25-Apr-2019
Abstract
This research was executed to investigate the reduction of the volatile and solid matter in the Co-digestion of slaughterhouse wastewater (SHW) with primary sludge (PS). Lab-scale experiment was executed at mesophilic condition (35 ± 2°C). 600 ml serum bottles were used to mimic batch bioreactors. Among others total solids content (TS), volatile solids (VS) were measured before and after the digestion process. In addition to recording the daily biogas and methane production.
The experiment showed that PS achieved maximum volatile solid reduction (49%), while the organic stabilization percentage of each SHW and Co-digestion mixture (Co) were 29.1% and 44.4% respectively. The solid stabilization was at maximum value (63%) at PS reactor compared to SHW and co-reactors (39.5% and 49.8% correspondingly).
Introduction
Anaerobic digestion (AD) is one of the oldest and well-studied technologies for stabilizing organic wastes [1,2]. AD is a biological process where organic compounds are broken down to simple components specifically under anaerobic conditions. Organic matter is broken down through four stages namely hydrolysis, acidogenesis, acetogenesis and methanogenesis. Among the treatment technologies available for treating organic wastes, AD is very suitable because of its limited environmental impacts [3].
Many researches have been performed on the AD process development and improvement in order to enhance biogas production, achieve faster degradation rates and reduce the amount of final residue to be disposed [4,5]. Conventionally, for treatment purposes AD is operated for a single substrate, but it is turned into more stable process when applied for variety of substrates at the same time; called co-digestion process. Co-digestion is defined as a digestion of a homogenous mixture of two or more substrates [6].
Materials and Methods
The experiment was carried out by using small reactors remain enclosed for specific duration as batch system. Lab scale experiment was performed by using 7 batches. Each reactor was made from serum bottle with volume 600 ml, seal by septum rubber and aluminium cap, in addition to pipe and needles (Figure 1) [7]. At the beginning, each reactor was inoculated by using fully inoculum from fully operated WWTP. The inoculum was brought from a fullscale anaerobic digester, which is operated by WWTP Nablus-West at 35°C. It was transferred in 10 litres polyethylene containers. Drop in inoculum`s temperature during the transportation was taken into consideration, by using a Styrofoam Box and cooler box, with hot water bottles to keep temperature inside the box within the acceptable range around the 35°C. To check the imported Inoculum activity, it was inserted into the serum bottle. Pure nitrogen gas (N2) gas was used to flush the bottle headspace and gloves were put on the top of the bottle in order to check gas formation. The bottle was kept in incubator at 35 ± 2°C for few days.
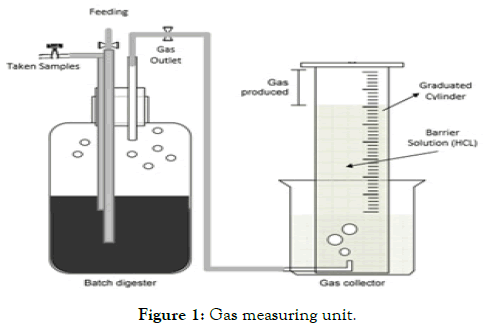
Figure 1. Gas measuring unit.
The Sludge sample (PS) was imported from the primary settling tank at WWTP Nablus-West. The Slaughterhouse Wastewater (SHW) sample had been collected from Nablus municipality slaughterhouse during slaughtering period, which extends for 3 to 4 hours daily. More than 12 samples were collected during this period and then mixed together to make a representative sample.
The samples were taken out from the sewer system of the slaughterhouse facility through a manhole located within the slaughtering room (Figure 2). Which mean, the SHW sample did not include toilet or other activity wastes. It is a sample of water, blood, and pieces of meat and fat from washing the slaughtered animals. Table 1 presents the raw characteristics of the tested substrates.
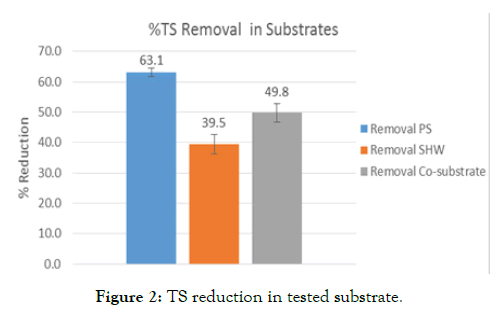
Figure 2. TS reduction in tested substrate.
| Parameters | PS | SHW | Inoculum |
|---|---|---|---|
| PH | 5.77 | 6.7 | 7.18 |
| TS (g/L) | 18 ± 0.11 | 7.2 ± 0.16 | 21.6 ± 0.18 |
| VS (g/L) | 14.51 ± 0.13 | 6.46 ± 0.17 | 11.45 ± 0.11 |
| COD(mg/L) | 16400 | 8500 | 16200 |
| ALK (mg CaCO3/L) | 3450 | 1150 | 3700 |
| VFA (mg CH3COOH/L) | 2332 | 340 | 340 |
Table 1: Characteristics of raw tested substrate.
The reactors contents were prepared according to specific mixing ratios. Practically, since production of biogas from domestic sludge is a proven technology and well accepted in world, the Co-digestion sample for had been prepared to have at least 50% of its volume from domestic sludge sample PS. Table 2 list the proportions of substrates in all reactors.
| Reactor | %Contribution in mixture (%volume) | Inoculum: Substrate ratio (based on VS) |
|
|---|---|---|---|
| PS | SHW | I : S | |
| D-PS | |||
| D 1 | 100% | 0% | 2:1 |
| D 2 | 100% | 0% | 2:1 |
| D-SHW | |||
| D 1 | 0% | 100% | 2:1 |
| D 2 | 0% | 100% | 2:1 |
| D-CO | |||
| D 1 | 50% | 50% | 2:1 |
| D 2 | 50% | 50% | 2:1 |
| Blank | 0% | 0% | --- |
Table 2: Proportions of substrates in reactors.
Existing of an ambient air in digester headspace means that the initial condition inside the digester contains oxygen gas. This is not perfectly anaerobically condition and it is impossible for anaerobic bacteria to survive long enough to produce significant gas. To overcome this problem, N2 gas was used for flushing reactors headspaces (Figure 3).
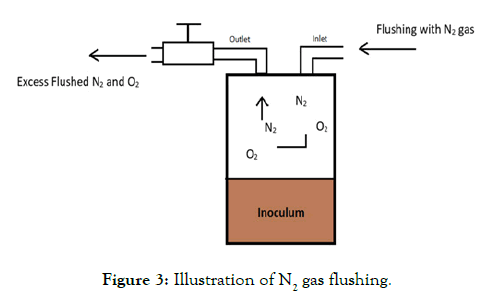
Figure 3. Illustration of N2 gas flushing.
The Physical and Chemical parameters for the raw collected samples also the digesters feeds have been analysed before and after digestion process. Total solid (TS), volatile solid (VS) were analysed according to standard methods for examination water and wastewater [8].
The pH values for all the substrates and the reactors contents were examined according to standard methods for examination water and wastewater [8]. pH measured by using pH-meter (JENWAY pH meter 3310 from the Jenway Ltd Company, UK). The normal limits of accuracy reported for this method are ± 0.01 unit. The Chemical Oxygen Demand (COD) has been considered as a measurement for organic compound, COD was determined using the HANNAHI 83214 Multiparameter bench photometer. Organic Acids and Buffer capacity have been determined by using Nordmann method of 1977.
In order to obtain the total volume of the produced biogas, it collected by water displacement method using Hydrochloric acid (HCl) solution with pH lower than 2 was used to collect the produced biogas. Biogas sample was taken by syringe from the collected gas and then injected into multi gas detector (portable biogas analyser) to determine the per cent of methane. The volume of the produced gas has been measured daily and ambient temperature was recorded from the laboratory Temperature Control Unit. The measured volumes for both methane and biogas have been converted to STP (Standard Temperature and Pressure); 0°C and 101.325 kPa.
Results and Discussion
I/S is the ratio of inoculum (bacteria cell) to grams of feed (organic matter) [9]. Many literatures consider I/S ratio as the major parameter effects on the digestion process [10]. Because it is responsible on presence of the microorganism’s groups that needed to carry out the digestion process. Generally, to maintain a stable digestion system, I/S is recommended to be equal or more than 2 (based on VS) [11,12].
Total solids analysis
By monitoring and analysing to the solid contents of the influent and effluent substrates, the effectiveness of anaerobic digestion can be verified, through the reduction percentage in total solid content. The maximum TS reduction was achieved by PS reactor (D-PS) about 63.1%. The Co-digestion reactor (D-CO) reached 49.8% as TS reduction. The reactor of SHW (D-SHW) had reached to 39.5 as reduction percentage in its TS content. From the represented data, it could be stated that the solids content was reduced in all reactors during the experiment; this gives an indication about performance of digestion process.
Volatile solid analysis
Measurement of VS during the digestion process (influent and effluent) gives an indication for the amount of waste that has been stabilized during the process, the percent of the stabilized organic matter primarily depends on the system configuration and the substrate’s physical-chemical characteristics, these measurements (influent and effluent) can be used to control the digester efficiency [13]. The highest VS reduction was observed in PS reactor, about 49% out of its VS content, SHW reactor reached to 29.1% as a reduction in VS content. The percentage of VS Reduction in Codigestion reactor (mixture of SHW and PS) was about 44.4%. The lower reduction in VS content was observed in SHW; because, it contained compounds that degrade slowly such as protein. In contrast, higher degradation percent was reported for both PS sample, and Co-digestion sample (mixture of SHW and PS).
While, the highest percentage of VS reduction was obtained in case of PS digestion (as it is illustrated in Figure 4), this can be explained as following, PS sample has more biodegradable compounds, and less complex compounds comparing with the other tested substrate. This is an evidence of the compatibility between hydrolysis, acidogenesis and methanogenesis stages during the digestion process, since if one of the digestion process steps was disrupted, then the whole process will be affected including organic matter decomposition and gas production. From the discussed data, it can be concluded that PS sample has the highest biodegradable volatile solids than SHW; actually it’s using helps in enhancing the TS and VS removal from SHW sample, as it was reported in case of Alvarez et al. [6] and Borowski et al. [12]. As a summary, at the beginning of the digestion process the total solids (TS) and volatile solids (VS) content in each reactor were higher than them at the end of digestion process, From the represented data, it is apparently clear that both contents of TS and VS have been significantly reduced.
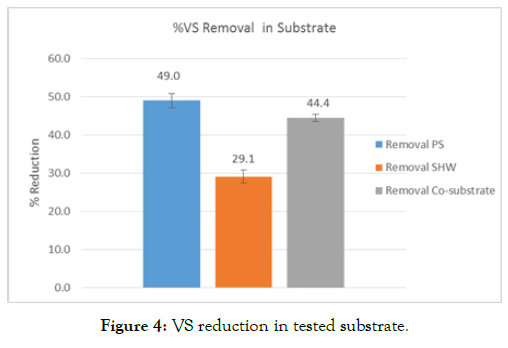
Figure 4. VS reduction in tested substrate.
Linear modelling for biogas production
Multiple regression analyses were performed by using MATLAB software to formulate the mathematical equation for stimulating biogas production. The yield of biogas is significantly affected by the pH, alkalinity, and VFA values of the feed substrates. Linear modelling of those parameters could better explain the biogas yield (R2=0.99). Here it must be mentioned, that this regression model is applicable for biogas production from digestion SHW and PS as feedstock’s, at temperature 35 ± 2°C, in a batch system, I/S=2, at a lab-scale reactor.
MATLAB program (Regression Model)
% x1=’PH’
% x2=’Alkalinity(g/L)’
% x3=’Volatile Fatty Acid(g/L)’
x1=[5.77,5.77,6.7,6.7,6.05,6.05]’;
x2=[3.45,3.45,1.15,1.15,3.325,3.325]’;
x3=[2.332,2.332,0.340,0.340,1.336,1.336]’;
% y=’’gas per 1 gram of Volatile solid in ‘’
% y=[410.1,412.8,426.9,440.6,501.3,498.3]’;
X=[ones(size(x1)),x1,x2,x3];
%a = ‘Coefficient of regression’ a=X\y
% Predicted Values
yp=X*a
%Max_Percent error
Error= 100*max((abs(yp-y)./y))
x1=’PH’
x2=’Alkalinity(g/L)’
x3=’Volatile Fatty Acid(g/L)’
A=a(1)
B=a(2)
C=a(3)
D=a(4)
model = ‘gas = A + B * x1 + C * x2 + D * x3’
MATLAB Run
% % x1=’PH’
% x2=’Alkalinity(g/L)’
% x3=’Volatile Fatty Acid(g/L)’
% x1=[5.77,5.77,6.7,6.7,6.05,6.05]’;
% x2=[3.45,3.45,1.15,1.15,3.325,3.325]’;
% x3=[2.332,2.332,0.340,0.340,1.336,1.336]’
% y=’’gas per 1 gram of Volatile solid in ‘’
% y=[410.1,412.8,426.9,440.6,501.3,498.3]’
X=[ones(size(x1)),x1,x2,x3];
>> %a = ‘Coefficient of regression’ a=X\y
a =
0
54.3938
85.1345
-84.0979
>> % Predicted Values yp=X*a
yp =
411.4500
411.4500
433.7500
433.7500
499.8000
499.8000
>> %Max_Percent error
Error= 100*max((abs(yp-y)./y))
Error = 1.6046
>> x1=’PH’ x2=’Alkalinity(g/L)’ x3=’Volatile Fatty Acid(g/L)’
x1 = PH
x2 = Alkalinity(g/l)
x3 = Volatile Fatty Acid(g/L)
>> A=a(1) B=a(2) C=a(3)
A = 0
B = 54.3938
C = 85.1345
D = -84.0979
>> model = ‘gas = A + B * x1 + C * x2 + D * x3’
model =
gas = A + B * x1 + C * x2 + D * x3
>>
The regression model predicts the following equation:
Y= 54.3938 x PH + 85.1345 x ALK – 84.0979 x VFA
Where:
Y: Biogas yield from 1 g VS feed (ml).
pH: pH value of tested substrate.
ALK: Alkalinity content in feed substrate (g/l).
VFA: Volatile fatty acid content in feed substrate (g/l).
Correlation coefficient R2=0.9995 was obtained, this means the predicted values of biogas yield were very close to the measured values. Draw of model values and actual values are displayed in Figure 5.
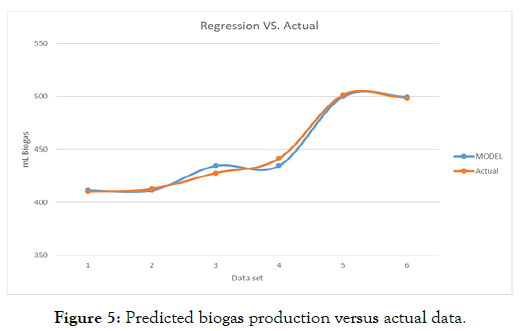
Figure 5. Predicted biogas production versus actual data.
Conclusions
Based on the results of this study, the following were observed:
• Addition of PS in digestion of SHW enhanced organic and solid reduction.
• Regression model is an appropriate approach, with higher adjusted R2 value, to predict biogas production.
• Volatile fatty acids (VFA), alkalinity (ALK) and pH value were the most important predictors affecting biogas production from different substrates.
• Co-digesting PS with SHW is a suitable strategy to increase biogas production in WWTP Nablus-West.
Acknowledgments
The authors thank Prof. Dr. Marwan Haddad of the Water and Environmental Studies Institute, An-Najah National University for supervising and providing the scholarship under the Palestinian- Dutch Academic Cooperation Program on Water (PADUCO) and allowing this research to be undertaken. Thanks are extended to the colleagues from the WWTP Nablus-West.
REFERENCES
- Lier JB, Tilche A, Ahring BH, Macarie H, Moletta R, Dohanyos M, et al. New perspectives in anaerobic digestion. Water Sci Technol. 2001;43(1):1-18.
- Moosbrugger RE, Wentzel MC, Loewenthal RE, Ekama GA, Marais GVR. Alkality measurement: Part 3-A 5 pH point titration method to determine the carbonate and SCFA weak acid/bases in aqueous solution containing also known concentrations of other weak acid/bases. Water SA. 1993;19(1):29-40.
- Edelmann W, Baier U, Engeli H. Environmental aspects of the anaerobic digestion of the OFMSW and agricultural wastes. Water Sci Technol. 2005;52(1-2):553-559.
- Carrere H, Dumas C, Battimelli A, Batsone DJ, Delgenes JP, Steyer JP, et al. Pretreatment methods to improve sludge anaerobic degradability: A review. J Hazard Mater. 2010;183(1-3):1-15.
- Dababat S. Enhancing biogas production by using slaughterhouse wastewater and domestic sludge to cover energy demand for wastewater treatment plant in Nablus governorate. MSc. Thesis. Faculty of Graduate Studies. An-Najah National University, Nablus, Palestine 2017.
- Alvarez R, Lidén G. Semi-continuous co-digestion of solid slaughterhouse waste, manure, and fruit and vegetable waste. Renew Energ. 2008;33(4):726-734.
- Dababat S, Shaheen H. Biogas production using slaughterhouse wastewater co-digested with domestic sludge. J Civ Eng Constr. 2019;8(1):34-40.
- APHA-AWWA-WEF. Standard Methods for the Examination of Water and Wastewater, 20th edn. American Public Health Association, American Water Works Association and Water Environment Federation, New York, NY. 1998.
- Abbassi-Guendouz A, Brockmann D, Trably E, Dumas C, Delgenès JP, Steyer JP, et al. Total solids content drives high solid anaerobic digestion via mass transfer limitation. Bioresour Technol. 2012;111:55-61.
- GUO M. Life cycle assessment (LCA) of light-weight ecocomposites. SL: Springer. 2016.
- Raposo F, Fernández-Cegrí V, De la Rubia M, Borja R, Béline F, Cavinato C, et al. Biochemical methane potential (BMP) of solid organic substrates: evaluation of anaerobic biodegradability using data from an international inter laboratory study. J Chem Technol Biotechnol. 2011;86(8):1088-1098.
- Borowski S, Kubacki P. Co-digestion of pig slaughterhouse waste with sewage sludge. Waste Manag. 2015;40:119-126.
- Lettinga G, De Man A, van der Last ARM, Wiegant W, van Knippenberg K, Fijns J, et al. Anaerobic treatment of domestic sewage and wastewater. Water Sci Technol. 1993;27(9):67-73.
Citation: Dababat SSB (2019) Organic Waste Reduction by Co-digestion of Slaughterhouse Wastewater and Domestic Sludge. J Microb Biochem Technol 11:3. doi: 10.4172/1948-5948.1000415
Copyright: © 2019 Dababat SSB. This is an open-access article distributed under the terms of the Creative Commons Attribution License, which permits unrestricted use, distribution, and reproduction in any medium, provided the original author and source are credited.
