Indexed In
- Academic Journals Database
- Open J Gate
- Genamics JournalSeek
- Academic Keys
- JournalTOCs
- China National Knowledge Infrastructure (CNKI)
- CiteFactor
- Scimago
- Ulrich's Periodicals Directory
- Electronic Journals Library
- RefSeek
- Hamdard University
- EBSCO A-Z
- OCLC- WorldCat
- SWB online catalog
- Virtual Library of Biology (vifabio)
- Publons
- MIAR
- University Grants Commission
- Geneva Foundation for Medical Education and Research
- Euro Pub
- Google Scholar
Useful Links
Share This Page
Journal Flyer
Open Access Journals
- Agri and Aquaculture
- Biochemistry
- Bioinformatics & Systems Biology
- Business & Management
- Chemistry
- Clinical Sciences
- Engineering
- Food & Nutrition
- General Science
- Genetics & Molecular Biology
- Immunology & Microbiology
- Medical Sciences
- Neuroscience & Psychology
- Nursing & Health Care
- Pharmaceutical Sciences
Research Article - (2024) Volume 16, Issue 6
Novel LC-MS/MS Method for Quantification of Semaglutide in Human Plasma and its Application in Pharmacokinetic Studies
Arjun Arumugam, Geetha Lakshmi, Nageswara Rao Thalapaneni* and Srinivas GopineeduReceived: 16-Nov-2024, Manuscript No. JBB-24-27526; Editor assigned: 18-Nov-2024, Pre QC No. JBB-24-27526 (PQ); Reviewed: 02-Dec-2024, QC No. JBB-24-27526; Revised: 09-Dec-2024, Manuscript No. JBB-24-27526 (R); Published: 16-Dec-2024, DOI: 10.35248/0975-0851.24.16.607
Abstract
The objective of the study was to develop a bioanalytical method for the determination of semaglutide in human K3 EDTA plasma. Separation was achieved by reverse phase chromatography, and quantification was done using the LC-MS/MS method. The chromatographic separation was achieved with an phenomenex aeris wide pore XB-C8 (100 × 4.6 mm) 3.6 μm column thermostated at 40°C with a mobile phase containing gradient program with Pump A: (Acetonitrile: Methanol (50:50) v/v) and Pump B: (0.2% Formic acid in Milli Q Water (v/v)). The flow rate was maintained at 0.800 ml/min, and the injection volume was found to be 5 μl. The detection was done by using high-performance liquid chromatography coupled with tandem mass spectrometry. The retention time was found to be 5.40 ± 0.80 min for the analyte and 5.40 ± 0.80 min for the internal standard. The calibration curves showed good linearity (r2>0.99) over concentration range of 2-120 ng/mL. The precision (2.42% to 7.78%) and accuracy (95.67% to 104.93%) fell within the range, all meeting acceptance criteria. The recovery of analyte 67.51% was well within the acceptance limits. The established analytical method was found to be selective, sensitive, precise, accurate, reproducible and validated according to the International Conference on Harmonization guidelines.
Keywords
Semaglutide; Semaglutide D5; Exenatide; Liraglutide; LC-MS/MS; K3EDTA; SCIEX 6500+
Introduction
Validation is the process of establishing documentary evidence demonstrating that a procedure, process, or activity carried out is reliable, performs as intended, and ensures that results are consistent and reliable. The validation of the method was based on ICH M10 guidelines and standard bioanalytical method validation recommendations. The goal of equipment validation is to produce a constant result with minimal variation without compromising the product and performance of the equipment. The system suitability parameters ensure that the LC-MS/MS system and procedures are adequate for the analysis performed and validated according to ICH guidelines [1,2].
Semaglutide is a glucagon-like peptide 1 receptor agonist used to improve glycemic control in type 2 diabetes mellitus. Semaglutide is a Glucagon-Like Peptide 1 (GLP-1) analog used to manage type 2 diabetes along with lifestyle changes, such as dietary restrictions and increased physical activity. Other members of this drug class include exenatide and Liraglutide [3]. Semaglutide works by binding to and activating the GLP-1 receptor, thereby stimulating insulin secretion and reducing blood glucose. Semaglutide is indicated to improve glycemic control in adults diagnosed with type 2 diabetes mellitus and is used as an adjunct to diet and exercise [4-6]. However, semaglutide is not a suitable first-line drug for diabetes that has not been controlled by diet and exercise. In addition, it has not been studied in patients with pancreatitis. Semaglutide is not intended for use in patients with type 1 diabetes or to treat diabetic [7] ketoacidosis. The main aim and objective of the work was to develop and validate the LC-MS/MS method for the quantification of semaglutide in human K3EDTA plasma and its application in pharmacokinetic studies. The developed method was validated concerning linearity, precision, accuracy, specificity, selectivity, carry-over, matrix effect, recovery, robustness, reinjection reproducibility, and stability.
Materials and Methods
Chemicals and reagents
Standard reference chemicals of semaglutide (analyte) and Semaglutide D5 (IS) were supplied by Chemtopes (Hyderabad). The structures of semaglutide and Semaglutide D5 were shown in Figure 1. Methanol and Acetonitrile were obtained from thermo fisher scientific, Formic acid, 2-Propanol and ammonia were purchased from sigma, (St. Louis, MO USA), Drug-free human plasma (K3EDTA) was obtained from healthy human volunteers. High-purity water was attained by using the Millipore Milli Q water purification system.
Figure 1: Chemical structure of semaglutide and semaglutide D5.
Equipment and LC-MS/MS conditions
Chromatography: The chromatography analysis was performed using a sciex triple quad 6500+ LC-MS/MS equipped with a degasser model DGU-405, controller SCL-40 and CBM-40 LITE, pump LC-40D X3 and LC-40D XS, autosampler SIL-40C X3 and SIL-40C XS, and column oven CTO-40C and CTO-40S for the determination of semaglutide in human plasma samples. The method was developed and validated at a flow rate of 0.800 mL/ min on phenomenex aeris wide pore XB-C8 (100 × 4.6mm) 3.6 μm column. A 12-minute gradient* was run using Acetonitrile: Methanol (50:50 v/v) as solution A and 0.2% formic acid in Milli Q water (v/v) as solution B. The gradient elution and flow rate are shown in Table 1. The column temperature was maintained at 40°C. An injection volume of 5 μL was used for analysis. The autosampler temperature was maintained at 12°C.
| S. No | Time (minutes) | Flow (mL/min) | Pump (A%) | Pump (B%) |
|---|---|---|---|---|
| 1 | 0 | 0.800 mL | 50 | 50 |
| 2 | 2 | 0.800 mL | 50 | 50 |
| 3 | 4 | 0.800 mL | 60 | 40 |
| 4 | 6 | 0.800 mL | 60 | 40 |
| 5 | 6.5 | 0.800 mL | 90 | 10 |
| 6 | 7.2 | 0.800 mL | 90 | 10 |
| 7 | 7.5 | 0.800 mL | 50 | 50 |
| 8 | 12 | 0.800 mL | 50 | 50 |
Table 1: Gradient program for semaglutide analysis.
MS conditions: MS analysis was performed on AB sciex triple quad 6500+ LC-MS/MS equipped with a turbo spray (ESI) source operating in a positive polarity. Multiple Reaction Monitoring (MRM) mode was used. The settings for the Sciex Triple Quad 6500+ LC-MS/MS were shown in Table 2.
| S. No | Parameters | Semaglutide (m/z) | Semaglutide D5 (m/z) |
|---|---|---|---|
| 1 | Q1 Mass (Da) | 1029.4 (High Mass 4th Charge ion) | 1030.7 (High Mass 4th Charge ion) |
| 2 | Q3 Mass (Da) | 1302.9 | 1302.6 |
| 3 | Declustering Potential (DP) | 80 | 80 |
| 4 | Entrance Potential (EP) | 10 | 10 |
| 5 | Collision Energy (CE) | 44 | 44 |
| 6 | Collision Cell Exit Potential (CXP) | 20 | 20 |
| 7 | MR Pause (msec) | 100 | |
| 8 | Dwell (msec) | 200 | |
Table 2: Mass Spectrometry (MS) parameters of semaglutide optimized by LC-MS/MS.
Preparation of calibration curve standards and Quality Control (QC) samples
Two independent stock solutions of semaglutide were used to prepare calibrators and quality control samples, respectively. Calibration standards were prepared for semaglutide in K3ETDA human plasma at concentration levels ranging from 2.000 to 120.000 ng/mL. Quality control samples LLOQC (2.001 ng/mL), LQC (5.817 ng/mL), MMQC (18.800 ng/mL), MQC (47.000 ng/ mL) and HQC (94.000 ng/mL) were prepared.
Sample extraction
Protein Precipitation Method (PPT) followed by Solid Phase Extraction method (SPE) was applied to extract the analyte in plasma samples. The matrix lots were withdrawn from the intended storage and thawed at room temperature. To 0.200 mL aliquot of plasma sample, 0.050 mL of IS with 1 mL of methanol was added. These samples were placed in the platform shaker at 2000 rpm for 10 min centrifuged at 4000 rpm for 10 min at 4ºC. Finally, 0.700 mL of the supernatant layer was collected, transferred into vials with 0.700 mL of buffer and vortex-mixed. Further, cartridge was conditioned with 0.300 mL of methanol and equilibrated with 1.000 mL of Milli Q Water, then loaded into Strata-X-33 μm polymeric strong anion cartridges (30 mg/1 mL). The cartridges were washed twice with 1.000 mL of washing solution and Eluted with 0.500 mL of Elution solution and vortex-mixed. The samples were finally injected into the LC-MS/MS.
Method validation and results
ICH guidelines [1] were followed to validate the method for linearity, precision, accuracy, robustness, and ruggedness. The percentage coefficient of variation was used to measure precision over the concentration range. The mean values of the calibration standards are compared to their nominal values to calculate the accuracy, which is then expressed as a percentage.
Carry over test: The percentage carryover was calculated as the percentage peak area observed in extracted blank samples of initially injected and blank samples that were re-injected immediately after the processed ULOQ sample. No carryover was observed at the analyte and internal standard.
Selectivity: Selectivity of the method was established by comparing extracted blanks of 10 different lots, including one Hemolyzed and one lipemic lot, against extracted LLOQ. Response of interfering peak at internal standard was established by comparing the average response of IS in extracted LLOQ samples. Response of the interfering peak at the RT of Analyte was <20% of the average of extracted LLOQ, and Response of the interfering peak at the RT of IS was <5% of the average of extracted LLOQ.
Matrix effect: The matrix effect was determined by using eight calibration curve standards along with three replicates of QCs (LQC and HQC) samples using eight individual normal blank matrices including one hemolysed and one lipemic lot from independent sources. The calibration curve was prepared by using one normal screened blank matrix. Precision was measured by the percentage co-efficient of variation over the concentration range. The accuracy was calculated by the mean values of the quality control samples to their respective nominal values and expressed as percentage.
% Accuracy ± 15% and %CV <15% at each level was well within the acceptable limits.
Calibration curve
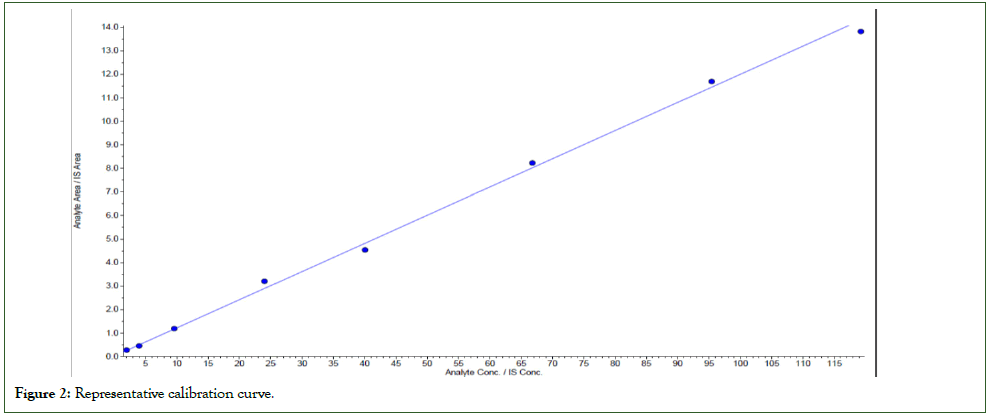
Calibration curve was established by preparing an eight-point calibration curve standard (Figure 2). Precision was measured by the percentage co-efficient of variation over the concentration range. The accuracy is calculated by the mean values of the calibration standards to their respective nominal values and expressed as percentage. The results were shown in Table 3.
Figure 2: Representative calibration curve.
| Linearity (2.002 to 119.288 ng/mL) | |
|---|---|
| Accuracy | STD 1: 98.65% STD 2-8: 95.67% to 104.93% |
| Precision | STD 1: 3.61% STD 2-8: 2.42% to 7.78% |
Table 3: Back calculated calibration curve concentrations.
Accuracy and precision
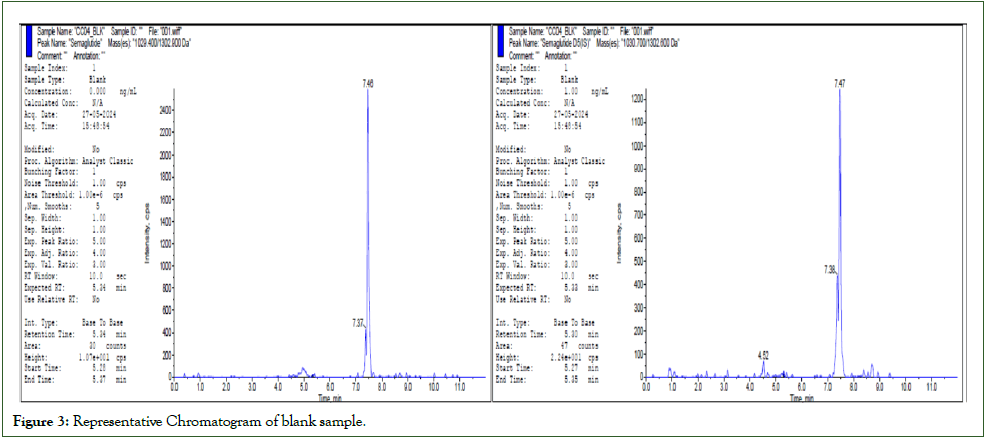
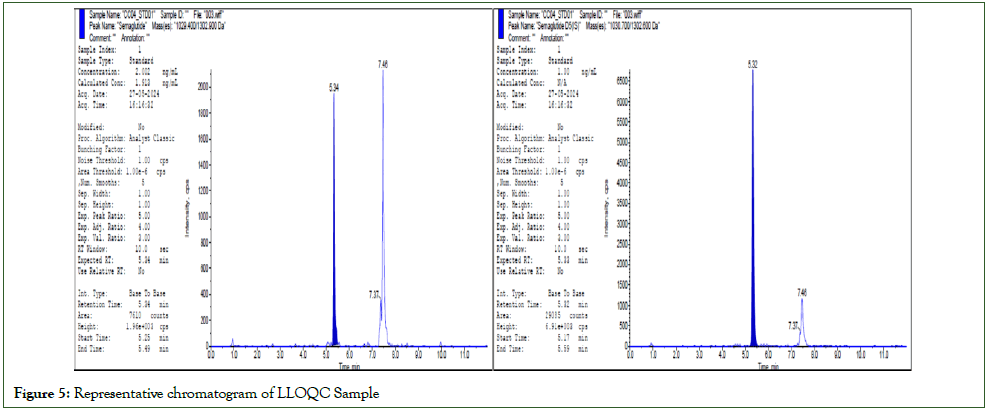
Accuracy and precision batches were determined in four different runs using a minimum of 5 replicates each of LLOQC, LQC, MMQC, MQC, HQC, and DQC samples. Dilution integrity was determined by using five replicates of quality control samples, which were spiked approximately 4 times the concentration of HQC and diluted 4 times with a screened matrix before extraction. Extended accuracy and precision were determined by using 15 replicates of LLOQC, LQC, MMQC, MQC, and HQC samples. The total batch size of 86 samples was performed to mimic the subject sample analysis. Precision was measured by the percentage coefficient of variation over the concentration range. The accuracy is calculated by comparing the mean values of the quality control samples to their respective nominal values and expressed as a percentage. The results of accuracy and precision were shown in Table 4. The chromatograms of Blank, Zero and LLOQ was shown in Figure 3-5 respectively.
Figure 3: Representative Chromatogram of blank sample.
Figure 4: Representative chromatogram of zero Sample.
Figure 5: Representative chromatogram of LLOQC Sample
| Accuracy and precision | Results obtained (in%) | |||||
|---|---|---|---|---|---|---|
| Intra batch accuracy (%Accuracy) | LLOQC | 88.72 | to | 100.92 | Inter batch accuracy (%Accuracy) | 93.72 |
| LQC | 96.38 | 103.29 | 98.69 | |||
| MMQC | 99.85 | 105.85 | 101.56 | |||
| MQC | 97.55 | 106.46 | 101.18 | |||
| HQC | 95.2 | 105.02 | 100.16 | |||
| DQC_4T | 96.22 | 106.27 | 102.38 | |||
| Intra batch precision (%CV) | LLOQC | 2.37 | to | 10.77 | Inter batch precision (%CV) | 9.76 |
| LQC | 3.7 | 6.88 | 6.59 | |||
| MMQC | 6.08 | 7.36 | 6.64 | |||
| MQC | 2.51 | 5.71 | 4.41 | |||
| HQC | 2 | 5.54 | 5.59 | |||
| DQC_4T | 3.09 | 6.65 | 6.14 | |||
Table 4: Intra and inter batch accuracy and precision.
Reinjection reproducibility: Re-injection reproducibility is evaluated by re-injecting the accepted quality control samples of A_P_02_DI_02 batch samples that were retained in the autosampler for a minimum duration of time. These quality control samples were re-injected and quantified against the initially acquired calibrators. % Accuracy for LLOQC was ± 20% and for LQC, MMQC, MQC, and HQC was ± 15%. The %CV was Ë?20% for LLOQC and Ë? 15% for other QCs. The coefficient of determination (r2) was be greater than 0.9800.
Recovery of analyte and internal standard: Recovery was determined by comparing the detector response of extracted analytes at low, medium and high-quality control samples with the detector response obtained from post-extracted samples of the same levels. The recovery of IS was determined by the average detector response of IS in extracted low, medium, and high-quality control samples with average detector response obtained from postextracted samples of the same levels. The % recovery and %CV of the analyte are 67.51%, and 2.77%. The % recovery of internal standard is 69.32%, and the %CV was 6.00% and 4.92%.
Blood Sample Processing Integrity (BSPI): Blood sample processing integrity was evaluated by spiking the analyte in human K3EDTA whole blood and placed in 2°C-8°C for the intended duration. Subsequently, freshly spiked analyte in human whole blood was prepared after completion of the intended duration. Both the stable and freshly prepared samples were centrifuged at 3500 rpm at 4°C for 10 min to obtain plasma which was separated into five aliquots each of stability and freshly prepared. Thus, blood sample processing integrity was evaluated by comparing stability samples against the freshly prepared samples. The %CV for fresh and stable samples was 1.92% and 2.05%. The % stability was 97.94%
Stabilities: Stability evaluations were performed using stability quality control samples which were stored or exposed to mimic all the expected study sample conditions. The stability of the analyte was evaluated using low and high-quality control samples after all the applied storage conditions against freshly prepared calibration standards. The obtained concentration of the stability quality control samples was compared with respective nominal concentrations. The results were shown in Table 5.
| Experimental parameters | Results obtained (in%)/Demonstrated for |
|---|---|
| Freeze-thaw stability | 6 cycles at -70°C |
| Bench top stability | 06 h 33 min at room temperature |
| Auto sampler stability | 85 h 53 mins at 12°C |
| Wet extract stability at room temperature | 07hrs 53 min at room temperature |
| Wet extract stability at 2°C-8°C | 74 h 27 min at 2°C-8°C |
| Long-term stock solution stability | 10 days 15 h for analyte and 10 days 17 h for internal standard at 2-8°C |
| Long-term working solution stability | 10 days 15 h for analyte and 10 days 17 h for internal at 2°C-8°C. |
| Short-term stock solution stability | 07 h 05 min for analyte and 06 h 53 min for internal standard at room temperature |
| Short-term working solution stability | 06 h 15 min for analyte and 06 h 10 min for internal at room temperature |
| Long term stability | 99 days 18 h at -20ºC and 99 days 17 h at -70°C |
Table 5: Matrix stability results.
Freeze-thaw stability: Three aliquots of quality control samples of each sample at low and high levels (LQC and HQC) were stored at -70ºC for 12 h for the first cycle and thereafter re-frozen for at least 12 h for the subsequent cycles. At each cycle samples were thawed unassisted at room temperature.
Bench top stability: Three aliquots of quality control samples of each concentration at low and high levels (LQC and HQC) were placed at room temperature (≤ 25°C), to mimic the sample processing time.
Auto sampler stability: Three aliquots of quality control samples of each concentration at low and high levels (LQC and HQC) were processed and retained in the autosampler at an intended temperature of 12°C.
Wet extract stability at room temperature: Three aliquots of quality control samples of each concentration at low and high levels (LQC and HQC) were processed at room temperature (≤ 25°C). After processing the samples were placed on the bench for an intended duration before analysis.
Wet extract stability at 2°C-8°C: Three aliquots of quality control samples of each concentration at low and high levels (LQC and HQC) were processed at room temperature. After processing the samples were stored in the refrigerator (2°C-8°C) for the intended duration prior to analysis.
Long-term stock and working solution stability: Stock/working solution stability of the analyte and IS was evaluated by storing the stock/working solutions of the analyte and internal standard for an intended duration in the refrigerator (at 2°C-8°C) and subsequently comparing these solutions against freshly prepared stock/working solutions of analyte and internal standard.
Short-term stock and working solution stability: Stock/working solution of the analyte and IS were prepared and stored for the intended duration at room temperature (≤ 25°C). These solutions were compared against freshly prepared Stock/working solutions. Long term stability: Quality control samples of low and high level concentration were stored at -20°C and -70ºC for an intended period. Subsequently these stability quality control samples were analysed against freshly prepared calibration standards; the obtained concentration of stability quality control samples were compared to the respective nominal concentrations.
Incurred samples reanalysis: In order to assess the reproducibility of the method, we conducted reanalysis of study samples. A reanalysis of 172 samples was performed after the first measurement. These samples were stored at -70°C during the interval between the two analyses. The percentage difference in the results between the original study and the replicated study was calculated and plotted according to the following equation. The percentage difference should be within ± 20% for at least 67% of the repeats.
% difference = (ISR value - initial value)/mean of ISR value and initial value x 100%
For ISR, 172 samples were selected and analysed of which, 98.84% of the samples, were within the acceptance criteria of ± 20% of initial values, thus, demonstrating reproducibility and repeatability of the method used.
Clinical application
The concentrations of Semaglutide in human K3EDTA plasma samples were quantified using a validated method. A total of 80 subjects were enrolled in the study and 74 subjects completed the study. The drug concentration levels of Semaglutide was determined by a validated LC-MS/MS method in the plasma samples of 78 subjects.
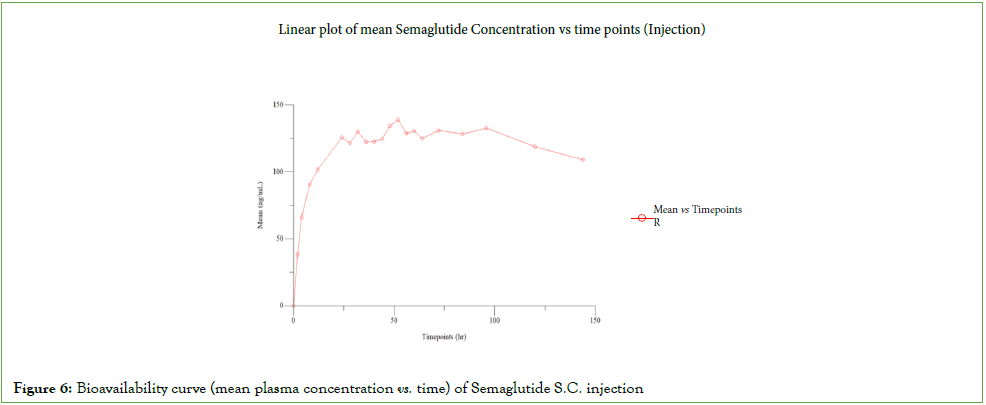
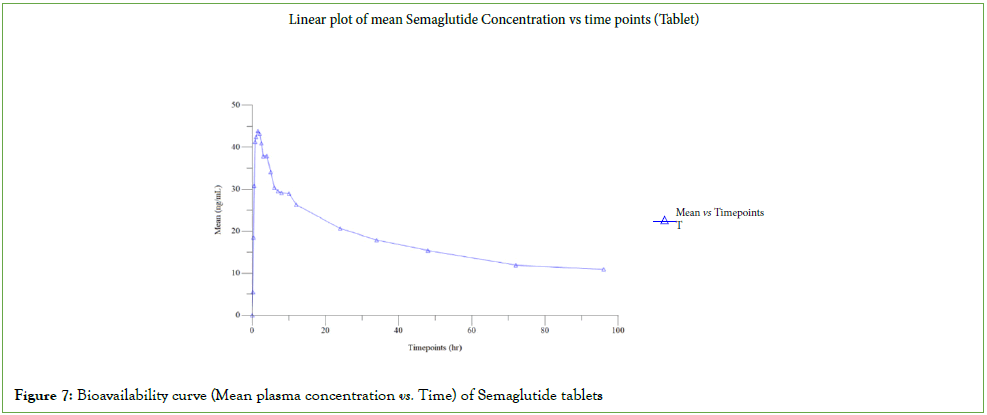
Plasma collected from 74 subjects were fully analysed and the partially collected samples of 04 subjects who did not complete the study owing to withdrawal were also subsequently analysed, concentrations obtained were reported. There was no individual sample reanalysis in this study. There was 01 run failure during clinical sample analysis, which was re-assayed and met the acceptance criteria. The pharmacokinetic results of Semaglutide injection and tablet were depicted in (Figures 6 and 7) [4,5]. The Statistical results of Rybelsus (Semaglutide) and Ozempic (Semaglutide) were shown below in Tables 6 and 7.
Figure 6: Bioavailability curve (mean plasma concentration vs. time) of Semaglutide S.C. injection
Figure 7: Bioavailability curve (Mean plasma concentration vs. Time) of Semaglutide tablets
| Pharmacokinetic parameters | Test geometric mean | Reference geometric mean | Test/Reference ratio | 90% confidence interval for test vs reference | Power of ANOVA | Inter subject cv |
|---|---|---|---|---|---|---|
| LN_Cmax | 41.5014 | 141.7167 | 29.28 | 14.78 %-58.01% | 0.1122 | 40.83 |
| LN_AUCT | 1531.6591 | 17174.648 | 8.92 | 4.51%-17.65% | 0.1123 | 40.77 |
Table 6: Statistical results of rybelsus (semaglutide) vs ozempic (semaglutide).
| Parameter | Ozempic (Semaglutide) (Mean ± SD) | Rybelsus (Semaglutide) (Mean ± SD) |
|---|---|---|
| Cmax (ng/mL) | 141.942 ± 9.835 | 46.236 ± 27.619 |
| AUC0-t (ng.hr/mL) | 17208.388 ± 1306.624 | 1698.962 ± 969.003 |
| AUC0-∞ (ng.hr/mL) | 63591.111 ± 27007.229 | 2593.373 ± 1421.879 |
| Tmax (hr) | 60.00 (48.00-96.00) | 0.75 (0.50-2.00) |
| Kel (hr-1) | 0.002 ± 0.001 | 0.012 ± 0.001 |
| T1/2 (hr) | 298.577 ± 110.130 | 57.588 ± 4.510 |
| AUC_%Extrap (%) | 71.673 ± 10.053 | 34.733 ± 3.031 |
Table 7: Summary of pharmacokinetic parameters for semaglutide.
Discussion
In this study, we developed semaglutide method to determine the concentrations in human K3EDTA plasma. To the best of our knowledge, our method provided the lowest LOQ for semaglutide with accuracy and precision (2 ng/ml). The validated methods were considered to be reliable because of good linearity, performance of intra-day and inter-day precisions, and accuracies in plasma samples. This analytical method was successfully applied to analyze plasma samples of semaglutide. Chromatography separation and mass spectrometry detection are two major parts to be optimized for the LC-MS/MS analytical method. Initially, reverse phase liquid chromatography separation was tried to develop a method by using different combinations.
Method development was carried out by using a zorbax SB C18 (150 × 4.6 mm), 5 µm column thermostated at 30°C with gradient program, mobile phase with Pump A: formic acid (acetonitrile: methanol) 0.1% (80:20) (v/v/v) and Buffer I: (formic acid in water (1%) (v/v)). The flow rate was maintained at 0.800 ml/min, and the injection volume was found to be 10 μl. The rinsing solution and seal washing solution used were (acetonitrile: water (20:80) (v/v)) and (2-Propanol: water (10:90) (v/v)). The detection was done by using high-performance liquid chromatography coupled with tandem mass spectrometry. The retention time was found to be 3.80 ± 0.5 min for the analyte and 3.80 ± 0.5 min for the internal standard. By using this trial, we observed huge carry-over and poor chromatography. Further optimization was carried out by using an aeris wide pore XB-C8 (100 × 4.6mm), 3.6 μm column thermostated at 40°C with a mobile phase containing gradient program with Pump A: (acetonitrile: methanol (50:50) % v/v) and Pump B: (0.2% formic acid in milli Q water (v/v)). The flow rate was maintained at 0.800 ml/min, and the injection volume was found to be 5 μl. The rinsing solution was changed to (acetonitrile: methanol: 2-Propanol: milli Q water (25:25:25:25) % v/v/v/v) and included strong wash solution: (formic acid (acetonitrile: milli Q water) 0.1% (40:60) (v/v/v)). The detection was done by using highperformance liquid chromatography coupled with tandem mass spectrometry. The retention time was found to be 4.80 ± 1.00 min for the analyte and 4.80 ± 1.00 min for the internal standard. By using this trial, we observed adequate peak shape for both analyte and IS and reduced carry-over.
Insufficient LLOQ response was observed in clinical sample analysis. Further method optimization was carried out. In aeris wide pore XB-C8 (100 × 4.6 mm) 3.6 μm column with a change in the gradient program. The extraction optimization was found to be good with a linearity range between 2 and 120 ng/mL. No carryover was observed in this method and it was found to be selective, sensitive, precise, accurate, and reproducible.
In this study, the above described a sensitive and selective highperformance liquid chromatography coupled with tandem mass spectrometry method was used for the analysis of Semaglutide in human plasma obtained from healthy subjects following single dose administration. The method is used to quantify the concentration of semaglutide in order to support the pharmacokinetic end point study of Semaglutide [8]. The pharmacokinetic and statistical results were provided in Table 6.
Conclusion
Our method demonstrates a low-ng/mL level quantitation assay of semaglutide in human K3EDTA plasma using the SCIEX 6500+ LCMS/ MS system. The method was optimized to achieve a sensitive quantitation assay from sample extraction to chromatography and MS detection was prepared as described in the sample preparation section. Analytical performance was evaluated for accuracy and precision. The accuracy of the calculated mean was expected to be between 80% and 120% at the LLOQ and between 85% and 115% at higher concentrations. The %CV of the calculated mean for each concentration was expected to be <20% at the LLOQ and <15% at higher concentrations. Accuracy was within ± 15% of the nominal concentration and the %CV was <15% for semaglutide.
The proposed method was found to be selective, sensitive, precise, accurate, reproducible, and validated according to the International Conference on Harmonization guidelines concerning linearity, precision, accuracy, robustness, and specificity studies which remained well within the limit.
Highlights
• The first LC-MS/MS method for analyzing semaglutide in human plasma with no carry over effect.
• The method was proved to be efficient and robust.
• The proposed method was found to be selective, sensitive, precise, accurate and reproducible.
Conflict of Interest
The authors declare that there is no conflict of interest regarding the publication of this paper.
Funding Statement
The authors are thankful to the management of Azidus Laboratories Limited, Tamil Nadu, Chennai, India, for providing the necessary facilities to carry out the research work.
Ethical Statement
The studies involving human participants were approved by the Ethical Committee of Azidus Laboratories Limited, Tamil Nadu, Chennai, India. All procedures were conducted according to the Declaration of Helsinki.
References
- Guideline IH. Bioanalytical method validation and study sample analysis M10. 2022.
- Baekdal TA, Thomsen M, Kupcova V, Hansen CW, Anderson TW. Pharmacokinetics, safety and tolerability of oral semaglutide in subjects with hepatic impairment. J Clin Pharmacol. 2018;58(10):1314-1323.
[Crossref] [Google Scholar] [PubMed]
- Lee TS, Park EJ, Choi M, Oh HS, An Y, Kim T, et al. Novel LC-MS/MS analysis of the GLP-1 analog semaglutide with its application to pharmacokinetics and brain distribution studies in rats. J Chromatogr B Analyt Technol Biomed Life Sci. 2023;1221:123688.
[Crossref] [Google Scholar] [PubMed]
- Chao AM, Tronieri JS, Amaro A, Wadden TA. Clinical insight on semaglutide for chronic weight management in adults: Patient selection and special considerations. Drug Des Devel Ther. 2022:4449-4461.
[Crossref] [Google Scholar] [PubMed]
- Arbouche N, Blanchot A, Raul JS, Kintz P. Semaglutide and health risk: Development and validation of a LC-HRMS method for testing semaglutide in whole blood and application to real cases. J Chromatogr B Analyt Technol Biomed Life Sci. 2024;1242:124187.
[Crossref] [Google Scholar] [PubMed]
- Snitker S, Andersen A, Berg B, Van Marle S, Sparre T. Comparison of the injection‐site experience of the starting doses with semaglutide and dulaglutide: A randomized, double‐blind trial in healthy subjects. Diabetes Obes Metab. 2021;23(6):1415-1419.
[Crossref] [Google Scholar] [PubMed]
- Wilding JP, Batterham RL, Calanna S, Davies M, Van Gaal LF, Lingvay I, et al. Once-weekly semaglutide in adults with overweight or obesity. N Engl J Med. 2021;384(11):989-1002.
[Crossref] [Google Scholar] [PubMed]
- Jensen L, Kupcova V, Arold G, Pettersson J, Hjerpsted JB. Pharmacokinetics and tolerability of semaglutide in people with hepatic impairment. Diabetes Obes Metab. 2018;20(4):998-1005.
[Crossref] [Google Scholar] [PubMed]
Citation: Arumugam A, Lakshmi G, Thalapaneni N, Gopineedu S (2024). Novel LC-MS/MS Method for Quantification of Semaglutide in Human Plasma and its Application in Pharmacokinetic Studies. J Bioequiv Availab. 16:607.
Copyright: © 2024 Arumugam A, et al. This is an open-access article distributed under the terms of the Creative Commons Attribution License, which permits unrestricted use, distribution, and reproduction in any medium, provided the original author and source are credited.
