Indexed In
- Open J Gate
- Academic Keys
- RefSeek
- Hamdard University
- EBSCO A-Z
- OCLC- WorldCat
- Publons
- Euro Pub
- Google Scholar
- SHERPA ROMEO
Useful Links
Share This Page
Journal Flyer

Open Access Journals
- Agri and Aquaculture
- Biochemistry
- Bioinformatics & Systems Biology
- Business & Management
- Chemistry
- Clinical Sciences
- Engineering
- Food & Nutrition
- General Science
- Genetics & Molecular Biology
- Immunology & Microbiology
- Medical Sciences
- Neuroscience & Psychology
- Nursing & Health Care
- Pharmaceutical Sciences
Research Article - (2023) Volume 11, Issue 4
Noninvasive Photoacoustic Imaging: A New Diagnostic Tool for Early Detection of Diabetes? A Controlled Comparative Trial of 169 Patients
Jan-Malte Placke1, Annika Marleen Hellmich1, Dagmar Fuhrer2, Susanne Tan2, Dai Murakoshi3, Jithin Jose4, Sandra Hallasch1, Maximilian Petri1, Ingo Stoffels1 and Joachim Klode1*2Department of Endocrinology, Diabetes and Metabolism, University Hospital Essen & University of Duisburg-Essen, Essen, Germany
3Medical Systems Research & Development Center Research & Development Management Headquarters FUJIFIL, Kanagawa, Japan
4Medical Systems Research & Development Center Research & Development Management Headquarters FUJIFIL, Amsterdam, The Netherlands
Received: 14-Jul-2023, Manuscript No. JVMS-23-22177; Editor assigned: 17-Jul-2023, Pre QC No. JVMS-23-22177 (PQ); Reviewed: 31-Jul-2023, QC No. JVMS-23-22177; Revised: 07-Aug-2023, Manuscript No. JVMS-23-22177 (R); Published: 14-Aug-2023, DOI: 10.35248/2329-6925.23.11.532
Abstract
Introduction: Microangiopathy in People With Diabetes (PwD) represents the major cause of complications. Detection of microangiopathy at an early stage preventing further damage is challenging. The present study investigated whether dermal differences detected by Photoacoustic Imaging (PAI) may identify diabetes-induced microangiopathy. Patients and methods: In a monocentric study at Department of Dermatology of the Essen University Hospital PAI was performed with and without occlusion of subcutaneous palmar and plantar vessels in PwD and healthy controls. Results: In PwD, measurement of palmar PAI showed higher signal at baseline and after occlusion (both P<0.001). Positive correlation between diabetes duration and palmar PAT measurement was observed at baseline (rho=0.245; P=0.023) and after occlusion (rho=0.269; P=0.012). Abnormal PAI pattern in healthy patients was associated with higher risk of deterioration of glycemic metabolism in the future (OR=6.176; 95%CI=1.731-19.01; P=0.004; sensitivity=73.3%; specifity=67.3%; P=0.008). Conclusion: PAI may serve as a new non-invasive method to detect hyperglycemia-induced microangiopathy. Further studies are needed to confirm these preliminary findings.
Keywords
Diabetes; Photoacustic tomography; Microangiopathy; Prediction
Introduction
Worldwide, Diabetes Mellitus (DM) is showing an increasing prevalence as life expectancy and obesity increases. Overall, worldwide one in ten people suffer from DM [1-6]. Microangiopathy occurs in one of two People with Diabetes (PWD) leading to diabetic neuropathy, nephropathy, and retinopathy representing the most common cause for lower extremity amputation, end stage renal disease and blindness in developed countries [7,8]. Considering the impact of microangiopathy on life expectancy and quality of life for PwD, detection of vascular dysfunction at an early stage is important to allow to early medical intervention [9]. Microangiopathy is induced by chronic hyperglycemia leading to the Accumulation of Glycated End products (AGEs). AGEs bind to endothelial receptors and release proinflammatory cytokines such as Vascular Cell Adhesion Molecule-1 (VCAM-1), Intercellular Adhesion Molecule-1 (ICAM-1), interleukin-6, and Tumor Necrosis Factor-α (TNF-α). They also form cross-links between collagen and elastin fibers, which lead to stiffening of the vessel wall [10-15]. Although early intervention of microangiopathy improves morbidity and mortality in diabetes patients, diaSnosis of microvascular injury at an early stage before overt organ damage occurs is still challenging [16]. Frequently, diabetic microangiopathy also manifests in the skin, which is one of the few areas where microvasculature can be observed noninvasively and tested functionally [17]. Modern imaging techniques such as photoacoustic imaging are used successfully for a variety of diseases in oncology, inflammatory diseases and angiological issues [18-25]. In a first small study, Yang et al. were able to show dynamic differences between PwD and Patients without Diabetes (PwN) using PAT in a total of 14 patients [26]. Therefore, the hypothesis, whether Photoacoustic Imaging (PAI) can be used to detect deterioration of microvascular architecture, was investigated in a larger cohort of patients in this monocentric prospective study.
Materials and Methods
Patients and methods
Patient cohort: PwD and healthy controls were included in the study. The following exclusion criteria were defined for the study: Age <18 years, insufficient ability to communicate in German or lack of understanding of the German language, (functional) illiteracy, missing consent, or inability of the patient to give consent, known motoric disease and/or Raynaud's syndrome. Written informed consent was obtained from all patients. Data were obtained during a routine outpatient appointment of the Department of Dermatology, Venereology and Allergology at the University Hospital Essen and documented in the Hospital Information System (HIS) of the University Hospital Essen. The study cohort underwent a personal interview obtaining information on patient’s history including diagnosis of diabetes, diabetes duration, known diabetes-specific micro and macrovascular complications (nephropathy, neuropathy, retinopathy, peripheral arterial occlusive disease, coronary heart disease, and cerebral arterial occlusive disease), hypertension and smoking history. Physical examination included height, weight, abdominal circumference and blood pressure. Biochemical analysis was performed for HbA1c, triglycerides, total cholesterol, HDL and LDL, urea and creatinine.
The study was approved by the ethics committee of Duisburg-Essen University and conducted in accordance with the Declaration of Helsinki (15-6273-BO). The study was registered with the German Register of Clinical Trials (DRKS00008563).
Measurement by photoacoustic imaging
In the photoacoustic effect, laser energy is introduced into a specific medium, causing a slight increase in temperature and thus a temporary expansion of the tissue. This creates a pressure sound wave that is received by the detectors of a highly sensitive ultrasound device [27]. In the study, the patients were measured with the FF-PAI system (Fujifilm, Tokyo, Japan), which consists of a high-resolution ultrasound, photo acoustics and a laser. The pulsed laser releases energy of 80 mJ and has a pulse width of 50 ± 10 nanoseconds at a wavelength of 755 nm (Figures 1A and 1B). By using a specially designed diffuser the light energy was diffused over the imaging area and thus affluence was kept below the Maximum Permissible Exposure (MPE). The examination for microangiopathy was performed in the small subcutaneous vessels palmar and plantar of the subjects. Since it is essential for the measurement that the transducer is held as still as possible, a measuring device for hands (Figure 1C) and feet (Figure 1D) was developed to reduce the patient's movement. Photoacoustic measurement was performed in 2D in the patients and the changes in photoacoustic signal intensity is monitored. For 2D measurement, Regions of Interest (ROIs) were defined as follows 10 × 2.5 mm and subcutaneous (Figure 1E). During the measurement, following a baseline, a 2-minute occlusion was performed with a blood pressure cuff above the measurement site. The blood pressure cuff was inflated at least 30 mmHg above the systolic blood pressure at the upper arm or lower leg. Values obtained by PAT measurement were expressed in Arbitrary Units (AU). A total of four measurements were taken on both hands and feet, and the mean of the measurements was calculated.
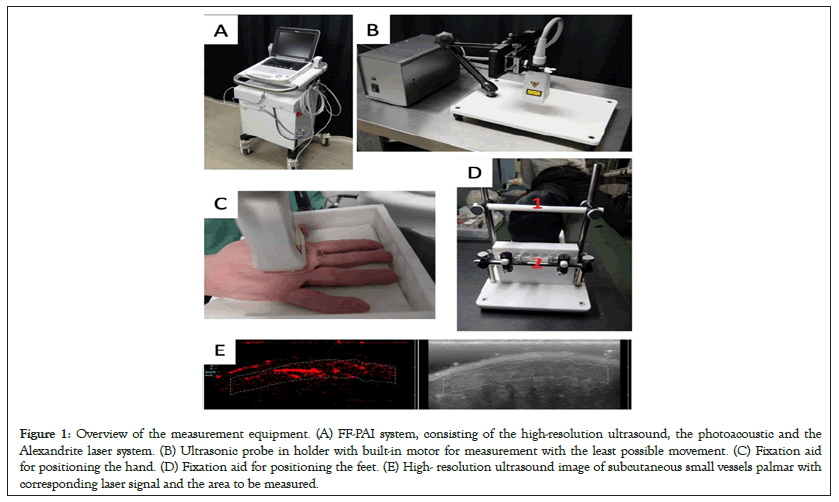
Figure 1: Overview of the measurement equipment. (A) FF-PAI system, consisting of the high-resolution ultrasound, the photoacoustic and the Alexandrite laser system. (B) Ultrasonic probe in holder with built-in motor for measurement with the least possible movement. (C) Fixation aid for positioning the hand. (D) Fixation aid for positioning the feet. (E) High- resolution ultrasound image of subcutaneous small vessels palmar with corresponding laser signal and the area to be measured.
During the occlusion, oxygenated hemoglobin is consumed increasing deoxygenated hemoglobin. By ending occlusion an increase of oxygenated hemoglobin is expected with decrease of the signal to its minimum peak.
Statistical analysis
Statistical analysis was performed with SPSS Statistics (Version 27, IBM Corp.; Armonk, NY) and Graph pad Prism (Version 9.5.0., Graph pad). For statistical testing, the unpaired t test, Fischer’s exact test and ROC analyses were performed. Correlations were tested using Spearman's rho. A P-value of <0.05 was considered statistically significant.
Results
Patient characteristics
In this monocentric prospective study, a total of 169 patients were enrolled in the Department of Dermatology, University Hospital Essen, from June 23, 2015, to June 17, 2016. Among these patients, in 88/169 diabetes diagnosis was known and 81/169 patients had no history of diabetes. Mean age (66.4 (19.7-92.1) vs. 59.87 (20.6-92.9) years, P=0.011) and BMI (30.0 (range 18.1-54.7) vs. 26.3 (16.7-43.0), P<0.001) was significantly higher in PwD than in those with normoglycemia. Distribution of gender and smoking status was balanced in both groups (P=0.219 resp. P=0.165). Characteristics of the study cohort is provided in Table 1.
| Total (n=169) | Diabetes (n=88) | No diabetes (n=81) | |
|---|---|---|---|
| Age in years (average, range) | 63.3 (19.7-92.9) | 66.4 (19.7-92.1) | 59.9 (20.6-92.9) |
| Gender | |||
| Male | 94 (55.6%) | 53 (60.2%) | 41 (50.6%) |
| Female | 75 (44.4%) | 35 (39.8%) | 40 (49.4%) |
| BMI (kg/m2) | 28.2 (16.7-54.7) | 30.03 (18.1 - 54.7) | 26.3 (16.7 - 43.0) |
| HbA1c (mg/dl)* | 6.7 (4.6 - 13.2) | 7.7 (5.6 - 13.2) | 5.5 (4.6 - 6.4) |
| Smoking history (No, %) | |||
| No | 91 (53.8%) | 52 (59.1%) | 39 (48.1%) |
| Yes | 76 (44.9%) | 35 (39.8%) | 41 (50.6%) |
| Unknown | 2 (1.2%) | 1 (1.1%) | 1 (1.2%) |
| Insulin treatment (No., %) | |||
| Yes | 56 (32.9%) | 55 (62.5%) | 0 (0.0%) |
| No | 113 (66.5%) | 32 (36.4%) | 81 (100.0%) |
| Unknown | 1 (0.6%) | 1 (1.1%) | 0 (0.0%) |
Note: (*) Mean blood glucose levels.
Tabel 1: Demographics of the study cohort.
Photoacoustic signals in palmar subcutaneous vessels are significantly higher in diabetic patients and show a positive correlation with disease duration.
PAI measurement were performed at baseline and after occlusion, in 88 diabetic patients and 81 patients without diabetes. While looking into the time of peak of PAI signals, patients with diabetes showed a mean of 41.5 (SD ± 15.7) Arbitrary Units (a.u.) and patients without diabetes showed a mean of 32.4 (SD ± 16.7) a.u. at baseline, so patients with diabetes showed significantly higher values than healthy patients at the present baseline PAI measurement (P<0.001), Figures 2A and 2B. In PAI measurement under occlusion, PwD showed significantly higher values than PwN with a mean value of 44.1 ± 17.2 a.u. resp. 33.4 ± 19.0 a.u. (P<0.001), Figure 2C. In PwD, duration of diabetes was positively correlated with palmar PAT baseline and after occlusion (rho=0.245; P=0.023 Figure 2B and rho=0.269; P=0.012, Figure 2D).
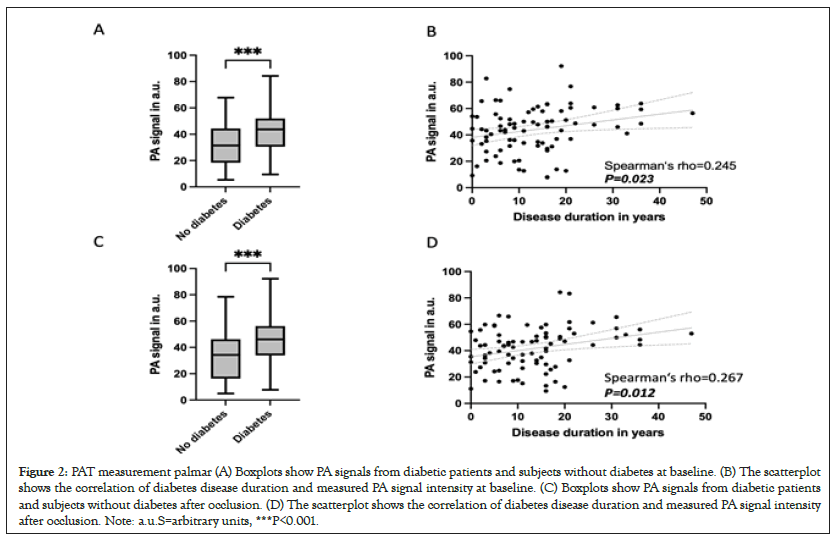
Figure 2: PAT measurement palmar (A) Boxplots show PA signals from diabetic patients and subjects without diabetes at baseline. (B) The scatterplot shows the correlation of diabetes disease duration and measured PA signal intensity at baseline. (C) Boxplots show PA signals from diabetic patients and subjects without diabetes after occlusion. (D) The scatterplot shows the correlation of diabetes disease duration and measured PA signal intensity after occlusion. Note: a.u.S=arbitrary units, ***P<0.001.
Photoacoustic signals in plantar subcutaneous vessels was similar in PwD and PwN
PAI measurement in the plantar region. The baseline measurement showed a mean value of 30.7 (SD ± 14.8) a.u. in the diabetic patients and a mean value of 35.5 (SD ± 17.6) a.u. in patients without diabetes, so there was no statistically significant difference (P=0.059), Figure 3A. Likewise, no correlation was found when considering the diabetes patients in terms of disease duration (rho=-0.074; P=0.494), Figure 3B. Measurement under occlusion in the metatarsal region showed a mean value of 28.7 (SD ± 15.2) a.u. in diabetic patients and mean value of 33.5 (SD ± 18.1) a.u. in patients without diabetes, so there was no statistically significant difference (P=0.064), Figure 3C. There was also no correlation of disease duration and PAT measurement plantar under occlusion (rho=-0.053; P=0.630), Figure 3D.
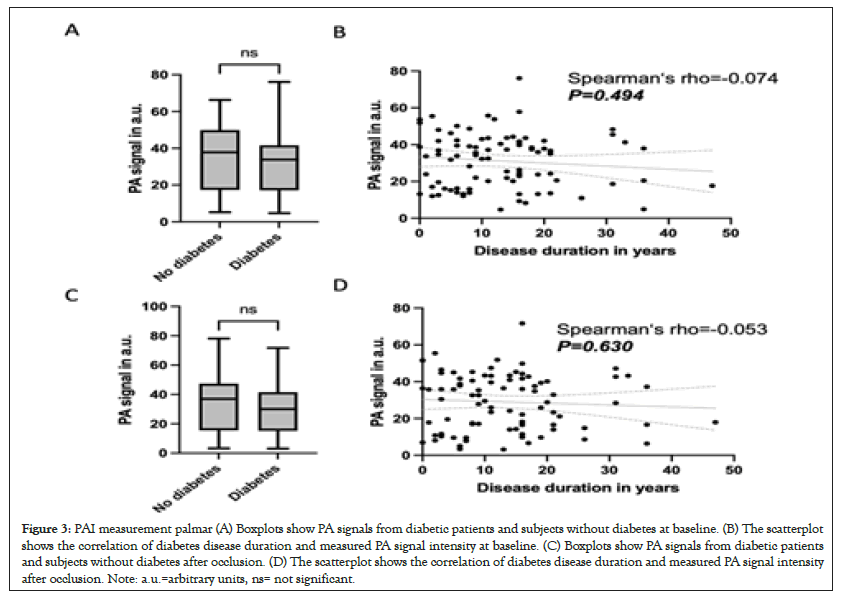
Figure 3: PAI measurement palmar (A) Boxplots show PA signals from diabetic patients and subjects without diabetes at baseline. (B) The scatterplot shows the correlation of diabetes disease duration and measured PA signal intensity at baseline. (C) Boxplots show PA signals from diabetic patients and subjects without diabetes after occlusion. (D) The scatterplot shows the correlation of diabetes disease duration and measured PA signal intensity after occlusion. Note: a.u.=arbitrary units, ns= not significant.
Time to minimal peak plantar is positively associated with diabetes disease duration in diabetic patients
Furthermore PAI was used to compare the time to reach the minimal peak between PwD and PwN. The measurement at the hand showed a mean time to peak of 14.0 ± 7.3 seconds in PwD and 12.9 ± 8.3 seconds in PwN, so there was no statistically significant difference (P=0.293), Figure 4A. There was also no statistically significant correlation between measured time to rise at the hand and disease duration in PwD (rho=-0.032; P=0.804), Figure 4B. Time to peak plantar. Here, PwD had a mean time to peak of 18.0 (SD ± 12.3) seconds and PwN of 14.0 (SD ± 7.9) seconds, so there was no statistically significant difference between the patient groups (P=0.079), Figure 4C. However, there was a statistically significant positive correlation between time to peak measured plantar and disease duration of diabetes (rho=0.341; P=0.023), Figure 4D.
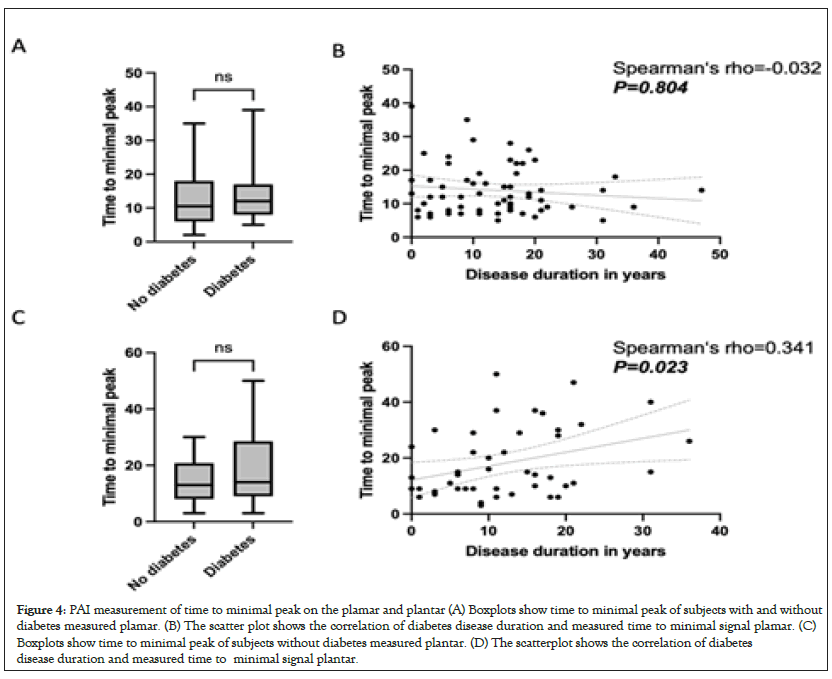
Figure 4: PAI measurement of time to minimal peak on the plamar and plantar (A) Boxplots show time to minimal peak of subjects with and without diabetes measured plamar. (B) The scatter plot shows the correlation of diabetes disease duration and measured time to minimal signal plamar. (C) Boxplots show time to minimal peak of subjects without diabetes measured plantar. (D) The scatterplot shows the correlation of diabetes disease duration and measured time to minimal signal plantar.
PAT measurement palmar is predictive for the development of diabetes
Finally it was investigated whether PAI measurement on the hand could predict development of future diabetes in PwN. For this purpose, a diabetes-typical PAI pattern was defined as a PAI value higher than the median of diabetes patients at baseline and/or occlusion measurement palmar. The analysis included 68 patients who underwent a follow-up examination at a mean of 48.2 ± 32.1 months after the first measurment. Conversion of normoglycemia to pre-/diabetes and of prediabetes to diabetes was interpreted as worsening of glycemic status 12 of 29 (41.4%) patients with abnormal PAI pattern developed diabetes during observation period. In patients with an inconspicuous PAI pattern, 4/39 (10.3%) patients developed diabetes during follow-up. Thus, an abnormal PAI pattern was significantly associated with a higher risk to develop diabetes (OR=6.176; 95%CI=1.731-19.01; P=0.004; Figure 5A) with a sensitivity of 73.3% and a specificity of 67.3% (AUC=0.703, P=0.008; Figure 5B).
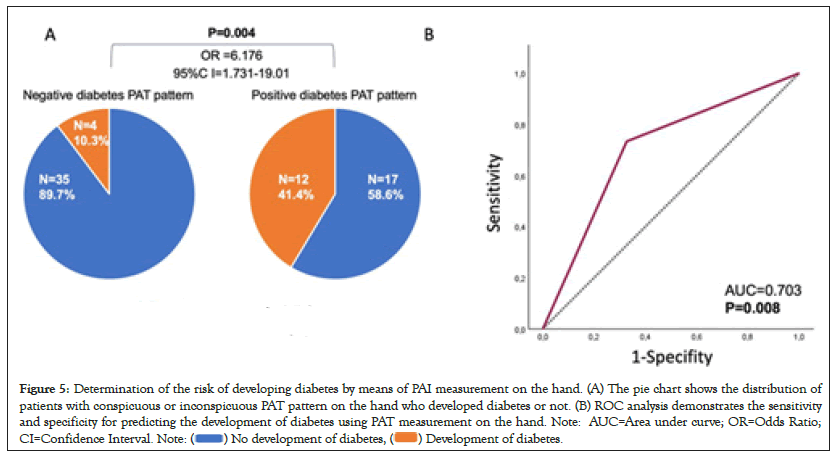
Figure 5: Determination of the risk of developing diabetes by means of PAI measurement on the hand. (A) The pie chart shows the distribution of
patients with conspicuous or inconspicuous PAT pattern on the hand who developed diabetes or not. (B) ROC analysis demonstrates the sensitivity
and specificity for predicting the development of diabetes using PAT measurement on the hand. Note: AUC=Area under curve; OR=Odds Ratio;
CI=Confidence Interval. Note: 
Discussion
Diabetes is a major cause of microangiopathic changes leading to complications such as diabetic retinopathy with subsequent blindness or diabetic nephropathy with subsequent end stage renal disease [28-30]. Noninvasive examination methods for early identification of microvascular damage in diabetic patients are currently still largely lacking. In the last decade, non-invasive optoacoustic measurement techniques have emerged as a promising new area of research in the field of oncological, inflammatory, and also angiological diseases [18-25]. Therefore, in the present proof of concept study, we demonstrated diagnosis associated differences in PAI values in diabetic patients compared to healthy subjects. These results are consistent with the previous published findings of Yang, et al. [26]. Furthermore, PAI pattern predicted by means of PAI in the healthy participants future development of dysglycemia. One explanation for the differences in signal strengths could be due to subclinical development of microangiopathy [31]. As an explanation for the higher PAI signals, Advanced Glycation Endproducts (AGE) may be higher diabetic patients. Higher AGE lead via activation of NF-kB to the generation of IL-1a, IL-6 and TNF-a and thus to the increase of oxidative stress, furthermore there is the expression of ICAM-1, VCAM-1 and tissue factor endothelial-1. These processes result in significant inflammation. Increase of oxidative stress and inflammation lead to fibrosis and stiffening of blood vessels [10,11,14]. PAI signals also correlate positively with patient disease duration of DM. The increase in PAI signal with longer disease duration could be explained by increasing microangiopathy with prolonged DM disease duration [32]. Another explanation for the difference in signal intensities on PAI measurement could be due to the differences in blood glucose levels between diabetics and individuals without diabetes [33]. Nevertheless present study have also revealed some limitations. Since this is a proof-of-concept study, intensities were measured in a.u. In addition, patients' microangiopathy was not individually classified, for example, by invasive biopsy sampling with consecutive histopatholgic workup. Thus, the study shows all in all correlative data and does not open up mechanistic explanations. Furthermore, the PAI measurement is relatively susceptible to movement, which is why fixation of the investigated limb was necessary for more than 2 minutes during the measurement. Despite these limitations, the present study clearly demonstrates that small vessel subcutaneous PAI signals in diabetic patients differ significantly from those in individuals without diabetes.
Conclusion
Finally, it should be noted that we were able to predict new prediabetes or diabetes in healthy participants with PAI measurement. Thus, noninvasive PAI measurement may represent a new diabetes screening tool and a screening tool for the development of diabetes-associated microangiopathy even before the development of pathological HbA1c. Further prospective multicenter trials with repetitive measurements at different time points of DM disease are needed to confirm our results and to investigate whether noninvasive PAI is indeed suitable as a new early screening test for prediabetes, diabetes and microangiopathy.
Disclosure
The authors declare that they have no known competing financial interests or personal relationships that could have appeared to influence the work reported in this paper.
Declarations
Consent for publication
Is available on request.
Availability of data and materials
The datasets used and/or analyzed during the current study are available from the corresponding author on reasonable request.
Funding
This research did not receive any specific grant from funding agencies in the public, commercial, or not-for-profit sector.
Acknowledgments
The authors are indebted to all patients and their relatives. J.M.P. was supported by the DFG in the framework of the DFG Clinician Scientist Programme UMEA, FU 356/12-1.
Data access and responsibility
Joachim Klode is the guarantor of this work and, as such, had full access to all the data in the study and takes responsibility for the integrity of the data and the accuracy of the data analysis.
Data and resource availability statement
The datasets generated during and/or analyzed in the current study are available from the corresponding author upon reasonable request.
References
- Ali MK, Pearson-Stuttard J, Selvin E, Gregg EW. Interpreting global trends in type 2 diabetes complications and mortality. Diabetologia. 2022;65(1):3-13.
[Crossref] [Google Scholar] [PubMed]
- Azadbakht M, Taheri Tanjani P, Fadayevatan R, Froughan M, Zanjari N. The prevalence and predictors of diabetes distress in elderly with type 2 diabetes mellitus. Diabetes Res Clin Pract. 2020;163:108133.
[Crossref] [Google Scholar] [PubMed]
- Forouhi NG, Wareham NJ. Epidemiology of diabetes. Medicine (Abingdon). 2014;42(12):698-702.
[Crossref] [Google Scholar] [PubMed]
- Harding JL, Pavkov ME, Magliano DJ, Shaw JE, Gregg EW. Global trends in diabetes complications: A review of current evidence. Diabetologia. 2019;62(1):3-16.
- Litwak L, Goh SY, Hussein Z, Malek R, Prusty V, Khamseh ME. Prevalence of diabetes complications in people with type 2 diabetes mellitus and its association with baseline characteristics in the multinational A1chieve study. Diabetol Metab Syndr. 2013;5(1):57.
[Crossref] [Google Scholar] [PubMed]
- Xu G, Liu B, Sun Y, Du Y, Snetselaar LG, Hu FB, et al. Prevalence of diagnosed type 1 and type 2 diabetes among US adults in 2016 and 2017: population based study. BMJ. 2018;362:k1497.
- Ansari P, Hannan JMA, Azam S, Jakaria M. Challenges in diabetic micro- complication management: Focus on diabetic neuropathy. J Transl Med. 2021;1(3):175-186.
- Faselis C, Katsimardou A, Imprialos K, Deligkaris P, Kallistratos M, Dimitriadis K. Microvascular complications of type 2 diabetes mellitus. Curr Vasc Pharmacol. 2020;18(2):117-124.
[Crossref] [Google Scholar] [PubMed]
- Jing X, Chen J, Dong Y, Han D, Zhao H, Wang X, et al. Related factors of quality of life of type 2 diabetes patients: a systematic review and meta-analysis. Health Qual. Life Outcomes. 2018;16(1):189.
[Crossref] [Google Scholar] [PubMed]
- de Vos LC, Lefrandt JD, Dullaart RP, Zeebregts CJ, Smit AJ. Advanced glycation end products: An emerging biomarker for adverse outcome in patients with peripheral artery disease. Atherosclerosis. 2016;254:291-299. [Crossref]
[Google Scholar] [PubMed]
- Morita M, Yano S, Yamaguchi T, Sugimoto T. Advanced glycation end products- induced reactive oxygen species generation is partly through NF-kappa B activation in human aortic endothelial cells. J Diabetes Complications. 2013;27(1):11-15.
[Crossref] [Google Scholar] [PubMed]
- Papachristou S, Pafili K, Papanas N. Skin AGEs and diabetic neuropathy. BMC Endocr Disord. 2021;21(1):28.
- Puddu A, Viviani GL. Advanced glycation endproducts and diabetes. Beyond vascular complications. Endocr Metab Immune Disord Drug Targets. 2011;11(2):132-140.
- Singh VP, Bali A, Singh N, Jaggi AS. Advanced glycation end products and diabetic complications. Korean J Physiol Pharmacol. 2014;18(1):1-14. [Crossref]
[Google Scholar] [PubMed]
- Wan L, Bai X, Zhou Q, Chen C, Wang H, Liu T, et al. The advanced glycation end-products (AGEs)/ROS/NLRP3 inflammasome axis contributes to delayed diabetic corneal wound healing and nerve regeneration. Int J Biol Sci. 2022;18(2):809-825.
- Thornton Snider J, Sullivan J, van Eijndhoven E, Hansen MK, Bellosillo N, Neslusan C, et al. Lifetime benefits of early detection and treatment of diabetic kidney disease. PLoS One. 2019;14(5):e0217487.
[Crossref] [Google Scholar] [PubMed]
- Ngo BT, Hayes KD, DiMiao DJ, Srinivasan SK, Huerter CJ, Rendell MS. Manifestations of cutaneous diabetic microangiopathy. Am J Clin Dermatol. 2005;6(4):225-237.
[Crossref] [Google Scholar] [PubMed]
- Diot G, Metz S, Noske A, Liapis E, Schroeder B, Ovsepian SV, et al. Multispectral Optoacoustic Tomography (MSOT) of human breast cancer. Clin Cancer Res. 2017;23(22):6912-22.
[Crossref] [Google Scholar] [PubMed]
- Hallasch S, Giese N, Stoffels I, Klode J, Sondermann W. Multispectral optoacoustic tomography might be a helpful tool for noninvasive early diagnosis of psoriatic arthritis. Photoacoustics. 2021;21:100225.
[Crossref] [Google Scholar] [PubMed]
- Karlas A, Nunes A, Driessen W, Liapis E, Reber J. Multi-aspect optoacoustic imaging of breast tumors under chemotherapy with exogenous and endogenous contrasts: Focus on apoptosis and hypoxia. Biomedicines. 2021;9(11):1696.
[Crossref] [Google Scholar] [PubMed]
- Knieling F, Neufert C, Hartmann A, Claussen J, Urich A, Egger C, et al. Multispectral optoacoustic tomography for assessment of crohn’s disease activity. N Engl J Med. 2017;376(13):1292-1294.
[Crossref] [Google Scholar] [PubMed]
- Masthoff M, Helfen A, Claussen J, Karlas A, Markwardt NA, Ntziachristos V, et al. Use of multispectral optoacoustic tomography to diagnose vascular malformations. JAMA Dermatol. 2018;154(12):1457-1462.
[Crossref] [Google Scholar] [PubMed]
- Monteiro Rodrigues L, Granja TF, de Andrade SF. Optoacoustic imaging offers new insights into in vivo human skin vascular physiology. Life. 2022;12(10):1628.
[Crossref] [Google Scholar] [PubMed]
- Placke JM, Mertens D, Tasdogan A, Chorti E, Schadendorf D, Ugurel S, et al. Multispectral optoacoustic tomography to differentiate between lymph node metastases and coronavirus-19 vaccine-associated lymphadenopathy. J Eur Acad Dermatol Venereol. 2023;37(5):907-913.
[Crossref] [Google Scholar] [PubMed]
- Stoffels I, Morscher S, Helfrich I, Hillen U, Leyh J, Burton NC, et al. Metastatic status of sentinel lymph nodes in melanoma determined noninvasively with multispectral optoacoustic imaging. Sci Transl Med. 2015;7(317):317ra199.
[Crossref] [Google Scholar] [PubMed]
- Yang J, Zhang G, Shang Q, Wu M, Huang L, Jiang H. Detecting hemodynamic changes in the foot vessels of diabetic patients by photoacoustic tomography. J Biophotonics. 2020;13(8):e202000011.
[Crossref] [Google Scholar] [PubMed]
- Xia J, Yao J, Wang LV. Photoacoustic tomography: principles and advances. Electromagn Waves (Camb). 2014;147:1-22.
[Crossref] [Google Scholar] [PubMed]
- Andrés-Blasco I, Gallego-Martínez A, Machado X, Cruz-Espinosa J, Di Lauro S, Casaroli-Marano R, et al. Oxidative stress, inflammatory, angiogenic, and apoptotic molecules in proliferative diabetic retinopathy and diabetic macular edema patients. Int J Mol Sci. 2023;24(9):8227.
[Crossref] [Google Scholar] [PubMed]
- Lin KY, Hsih WH, Lin YB, Wen CY, Chang TJ. Update in the epidemiology, risk factors, screening, and treatment of diabetic retinopathy. J Diabetes Investig. 2021;12(8):1322-1325.
[Crossref] [Google Scholar] [PubMed]
- Yip W, Sabanayagam C, Ong PG, Patel UD, Chow KY, Tai ES, et al. Joint effect of early microvascular damage in the eye and kidney on risk of cardiovascular events. Sci Rep. 2016;6(1):27442.
[Crossref] [Google Scholar] [PubMed]
- Sugimoto K, Murakami H, Deguchi T, Arimura A, Daimon M, Suzuki S, et al. Cutaneous microangiopathy in patients with type 2 diabetes: Impaired vascular endothelial growth factor expression and its correlation with neuropathy, retinopathy and nephropathy. J Diabetes Investig. 2019;10(5):1318-1331.
[Crossref] [Google Scholar] [PubMed]
- Ghamdi AHA. Clinical predictors of diabetic retinopathy progression; A systematic review. Curr Diabetes Rev. 2020;16(3):242-247.
[Crossref] [Google Scholar] [PubMed]
- Long H, Chen B, Li W, Xian Y, Peng Z. Blood glucose detection based on Teager-Kaiser main energy of photoacoustic signal. Comput Biol Med. 2021;134:104552.
[Crossref] [Google Scholar] [PubMed]
Citation: Placke JM, Hellmich AM, Fuhrer D, Tan S, Murakoshi D, Jose J, et al. (2023) Noninvasive Photoacoustic Imaging: A New Diagnostic Tool for Early Detection of Diabetes? A Controlled Comparative Trial of 169 Patients. J Vasc Surg. 11:532.
Copyright: © 2023 Placke JM, et al. This is an open access article distributed under the terms of the Creative Commons Attribution License, which permits unrestricted use, distribution, and reproduction in any medium, provided the original author and source are credited.
