Indexed In
- Open J Gate
- Genamics JournalSeek
- JournalTOCs
- RefSeek
- Hamdard University
- EBSCO A-Z
- OCLC- WorldCat
- Publons
- Geneva Foundation for Medical Education and Research
- Google Scholar
Useful Links
Share This Page
Journal Flyer

Open Access Journals
- Agri and Aquaculture
- Biochemistry
- Bioinformatics & Systems Biology
- Business & Management
- Chemistry
- Clinical Sciences
- Engineering
- Food & Nutrition
- General Science
- Genetics & Molecular Biology
- Immunology & Microbiology
- Medical Sciences
- Neuroscience & Psychology
- Nursing & Health Care
- Pharmaceutical Sciences
Review Article - (2021) Volume 12, Issue 2
Missed Opportunities: How Europe Failed to Predict the Second Wave and Why We Did Not Get it Worse in the SARS-CoV-2 Pandemic
Menezes L1*, Goncalves MA2,3, Santos R1, Almeida JP1 and Vieita M12Institute of Bioethics, Universidade Católica Portuguesa, 4169-005, Porto, Portugal
3Multipurpose Intensive Care Unit, Casa Saúde da Boavista 4250-20, Porto, Portugal
Received: 01-Feb-2021 Published: 22-Feb-2021, DOI: 10.35248/2155-9627.21.12.370
Abstract
The COVID-19 pandemic has entered now in its second wave in the European continent. In this article we want to analyses the preparedness level of Europe for a second wave and why did things go into the situation we faced in the last 3 months until December. We go deeper to understand the second wave in Portugal and what it could have been, using a mathematical model to compare it to the first wave.
Finally, we try to understand the improvement of procedures, medical knowledge and treatment collected and improved during these months, that allowed for a lower mortality rate in the referring period.
Keywords
Pandemic; COVID-19; Second wave; Delivery; Mortality rate
Introduction
Never as before, so much was written, so quickly, regarding a particular event, with the benefits and the problems that arise from that fact. But only by using history as a benchmark, we should have been prepared for a second wave of the SARS-Cov2 pandemic, much to the pattern seen in 1918-1919 Spanish Flue Pandemic, were the 2nd wave was the strongest of them all [1,2].
The fact is that this did not happen. Governments across Europe celebrated the end of the first wave of the pandemic in a way that seemed that this could all be over. The European Union created the so called “financial/fiscal bazooka package” thinking long term, focusing on the economic recovery that could come in several different letters: a sharp V recovery or a longer L shaped recovery, among others [3,4].
But everyone was downplaying the possibility of a strong second wave, believing that governments and health authorities would be prepared, using a good reopening across Europe to stockpile on everything that missed in the supply chain management of the first wave. Supply chains broke down in the first wave due to several factors, like centralized production and just-in-time manufacturing [5].
That generated havoc for the medical response on one side (with lack of PPE’s, testing equipment, ICU equipment, just to mention a few), but also at a global level, with many companies having to shut down due to lack of stocks that in the months before were never considered relevant for the production processes [6].
Some issues, like the ones related to PPE’s were solved for the second wave. Countries invested in local production, decentralizing production from low-income countries, seeing PPE’s strategic relevance, on shoring production with many governments across the world incentivizing such a move [7]. Governments and health authorities created strategic stockpiles in many areas, but forgot along the way about the relevance of the details.
Like in the first wave, we saw lack of testing capabilities in many European countries like France, the UK or Spain hand in hand with no track and trace systems inexistent, underutilized or inefficient [8,9].
This led to an avoidable number of case increases, with a subsequent increased death tool across Europe as seen in the graphics in Figures 1 and 2 below.
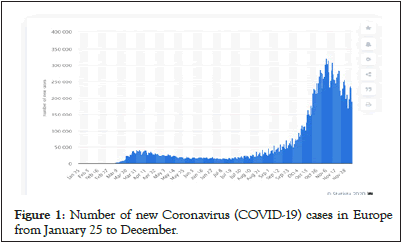
Figure 1: Number of new Coronavirus (COVID-19) cases in Europe from January 25 to December.
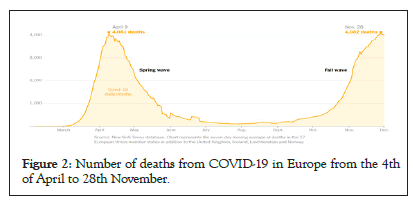
Figure 2: Number of deaths from COVID-19 in Europe from the 4th of April to 28th November.
Failing in test and trace, was the critical area were Europe got this pandemic second wave wrong. This lack of resources and coordination, alongside with the rush to open for summer holidays with the virus still in the community, created the cocktail to an exponential increase of cases, with a subsequent increase in fatalities, that was not higher due to the medical knowledge developed in the last six months, that allowed for mortality rates to decrease [10,11].
In the end of the day, we learned a lot from the first wave of this pandemic, but governments in most cases took the “eyes of the ball” with this virus. Preparing for a strong second wave healthcare response, having better testing systems in place, proper contact tracing capabilities in order, would have been the best tools to safeguard the economic impacts of this crisis. Instead the political response was more focused on the long term (which usually is the right thing to do), when the short term was the battle to win, with the enemy just waiting and taking its time to take advantage of our distractions to come back quicker and stronger [12].
What we Learned from the First Wave and what we got Right
But if there were mistakes made in the preparation of this second wave, there are many positive factors that are helping a strong but slower spread of the disease, but also, and even more relevant, a decrease in the mortality rate of COVID-19 patients.
The truth is that we could be facing, in this second wave, an even stronger surge in COVID-19 cases than the numbers we are seeing now. The generalized use of face masks, social distancing and hygiene and sanitation habits, are playing a role. Many scientists and authors have advocated the utilization of face masks early in the 1st wave. What we could ask in the first place, why did it take so long for countries to impose the mask usage? (In 1918 mask use was common across the globe, as we can see in the picture below) [13].
And secondly, where would the numbers be if we did not use face masks in this second wave?
We may never truly know the exact answer, but it’s fair to say that the numbers we are seeing now, of cases and deaths across the globe, would certainly be higher. And it will always be difficult to compute and understand the impact that policy makers have had in delaying the use of masks, undervaluing its relevance, creating in many a reluctance to the use of face masks even today (Figure 3).
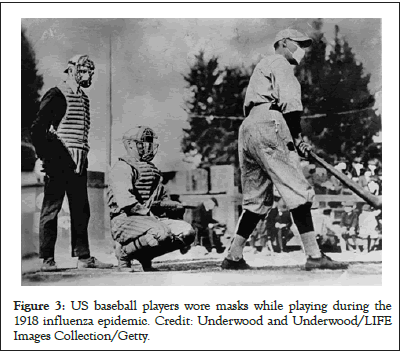
Figure 3: US baseball players wore masks while playing during the 1918 influenza epidemic. Credit: Underwood and Underwood/LIFE Images Collection/Getty.
But did we Really got Things Right
To help us understand this issue in more detail, we used a prediction model where we plotted the 1st wave ration of deaths in relation to number of new cases for the second wave, using the numbers for Portugal. The full model is available as Annex 1 to this paper.
For this exercise we considered the first wave in Portugal the period forms the 1st case in Portugal the period from 11th March 2020 until the 31st of August, and the second wave the period from the 1st of September until 15th November (date when we closed the model). In Figure 4 we can find the Portuguese numbers of new cases and deaths from COVID-19, for a better graphical understanding of this assumption.
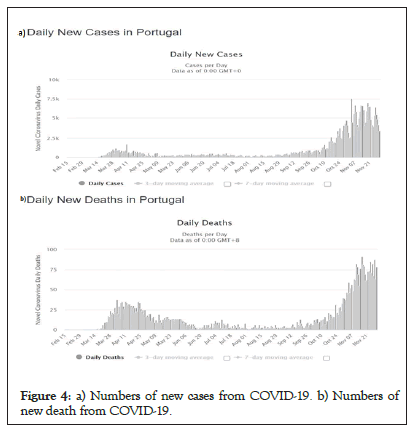
Figure 4: a) Numbers of new cases from COVID-19. b) Numbers of new death from COVID-19.
The first thing we observed from the model was the very high correlation between the number of weekly deaths and the number of detected COVID-19 positive cases in the two previous weeks. For the lag-1 and lag-2 (first and second previous weeks), the cross- correlation value is respectively 0.833 and 0.713 seen in Figure 5.
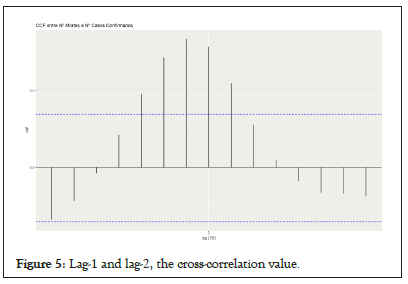
Figure 5: Lag-1 and lag-2, the cross-correlation value.
We assumed a decrease in the mortality rate wich is factual and shown in multiple studies, like seen in the Figure 6 above. By using this correlation level, we used the numbers of cases of the second wave, and inputed into the model the predicted death rate from the first wave [14].
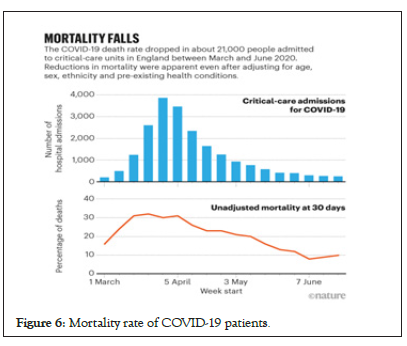
Figure 6: Mortality rate of COVID-19 patients.
Therefore, to estimate the second wave's number of deaths based on the first wave's numbers, we modeled the present number of weekly deaths predicted by the number of two previous weekly number of detected COVID-19 positive cases – as pointed before, those numbers are significantly correlated and reliable predictors of each other.
We fitted a linear model with time series components (TSLM), which allows incorporating external regressors as model parameters. Hence, the model's target variable is the number of the current week's deaths and the coefficients are both lag-1 and lag-2 (two previous weeks) number of detected COVID-19 positive cases.
The Figure 7 and Table 1 below show the findings of this model.
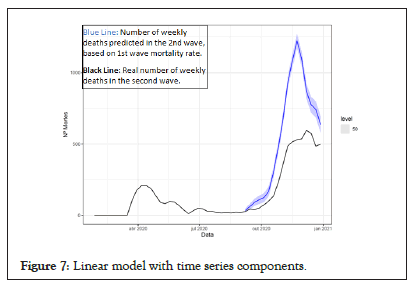
Figure 7: Linear model with time series components.
| Date (week) | Number of new cases | Occurred deaths-real | Predicted model deaths | Predicted real (%) |
|---|---|---|---|---|
| 3725 | 27 | 35 | 30% | |
| 2020-09-14 | 4594 | 45 | 62 | 38% |
| 2020-09-21 | 5027 | 41 | 92 | 124% |
| 2020-09-28 | 5547 | 52 | 110 | 112% |
| 2020-10-05 | 7513 | 75 | 125 | 67% |
| 2020-10-12 | 13247 | 101 | 169 | 67% |
| 2020-10-19 | 18775 | 135 | 303 | 124% |
| 2020-10-26 | 25655 | 228 | 473 | 107% |
| 2020-11-02 | 34983 | 352 | 667 | 89% |
| 2020-11-09 | 37977 | 485 | 923 | 90% |
| 2020-11-16 | 43457 | 516 | 1083 | 110% |
| 2020-11-23 | 34041 | 530 | 1222 | 131% |
| 2020-11-30 | 27675 | 536 | 1097 | 105% |
| 2020-12-07 | 26270 | 596 | 871 | 46% |
| 2020-12-14 | 25377 | 575 | 775 | 35% |
| 2020-12-21 | 20452 | 485 | 742 | 53% |
| 2020-12-28 | 32681 | 499 | 636 | 27% |
| Total September to December | 366996 | 5278 | 9385 | 78% |
Table 1: Medical life and dignity principles from a standpoint of medical care.
If the relation between number of cases and number of deaths in the second wave was the same as it was in the first wave, we would have more deaths in absolute number in this second wave, with and increase of up to 78% more deaths during the period of the”second wave” until December.
This was the situation across across the world: More cases, with a lower mortality rate. But what was behind this decrease? [15].
Several issues can be mentioned in this area, some more factual, others more debatable. But all of them will be subject to scrutiny and analisis in the coming years.
This disease arrived and so far, we have not discovered any miracle drugs or significant and effective treatment strategies. Demographics, hard work and hard-earned knowledge from the physicians in the frontline are two of many.
Starting with the demographics of the cases, we got more young people getting infected in the second wave, when compared to the first wave [16].
Younger children clearly are less prone to develop severe symptoms from the disease. Many of them will have no symptoms. Those that do get sick may experience milder symptoms such as cough or low fevers. Children can also have had severe complications, but this has the exception [17].
Younger adults, on the other hand, having less propensity to develop severe symptoms, have not been out of harms way during this pandemic [18].
In the article “Clinical Outcomes in Young US Adults Hospitalized with COVID-19” the authors analysed data from 3222 patients aged 18 to 34 years who were admitted to US hospitals. More than one-fifth of them required intensive care, one-tenth required mechanical ventilation, and 88, or 2.7%, died [19].
Additionally, as Jennifer Abassi describes “In late July, the CDC published a survey of 292 adults with COVID-19 who were not hospitalized. About one-fourth of respondents aged 18 through 34 years and about one-third of those aged 35 through 49 years had not fully regained their health 2 to 3 weeks after their diagnosis. The most common ongoing symptoms included cough, fatigue, congestion, and shortness of breath. To put this into perspective, the study’s authors pointed out that more than 90% of outpatients with influenza recover within about 2 weeks” [18].
In the end of the day, younger adults are less prone to stronger symptoms and, the percentage of those with severe symptoms, need for hospitalization or intensive care is much lower than for higher age demographics, as seen across multiple studies and evidence.
So, yes, a younger demographic in this second wave may have helped to keep the death rate at lower levels. But the medical knowledge of the disease is what many consider as having been the game changer in the decrease in the mortality rate observed in the second wave.
Getting back to basics was the safest bet so far. From proning, to proper oxygen intake and to the use of known steroid therapy, like Deximethasone have been so far the best weapons available to treat these patients from a disease we still know very little about.
Conclusion
The end of the first wave, and a more or less relaxed summer period in Europe, created a false sense of security, that alongside with lack of preparedeness from governments across continent, gave space to a surge that created the second wave from September 2020 onwards. Countries and the EU focused to quickly on solving the economic issues, with the famous financial bazoca, taking the eyes from the ball of COVID-19. Lack of testing capabilities was a generalized problem in combination with lack of track and tracing staff and methods, created the perfect “petri” dish for COVID-19 to prosper and thrive.
The hope of having a “V” shaped recovery underestimated the power of this virus.
The second wave was not as deadly as the first wave, and in the mathemathical model designed by this team of authors, the numbers show that things could have been even worse. Taking into account the portuguese case, a fatality rate in the fashion of the first wave would have caused almost more 10.000 deaths from September 2020 to December 2020, 78% more than 5.000 deaths registered in that period.
Two main reason can be called to help explain this fact. First the change in demographics of the infections in the second wave, with a younger population being infected, less likely to be hospitalized or die from the SARS-Cov-2 infection even tough many suffering from severe symptoms.
The other reason is that doctors on the ground got back to basics: proning and steroid therapy – namely with Deximethasone are just basic examples that show the victory of known science against the hopes and tricks of miracle drugs and treatments that simply did no come along so far.
We are entering as we fisish this article in the 3rd Wave of Sars- Cov-2 in Europe and namely in Portugal. Record levels of cases, hospitals at maximum capacity, people dying like never before in many countries. For those expecting for predictability from this infectious agent, you were wrong. Like we wrote in our previous article, “ we will not know the letter of the recovery” if it would be a “V”, “W” or any kind of letter shaped recovery.
In the end of the day we know one thing: This virus plays strongly with our humanity and our need to be together. While the global vaccination of the population does not come, the best weapon against this invisible agent is to take away from it, its most powerfull weapon: Ourselves.
REFERENCES
- Palayew A, Norgaard O, Safreed HK, Andersen TH, Rasmussen LN, Lazarus JV. Pandemic publishing poses a new COVID-19 challenge. Nat Hum Behav. 2020; 4(7):666-669.
- 1918 Pandemic Influenza: Three Waves. 2018.
- Hacker B. A fiscal bazooka from Brussels. IPS. 2020.
- Menezes L, Goncalves MA, Mexia R, Gonçalves M. COVID-19: Economic perspectives, public health measures and a “Lego” brick approach to reopening. J Health Pol Manag. 2021; 4(1):1-8.
- Reimer J. Supply chain during COVID-19: What went wrong? HERE360. 2020.
- Besson EK. COVID-19 (coronavirus): Panic buying and its impact on global health supply chains. WBB. 2020.
- Tax incentives for local PPE manufacturers pushed in Senate. Msn Money. 2020.
- Bergo I. How France’s 'chaotic' Covid-19 testing strategy is causing a real headache. The Local. 2020.
- KIRKA D. Shortage of virus tests in UK hurts effort to fight 2nd wave. US News. 2020.
- Rigby J, Newey S, Luyken J, Samuel H, Badcock J, Crisp J. Why Europe's efforts to stop a second wave of Covid were doomed to fail. The Telegraph. 2020.
- Lee D. Why wear a face covering during COVID-19? The evidence. Health Social Care News. 2020.
- Goncalves MA, Menezes L, Gonçalves M, Goncalves MA, Menezes L, Gonçalves M. Testing for SARS-CoV-2 Portuguese experience: Clinical, ethical and economical perspectives. J Clin Res Bioeth. 2020; 11(2): 1-6.
- Holder J, Gridneff MS, McCann A. Europe’s deadly second wave: How did it happen again? The New York Times. 2020.
- Why the second wave of Covid-19 appears to be less lethal. Financial Times.
- Ledford H. Why do COVID death rates seem to be falling? Nature. 2020.
- Coronavirus outbreak and kids. 2021.
- Abbasi J. Younger adults caught in COVID-19 crosshairs as demographics shift. JAMA. 2020; 324(21): 2141-2143.
- Cunningham JW, Vaduganathan M, Claggett BL, Jering KS, Bhatt AS, Rosenthal N, et al, Clinical outcomes in young US adults hospitalized with COVID-19. JAMA Intern Med. 2020.
- Ambrosio AD. Here's why COVID-19 mortality has dropped. Med Page Today. 2020.
Citation: Menezes L, Goncalves MA, Santos R, Almeida JP, Vieita M (2021) Missed Opportunities: How Europe Failed to Predict the Second Wave and Why We Did Not Get it Worse in the SARS-CoV-2 Pandemic. J Clin Res Bioeth. 12:370.
Copyright: © 2021 Menezes L, et al. This is an open-access article distributed under the terms of the Creative Commons Attribution License, which permits unrestricted use, distribution, and reproduction in any medium, provided the original author and source are credited.
