
Indexed In
- Open J Gate
- Genamics JournalSeek
- Academic Keys
- JournalTOCs
- CiteFactor
- Ulrich's Periodicals Directory
- Access to Global Online Research in Agriculture (AGORA)
- Electronic Journals Library
- Centre for Agriculture and Biosciences International (CABI)
- RefSeek
- Directory of Research Journal Indexing (DRJI)
- Hamdard University
- EBSCO A-Z
- OCLC- WorldCat
- Scholarsteer
- SWB online catalog
- Virtual Library of Biology (vifabio)
- Publons
- Geneva Foundation for Medical Education and Research
- Euro Pub
- Google Scholar
Useful Links
Share This Page
Journal Flyer
Open Access Journals
- Agri and Aquaculture
- Biochemistry
- Bioinformatics & Systems Biology
- Business & Management
- Chemistry
- Clinical Sciences
- Engineering
- Food & Nutrition
- General Science
- Genetics & Molecular Biology
- Immunology & Microbiology
- Medical Sciences
- Neuroscience & Psychology
- Nursing & Health Care
- Pharmaceutical Sciences
Research - (2021) Volume 12, Issue 1
Management of Common Bacterial Blight (Xanthomonas campestris pv. phaseoli (Smith) Dye.) of Common Bean (Phaseolus vulgaris L.) Using Resistant Varieties and Bactericidal Chemicals in Southern Ethiopia
Negash Hailu1* and Hailu Tontosha22Department of Plant Sciences, College of Agriculture and Environmental Sciences, Debark University, Debark, Ethiopia
Received: 07-Jan-2021 Published: 29-Jan-2021, DOI: 10.35248/2157-7471.21.12.533
Abstract
Common bacterial blight (CBB) caused by the bacterium Xanthomonas campestris pv. phaseoli is a major disease of common bean affecting its production in southern Ethiopia. This study was conducted to determine the effect of variety, seed treatment and foliar spraying frequencies of bactericide on disease severity, yield and yield components of common bean. Field research was conducted at Hawassa agricultural research center during 2017/18 main cropping season using Hawassa dumme and Mexican-142 varieties. Streptomycin seed treatment was integrated with Kocide-101 foliar spraying frequency at the rate of 2.31 kg ha-1 at two, three and four week’s intervals. The design was randomized complete block design arranged in factorial with three replications. Due to the effect of variety, severity was reduced by 17.2% and the mean seed yield was increased by 18% over Mexican 142. Seed treatment reduced disease severity by 10.7% and increased yield by 24.2% as compared with other untreated control. Two week interval spraying reduced severity upto 31.8% and increased yield upto 42.3% over untreated control. Integration of variety and seed treatment with two week interval foliar sprays gave higher marginal benefit and higher marginal rate of return.
Keywords
Bacterial blight; Common bean; Disease management; Southern Ethiopia
Introduction
About 500 million people in parts of Africa and Latin America consume common bean as main source of nutrients that represent 65% of total protein consumed and 32% of energy [1,2]. Common beans are rich in minerals such as iron, phosphorus, magnesium, potassium, calcium, zinc and vitamins like folate (B vitamin) that promote to a balanced healthy diet [3]. Tamado et al. [4] reported that common bean was introduced to Ethiopia in the 16th century by Portuguese. In Ethiopia, it represents one of the major food and cash crops. It is grown as cash crop by large scale production and as a major food legume by small scale farmers and consumed in different types of traditional dishes [5].
This legume is extensively cultivated in lowland and midland areas in all regions of Ethiopia [6-8]. The major common bean producing regions include Oromia, Amhara and Southern Nations Nationalities and Peoples Region (SNNPR). Their share to the national haricot bean production is 51% for Oromia, 24% for Amhara and 21% for SNNPR [9]. Especially in semiarid and sub-humid highlands of Hararghe, it is grown mostly intercropped with sorghum, chat and maize and seldom as a sole crop by subsistence farmers [10,11]. Under the ideal management conditions, productivity of common bean can reach from 2.5 to 3.0 ton per hectare in Ethiopia [9]. However, the actual average production from 2008 to 2010 production year is only 1.4 ton per hectare Katungi et al., [7], which is far lower than the potential yield. Common bean production is constrained by factors such as lack of improved varieties, moisture stresses, weed competition, and damage by insect pests and diseases [12,13]. In Ethiopia, the major diseases of common bean that should be targeted for management are common bacterial blight (CBB) caused by Xanthomonas axonopodis pv. phaseoli, halo blight caused by Pseudomonas syringae pv. phaseolicola, bacterial brown spot caused by Pseudomonas syringae pv. syringae, rust caused by Uromyces appendiculatus, anthracnose caused by Colletotrichum lindemuthianum and other viral and root rot diseases [3,4,14,15].
Common bacterial blight (CBB) is a seed borne disease caused by the gram-negative bacterial pathogen Xanthomonas axonopodis pv. phaseoli (Xap) and its fuscans variant Xanthomonas fuscans subsp. fuscans (Xff) [16]. Both strains cause identical symptoms although the later has been reported to be more aggressive [17]. Common bacterial blight is an economically-important disease that can reduce yield by 10 - 45% in moderately resistant varieties [11,14,18-21]. It is reported as the main constraint to common bean production throughout Ethiopia [14]. He also reported that, the disease has been caused yield reduction of 22.4% in Eastern part of the country.
When the disease pressure is high it is difficult to control common bacterial blight easily with cultural practices or chemical application. The effect of the disease is most severe on non-resistant varieties grown in suitable environmental conditions for the pathogen. Different crop protection and agronomic practices can influence the disease incidence and severity [14,18]. Having knowledge and experience of use of resistant varieties supplemented with chemical seed treatment and proper cultural practices is viable options in managing common bacterial blight [11,17].
Integrated disease management is a disease control method that uses all types of management to keep disease pressure below the economic threshold level [22]. Such an approach reduces disease severity or prevents epidemics during the critical periods of vegetative and reproductive plant growth. Use of resistant varieties supplemented with proper foliar spray and chemical seed treatment are the best alternatives in managing common bacterial blight of bean [11,17]. Integrating resistant varieties with chemical seed treatment is highly significant in reducing common bacterial blight consequently for increasing yield and yield component of common bean [17]. Therefore, the objectives of the study were:
To evaluate the integrated effects of chemical seed treatment, host resistance and foliar spray on the management of common bacterial blight of common bean.
To determine the effect of bactericide spraying frequency, seed treatment on incidence and severity of common bacterial blight and to determine effect of the treatments on yield and yield components of common bean.
Materials and Methods
Description of the study area
The study was conducted at Hawassa agricultural research center during 2017/18 main cropping season with natural inoculation. The area is located at 07°03’008’’N Latitude and 038°31’01’’ E Longitude and at altitude ranging from 1695 to 1713 m.a.s.l. It receives the mean annual rainfall of 948 mm. It has bimodal rainfall pattern with extended rainy season from March to September. The mean temperature ranges from 12.4°C to 28.0°C. The soil is slightly acidic to neutral with the top soil (0-30 cm) pH values ranging between 6.4 and 6.9 [23].
Experimental materials
Two common bean varieties; Hawassa-Dumme, moderately resistant variety and Mexican-142, susceptible were used. These varieties are the most adapted and widely grown across its growing areas. The antibiotic streptomycin (seed treatment) and bactericide; kocide-101 (copper hydroxide) was used as foliar spray.
Experimental design
The 16 treatment combinations were arranged as a randomized complete block design (RCBD) in a factorial arrangement with three replications. The experiment consists of 2 seed handling practices (treated or seed dressing and untreated with antibiotic streptomycin), x2 varieties (Hawassa-Dumme and Mexican-142 (G- 11239) x4 frequencies of foliar spraying applied at two, three, four weeks’ interval and control). Solution of streptomycin was prepared on the basis of 1 g of streptomycin in 10 liters of water [24] to treat 25 kg of the seed. The seeds were soaked in the solution for 3 hours and were planted soon after treatment. There were untreated seeds as control. Foliar spray of kocide-101 (copper hydroxide), contact bactericidal chemical, at the rate of 2.31 a. i. kg ha-1 [14] was applied at three frequencies of spray; every two weeks (14 days), every three weeks (21 days), every four weeks (28 days) after onset of the diseases by using a Knap-sack Sprayer.
Unsprayed plots were left as control in each variety. Totally 48 plots were used and each plot had a size of 2 m × 1.5 m=3 m2 and contains five rows (with three harvestable central rows and two rows as border effect) which is indicated in Table 1. Intra-row spacing of 40 cm and intra-plant spacing of 10 cm were adopted. Each row has 14 plants and each plot has 70 plants. Spacing between blocks 1.2 m, and between adjacent plots 0.6 m was measured to prevent bactericide drift or cross contamination for common bean field trials. Two seeds were planted per hole and thinned to one plant after 15 days after sowing to ensure 70 plants per plot.
| Treatment | Combination |
|---|---|
| T1 | Hawassa Dumme + Untreated Seed + 2 Week Application Frequency |
| T2 | Hawassa Dumme + Untreated Seed + 3 Week Application Frequency |
| T3 | Hawassa Dumme + Untreated Seed + 4 Week Application Frequency |
| T4 | Hawassa Dumme + Untreated Seed + Unsprayed |
| T5 | Hawassa Dumme + Treated Seed + 2 Week Application Frequency |
| T6 | Hawassa Dumme + Treated Seed + 3 Week Application Frequency |
| T7 | Hawassa Dumme + Treated Seed + 4 Week Application Frequency |
| T8 | Hawassa Dumme + Treated Seed + Unsprayed |
| T9 | Mexican-142 + Untreated Seed + 2 Week Application Frequency |
| T10 | Mexican-142+ Untreated Seed + 3 Week Application Frequency |
| T11 | Mexican-142+ Untreated Seed + 4 Week Application Frequency |
| T12 | Mexican-142+ Untreated Seed + Unsprayed |
| T13 | Mexican-142+ Treated Seed + 2 Week Application Frequency |
| T14 | Mexican-142+ Treated Seed + 3 Week Application Frequency |
| T15 | Mexican-142+ Treated Seed + 4 Week Application Frequency |
| T16 | Mexican-142+ Treated Seed + Unsprayed |
Table 1: The 16 treatment combinations used the field experiment.
Data Collection Methods
Diseases parameters
Days to disease onset: recorded as the disease was first noticed on the field. Then severity and incidence were also recorded.
Disease incidence and severity: Bacterial blight incidence was measured and computed. The severities were assessed at 7-days interval after the commencement of the disease symptom. Both incidence and severity were measured from ten randomly selected plants.
Disease incidence: was calculated as the percentage of plants showing disease symptoms. The numbers of plants that showed symptoms of CBB were counted from the three central rows of each plot and percentage disease incidence was calculated.
Data on disease severity: was recorded as percentage of leaf area covered by lesions. Disease severity was scored using standard disease scales of 1-9 [25]. The scale used for visual rating of the damage level of infected plant was 1 stands for approximately 5% infection; 2=15%, 3=25%, 6=65%, 8=75% and 9=85%.
The severity grades were then converted into percentage severity index (PSI) for analysis.
PSI=(Sum of numerical ratings ×100)/(Number of plants scord × maximum score on scale)
Means of the severity from each plot were used in data analysis. The area under the disease progress curve (AUDPC) from PSI was computed using the following formula [26].
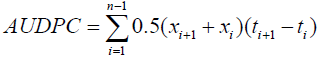
Where n is total number of assessment times, ti is time of the ith assessment in days from the first assessment date, xi is percentage of disease severity at ith assessment.
Area under disease progressive curve was expressed in percent-days because severity (x) was expressed in percent and time (t) in days [26].
Disease progress was studied by recording severity at seven days interval right from appearance of first disease symptoms. The infection rate ‘r’ was calculated by following the standard equation of Vander Plank [26]. Similarly, disease progress rate was calculated using the following formula developed [27].
DPR=ln (Y/ (1-Y))
Where, DPR: Disease progress rate, and Y: Disease severity
Yield and yield component
Date of sowing: date of sowing was recorded.
Date of emergence: days of fifty percent emergence was recorded by counting the number of seedlings emerged from each plots
Days to 50% flowering: days from emergence to 50% flowering was recorded by counting the number of plants flowered.
Days to 90% maturity: days of emergence to 90% maturity was recorded when plants or leaves show yellow color or shows senescence.
The number of pod per plant: the number of pods per plant were recorded from 10 plants in the middle three rows.
Seeds per pod: seeds from each sampled pod were counted and recorded.
Hundred seed weight (g): hundred seeds sampled at random from the total seeds harvested from each plot were recorded.
Seed yield: Harvesting was made when at least 50% of the pods on each plant should be dry to touch. After harvest, all pods from the central rows per plots were put in a place convenient for drying before thrashing. The yield was measured at 10% moisture content and was converted to kg ha-1
Relative percent yield loss
Yield losses in different varieties were calculated as percent yield loss by employing the formula developed by Robert and James [28] as follows:
RYL (%)=((Yp-Y))/Yp) ×100
Where, RYL=relative yield loss in percent, Yp=yield from the maximum protected plots (Walkie variety treated with Mancozeb fungicide) and Yt=yield from other plots.
Data Analysis
Analysis of variance (ANOVA) was performed for disease parameters (incidence, PSI, and AUDPC), yield and yield components (pod per plant, seed per pod, and 100 seed weight) with SAS statistical version 9.2 software. Duncan’s multiple range test (DMRT) at 05 probability level was used to separate treatment means. Correlation among parameters was calculated to explain the degree of relationship between the parameters.
Results and Discussion
Effect of managements on diseases incidence
The effect of varieties on common bacterial blight incidence showed significant (p≤0.05) difference at 72 DAP, highly significant (p<0.01) difference at 51 and 79 DAP (days after planting and (p<0.001) at 58 and 65 DAP. The higher disease percent incidence (PI) occurred on Mexican-142 variety, which ranged from 58.8 to 97.5% at the first and final assessment periods, respectively (Table 2). Significantly lower (51.7 and 93.3%) severities were recorded on Hawassa dumme variety at first and final dates of assessment, respectively. The result of this study is in line with the investigations of Shao and Teri [29] and Sharma et al. [30] who found highly significant differences in common bean anthracnose severities between the resistant and susceptible cultivars.
| Treatment | 51DAP | 58DAP | 65DAP | 72DAP | 79DAP | |
|---|---|---|---|---|---|---|
| Variety | ||||||
| Hawasa D | 51.7b | 65.8b | 77.5b | 89.2b | 93.3b | |
| Mexican 142 | 58.8a | 82.1a | 88.8a | 95a | 97.5a | |
| LSD | 3.4 | 3.4 | 3.2 | 3.4 | 2.2 | |
| Seed treatment | ||||||
| Untreated | 60a | 77.5a | 86.3a | 94.2a | 97.5a | |
| Treated | 50.4b | 70.4b | 80b | 90b | 93.3b | |
| LSD | 3.4 | 3.4 | 3.2 | 3.4 | 2.2 | |
| Frequency | ||||||
| 14 | 55.8 | 67.5c | 75.8c | 86.7c | 91.6c | |
| 21 | 55 | 70.8c | 80.8b | 90.8bc | 94.2bc | |
| 28 | 55 | 75.8b | 85b | 94.2ab | 96.7ab | |
| control | 55 | 81.7a | 90.8a | 96.7a | 99.2a | |
| LSD | ns | 4.8 | 4.5 | 4.8 | 3.2 | |
| CV (%) | 10.46 | 7.8 | 6.5 | 6.3 | 4 | |
Table 2: Effect of variety, seed treatment and spraying frequency on incidence of common bacterial blight during 2017/18 cropping season at 7 days intervals after the onset of symptoms.
Seed treatment showed highly significant effect on CBB incidence at first date (51 DAP) of assessment (p<0.001) and highly significant at 58, 65 and 79 DAP (p<0.01). According to Schwartz and Galvez [31], seed treatment and foliar protectant chemicals can control common bacterial blight (CBB) before it cause yield loss. Streptomycin has given marginal control by reducing initial inoculum from the external surface of the seeds [32]. In the present day, seed treatment reduced disease incidence by 14%, 9.2%, 7.9%, 4.7% and 4.3% at 51, 58, 65, 72, and 79 days after planting (DAP), respectively over untreated control (Table 3). This is the same with the study conducted by Fetene and Ayalew [33] who reported seed treatment reduced disease incidence of CBB by 43.2%, 21.4%, 20.8% and 6.3% at 57, 64, 71, and 78 days after planting (DAP), respectively over untreated control at Haramaya. Belachew et al., [18] reported chemical seed treatment alone reduced disease incidence in improved varieties by about 68% when compared with control.
| Treatment | CBB PSI (%) at indicated days after planting (DAP) | |||||
|---|---|---|---|---|---|---|
| Variety | 51 DAP | 58 DAP | 65 DAP | 72 DAP | 79 DAP | |
| Hawasa D | 12.20b | 18.35b | 26.26b | 39.30b | 40.90b | |
| Mexican 142 | 13.82a | 21.91a | 31.12a | 41.43a | 49.38a | |
| LSD | 0.66 | 1.09 | 1.1 | 1.13 | 1.12 | |
| Seed treatment | ||||||
| Untreated | 13.92a | 21.76a | 30.82a | 40.35a | 47.70a | |
| Treated | 12.10b | 18.50b | 26.57b | 35.38b | 42.59b | |
| LSD | 0.66 | 1.09 | 1.1 | 1.13 | 1.12 | |
| Frequency | ||||||
| 14 | 12.72 | 17.23d | 22.56d | 30.27d | 36.89d | |
| 21 | 12.87 | 19.09c | 26.56c | 35.48c | 41.99c | |
| 28 | 13.17 | 21.14b | 30.58b | 40.28b | 47.58b | |
| Control | 13.28 | 23.08a | 35.08a | 45.44a | 54.11a | |
| LSD | ns | 1.54 | 1.56 | 1.6 | 1.59 | |
| CV (%) | 8.64 | 9.18 | 6.53 | 5.08 | 4.22 | |
Table 3: Effect of variety, seed treatment and foliar spraying frequency of Kocide-101 on percentage severity index (PSI) of common bacterial blight (CBB).
A significant variation in CBB incidence was observed among foliar sprays at 58 and 65 DAP (p<0.001), 72DAP (p<0.05) and 79 DAP (p<0.01), while significant variation was not obtained among these treatments at first date of assessment. At 79 DAP unsprayed plot showed higher incidence (99.2%), as compared to plots sprayed every four weeks (96.7%), every three weeks (94.2%) and every two weeks (91.6%) (Table 3). This is similar with the study conducted by Fetene and Ayalew [33] who reported At 68 DAP unsprayed plot showed higher incidence (80.0%), as compared to plots sprayed every four weeks (70.0%), and every two weeks (51.67%).
Effect of managements on disease severity
Effect of variety in reducing PSI was highly significant at all dates of assessment (P<0.001). Lower percentage severity index (12.2% and 40.9%) was obtained from Hawassa-Dumme whereas higher PSI (13.82% and 49.38%) was observed in Mexican-142 at initial and final date of assessment, respectively (Table 3). The trend of the disease is increasing from initial to final dates of assessment on both varieties. Hawassa-Dumme variety reduced PSI by 11.7% at initial and 17.2% at final date of assessment over Mexican 142 variety. This is similar with the work of Tumsa et al., who reported that effect of variety and foliar sprays were significantley reduced disease severity.
Effect of seed treatment in reducing PSI was highly significant at all dates of assessment (P<0.001). Lower percentage severity index (12.1% and 42.59%) was obtained from seed treated plot. Conversely, higher PSI (13.9% and 47.7%) was observed in untreated seed at initial and final date of assessment, respectively (Table 3). However, the trend of the disease is increasing over initial to final date of assessment in both treated and untreated plots considering both varieties and all frequencies uniform. Seed treatment reduced PSI by 10.7% over untreated seed at final dates of assessment.
Effects of foliar spraying frequency in reducing PSI were highly significantly different at all dates of assessment (P<0.001) except the first day of assessment. The lowest PSI (17.23% and 36.89%) were obtained from per two week application frequency and while the highest (23.08% and 54.11%) were obtained from the control plot at second and final date of assessment, respectively (Table 3). There was significant difference between two, three, four week praying frequency and control. Earlier reports of [32,34-36] indicated that copper-hydroxide (Kocide-101) is the chemical widely used for application at different frequencies to reduce the dissemination of bacterial cells. Schwartz [37] reported that applications of Kocide- 101 in every 7 to 10 days interval can decrease establishment of bacterial pathogens. In this case, at final dates of assessment at two, three and four week’s foliar spray frequencies reduced PSI by 31.8%, 22.4% and 12.1% over unsprayed control, respectively (Table 3). This is similar with the study conducted by Fetene and Ayalew [33] who reported that at final dates of assessment at two and four week’s foliar spray interval reduced PSI by 18.0% 17.3% over unsprayed control, respectively at Haramaya. The interactions effect of the main treatments on PSI, variety with seed treatment with foliar spraying frequency, variety*seed treatment, variety*foliar spraying frequency and seed treatment* foliar spraying frequency at (p<0.05).
Effect of managements on area under disease progress curve
Analysis of variance for AUDPC values showed a highly significant difference (p <0.001) between variety. Lower AUDPC (738.28% day) was resulted from Hawassa Dumme, while higher value of AUDPC (882.48% day) was obtained from Mexican-142. This is because of the higher resistance level of Hawassa-Dumme compared to Mexican 142 (Table 4). The result of this finding is in line with the report of Belachew et al. [18] described Hawassa- Dumme as moderately resistant and Mexican 142 was susceptible variety. Hawassa-Dumme variety reduced AUDPC by 16.3% over Mexican-142.
Effect of seed treatment on AUDPC values showed significant difference (p <0.001). Lower value of AUDPC (754.6% day) was resulted from treated, while higher value of AUDPC (866% day) was resulted from untreated plot (Table 4). Seed treatment reduced AUDPC by 12.9% over untreated one. Similarly Fetene and Ayalew [33] who reported that Lower value of AUDPC was calculated from seed treatment with biofumigation combined with every two weeks foliar sprays at Haramaya and Hirna locations. Foliar spray frequencies also revealed a significant difference (P<0.05) in reducing AUDPC. Maximum AUDPC (961.04% day) was calculated from plots without protection (the control) as compared to every two, three and four weeks sprayed plots (663.98%, 759.91% and 856.6% day) respectively (In this case, at two, three and four week’s foliar spray frequencies reduced AUDPC by 30.9%, 20.93% and 10.9% over unsprayed control, respectively. The interaction of variety + foliar spraying frequency was highly significant (p<0.001).
| Treatment | AUDPC of CBB | |
|---|---|---|
| Variety | ||
| Hawasa Dumme | 738.28b | |
| Mexican 142 | 882.48a | |
| LSD | 6.2 | |
| Seed treatment | ||
| Untreated | 866.16a | |
| Treated | 754.6b | |
| LSD | 6.2 | |
| Frequency | ||
| 14 | 663.98d | |
| 21 | 759.91c | |
| 28 | 856.6b | |
| control | 961.04a | |
| LSD | 8.77 | |
| CV (%) | 1.3 | |
Table 4: Effect of variety, seed treatment and foliar spraying frequency of Kocide-101 on area under disease progressive curve (AUDPC) of common bacterial blight (CBB).
Effect of managements on disease progress rate
The rates of disease progress were varied among treatments. The highest disease progress rate (0.052 logit day-1) was recorded from Mexican 142 with untreated and unsprayed control, whereas the lowest rate (0.011 logit day-1) was from Hawassa dumme with seed treatment and two week spraying frequency. Seed treatment and foliar application frequencies reduced disease progress rate in both varieties with similar trends. Application of seed treatment and two week spray frequency reduced disease progress rate by 66.7% on Hawwassa dumme and by 67.3% on Mexican 142 compared to untreated and unsprayed (Table 5). Application of seed treatment and two week spray frequency reduced the rate of disease progress on both varieties.
| Seed treatment and | Hawassa dumme | Mexican 142 | ||
|---|---|---|---|---|
| Frequency | Rate (r) | R2 | Rate (r) | R2 |
| Untreated + Two Week | 0.015 | 95.2 | 0.021 | 96.8 |
| Untreated + Three Week | 0.02 | 93.2 | 0.028 | 93.4 |
| Untreated + Four Week | 0.025 | 98.6 | 0.037 | 87.3 |
| Untreated + Unsprayed | 0.033 | 94.5 | 0.052 | 95.7 |
| Treated +Two Week | 0.011 | 94.1 | 0.017 | 85.9 |
| Treated + Three Week | 0.016 | 97.4 | 0.022 | 97.4 |
| Treated + Four Week | 0.02 | 90.5 | 0.03 | 90.3 |
| Treated + Unsprayed | 0.026 | 98.7 | 0.041 | 97 |
Table 5: Common bean common bacterial blight disease progress rate (r) in logit per day and adjusted coefficient of determination (R2).
Effect of managements on yield and yield component of common bean
Seed yield
Common bean variety highly significantly affected seed yield per hectare (P<0.001). The average higher yield (2.79 tha-1) was obtained from Hawassa dumme while lower (2.29 tha-1) was obtained from Mexican 142 (Table 6). When considering the effect of variety, the mean seed yield of Hawassa Dumme was increased by 18% over Mexican 142. This is similar with the study of Belachew et al., [18], that revealed higher seed yield observed in Hawassa dumme and AFR-702 varieties when their seed is treated chemically with an average yield of 2.55 t ha-1 and 2.55 tha-1, respectively.
| Treatment | Yield and yield omponent | ||||||
|---|---|---|---|---|---|---|---|
| Varieties | PPP | SPP | HSW | Yield (ha-1) | |||
| Hawasa Dumme | 32.46a | 6.16a | 16.7a | 2792.4a | |||
| Mexican 142 | 29.14b | 5.71b | 14.4b | 2288.7b | |||
| LSD (0.05) | 1.33 | 0.27 | 0.58 | 216.81 | |||
| Seed treatment | |||||||
| Treated | 33.43a | 6.18a | 16.5a | 2815.4a | |||
| Untreated | 28.17b | 5.68b | 14.61b | 2265.7b | |||
| LSD (0.05) | 1.33 | 0.27 | 0.58 | 216.81 | |||
| Frequency | |||||||
| 14 | 39.69a | 6.35a | 17.64a | 3231a | |||
| 21 | 33.91b | 5.93b | 16.18b | 2739.2b | |||
| 28 | 26.76c | 5.97b | 14.86c | 2329.6c | |||
| Control | 22.84d | 5.48c | 13.52d | 1862.6d | |||
| LSD (0.05) | 1.88 | 0.38 | 0.82 | 306.62 | |||
| CV (%) | 7.32 | 7.64 | 6.37 | 14.48 | |||
Table 6: Effect of variety, seed treatment of streptomycin and foliar spraying frequency of Kocide-101 on seed yield, and yield components of common bean.
Seed treatment affected seed yield highly significantly (P<0.001). The average higher yield (2.82 tha-1) was obtained from treated plots than untreated plots (2.27 tha-1) (Table 6). Due to the effect of seed treatment the mean seed yield was increased by 24.2% over untreated control. This is similar with a study which was conducted by Tumsa [36] on combination of seed treatment and foliar spray in the Central Rift Valley showed that seed treatment reduced disease severity of common bacterial blight and increased yield advantage by 15.6% as when compared with to untreated control. The result of this study is in line with the work of Fetene and Ayalew [33] that revealed the effect of seed treatment on the mean seed yield at Hirna was increased by 26.1% over untreated control.
Foliar spraying frequency affected seed yield very highly (P<0.001). The highest yield (32.31 tha-1) was obtained from per two week (14 days) spray frequency followed by 21 and 28 days spray frequency (2.74 tha-1 and 2.33 tha-1) (Table 6). The lowest yield (1.863 tha-1) obtained from unsprayed control (Table 6). Two, three and four week foliar spray frequency increased seed yield by 42.3%, 32% and 20% over unsprayed control. Similarly Fetene and Ayalew [33] also reported that where every two and four weeks spray increased seed yield by 22.5% and 11.5% respectively, over unsprayed control at Haramaya. According to Tumsa [36], integration of seed treatment with foliar spray showed that seed treatment with twice spray with once spray reduced epidemic of CBB and increased yield advantage by 27 up to 38% in susceptible variety.
Yield components
Significant variation was obtained among varieties on number of pod per plant and number seeds per pods (P<0.01). Number of pods per plant obtained from Hawassa dumme and Mexican 142 varieties were 32.46 and 29.14 respectively (Table 6). Significantly, higher number (6.16) of seeds per pod was obtained from Hawassa dumme variety while lower numbers of seeds per pod (5.71) were recorded from Mexican 142. Effects of common bean variety significantly affected hundred seed weight (P<0.01). Significantly higher hundred seed weight (16.7 g) was recorded from Hawassa dumme while the lower values (14.4 g) were obtained from Mexican 142 variety (Table 6).
Effects of seed treatment on pods per plant seeds per pods and hundred seed weight were significant (P<0.001). Relatively higher number of pods per plant (NPPP) (33.43) was recorded from treated while lower NPPP (28.17) was recorded from untreated plots (Table 6). Significantly, higher numbers of seeds per pod (6.18) were recorded from treated plots while lower NSPP (5.68) were recorded from untreated plots. Significantly higher (16.5 g) hundred seed weight (HSW) was obtained from treated plots while lower (14.1 g) HSW was recorded from untreated plots. Tumsa, [36] reported that, seed treatment increased relative seed yield and hundred seed weight losses as compared to control.
Significant variation was obtained among foliar spray on number of seeds per pod (P<0.001). Every two, three and four weeks spray frequency had maximum number of seeds per pod (6.35), (5.93) and (5.97), respectively than unsprayed control (5.4) (Table 6). Every two, three and four weeks foliar spray had maximum NPPP (39.69), (33.91) and (26.7), respectively while the lowest NPPP (22.84) was recorded from unsprayed control. Foliar spray significantly (P<0.001) affected hundred seed weight (HSW). The highest HSW in gram (17.64) was obtained from every two weeks foliar spraying frequency while the least HSW in gram was recorded from unsprayed control (13.52) (Table 6).
Yield loss
Combination of variety, seed treatment and foliar spraying frequency promoted seed yield gain. Integration of Hawassa dumme variety with seed treatment and every two weeks foliar sprays protected seed yield loss up to 48% over the control (Table 7). Similarly Integration of Mexican 142 variety with seed treatment and every two weeks foliar sprays protected seed yield loss up to 59.7% over the control. This is similar with the finding of Fetene and Ayalew [33] who reported that combination of seed treatment with every two weeks foliar sprays protected yield loss up to 67.6% at Haramaya and 53.1% at Hirna.
| Treatment | RHSL (%) | RYL (%) | ||
|---|---|---|---|---|
| Variety | Seed treatment | Frequency | ||
| Hawassa Dume | Treated | Two Week | ||
| Three Week | 9.2 | 11 | ||
| Four Week | 19.2 | 25.7 | ||
| Control | 26.3 | 40.7 | ||
| Untreated | Two Week | 15.2 | 18.1 | |
| Three Week | 21.6 | 32.5 | ||
| Four Week | 26.8 | 37.8 | ||
| Control | 34 | 48 | ||
| Mexican-142 | Treated | Two Week | ||
| Three Week | 4.1 | 20.1 | ||
| Four Week | 9.9 | 34.5 | ||
| Control | 18 | 46.6 | ||
| Untreated | Two Week | 3.5 | 25.1 | |
| Three Week | 15 | 34.1 | ||
| Four Week | 22.4 | 45.1 | ||
| Control | 28.7 | 59.7 | ||
Table 7: Yield and hundred seed weight losses caused by common bacterial blight on common bean under variety, seed chemical treatment and foliar spraying frequency.
Maximum protection was obtained from integration of variety with seed treatment combined with every two weeks foliar spray. Integration of Hawassa dumme variety with seed treatment combined with foliar spray had remarkably lower yield loss. As compared to un-integrated, most integrated approach showed lower relative yield loss and high yield advantage.
Correlation of disease parameters with yield and yield components
Correlation analysis revealed that significant negative relationship between weekly CBB severity intervals on yield and yield under different treatment combinations (Table 8). Disease severity is strongly negatively correlated with the number of pods per plant. Similarly, at final date of assessment significant negative correlations were calculated on number of seeds per pod with correlation coefficient of 0.69. Number of seeds per pod is strongly negatively correlated with the disease severity assessed at all dates of assessment. Hundred seed weight very highly significantly negatively correlated with the disease severity assessed at all dates of assessment with correlation coefficient of -0.72 to -0.92. Disease severity is strongly negatively correlated with hundred seed weight. In addition, a highly significant negative correlation ranging from-0.62 to -0.88 was obtained on seed yield at all date of CBB severity assessment. Disease severity is strongly negatively correlated with seed yield of common bean. AUDPC is highly significantly negatively correlated with the pod per plant with the correlation coefficient -0.91, with the hundred seed weight (-0.92) and with the seed yield (-0.89) and significantly negatively correlated with number of seeds per pod (-0.71) (Table 8).
| Variety | 79 | AUDPC | PPP | SPP | HSW | YTPH |
|---|---|---|---|---|---|---|
| 79 | 1 | |||||
| AUDPC | 0.99 | 1 | ||||
| PPP | -0.89*** | -0.91*** | 1 | |||
| SPP | -0.69* | -0.71* | 0.61 | 1 | ||
| HSW | -0.92*** | -0.92*** | 0.82 | 0.68 | 1 | |
| YTPH | -0.88*** | -0.89*** | 0.82 | 0.63 | 0.85 | 1 |
Table 8: Coefficients of correlation (r) between CBB severity at different assessment dates and yield and yield components.
Conclusion and Recommendations
Common bacterial blight caused by Xanthomonas axonopodis pv. Phaseoli is one of highly catastrophic diseases of common beans in Ethiopia. It affects most of the foliar parts the crop so that considered as the major problem in most common bean production. The disease can result in total crop loss, especially when infected seeds are planted and get favorable environmental conditions. The objective of this study was to determine the effect of variety, seed chemical treatment and foliar spraying frequency in reducing CBB severity and their relationship to yield and yield components.
Integration of variety, seed treatment with streptomycin and foliar sprays of kocide 101 influenced the level of CBB disease epidemics and yield losses. Variety of Hawassa dumme reduced common bacterial blight and increased seed yield and yield components of common bean than variety Mexican 142. Seed treatment reduced common bacterial blight (CBB) epidemics and increased seed yield, yield component and gave relatively higher monetary benefits.
The combination of variety with seed treatment and with fourteen days foliar spraying frequency gave comparatively the highest marginal benefit. Hawassa dumme variety gave higher marginal benefit and marginal rate of return than Mexican 142 variety. Integration of variety, seed treatment using streptomycin, and every three weeks foliar spraying frequencies with Kocide-101 increased marginal benefits and resulted in relatively higher marginal rate of return. The integration of variety, seed treatment and spraying frequencies protected the crop from higher epidemics, increased yield and yield components and generated maximized benefits as compared to single management system. To verify and recommend the management strategy, the study should be repeated at the locations. Integration of Hawassa dumme with seed treatment and with every two weeks foliar spray in the area needs to be incorporated as alternatives for CBB management in the study area and in other parts of the country.
Acknowledgement
The authors would like to thank Ethiopian Federal Democratic Republic Ministry of Education for providing study leave, Debre Berhan University for providing fund and Hawassa Agricultural research center for providing us the field for experiment and technical support.
REFERENCES
- Blair MW, González LF, Kimani PM, Butare L. Genetic diversity, inter-gene pool introgression and nutritional quality of common beans (Phaseolus vulgaris L.) from Central Africa. Theoret Appl Genet. 2010;121(2):237-248.
- Cortes AJ, Monserrate FA, Ramírez-Villegas J, Madrinan S, Blair MW. Drought tolerance in wild plant populations: the case of common beans (Phaseolus vulgaris L.). PLoS One. 2013;8(5):62898.
- Mederos Y. Quality indicators in bean grain (Phaseolus vulgaris L.). Cult Tropics. 2006;27: 55-62.
- Tamado T, Fininsa C, Worku W. Agronomic performance and productivity of common bean (Phaseolus vulgaris L.) varieties in double intercropping with maize (Zea mays L.) in Eastern Ethiopia. Asian J Plant Sci. 2007;6(1):749-756.
- Fininsa C, Yuen J. Association of bean rust and common bacterial blight epidemics with cropping systems in Hararghe highlands, eastern Ethiopia. Int J Pest Manag. 2001;47(3):211-219.
- Habtu A, Sache I, Zadoks JC. A survey of cropping practices and foliar diseases of common beans in Ethiopia. Crop protect. 1996;15(2):179-186.
- Katungi E, Farrow A, Chianu J, Sperling L, Beebe S. Base Line Research Report on Common Bean in Eastern and Southern Africa: a situation and outlook analysis of targeting breeding and delivery efforts to improve the livelihoods of the poor in drought prone areas. ICRISAT, Kampala, Uganda. 2009;126.
- CSA (Central Statistical Agency). Area and Production of Crops, (Private Peasant Holding, Meher Season) Volume I. The Federal Democratic Republic of Ethiopia Central Statistical Agency, Statistical Bulletin. Addis Ababa, Ethiopia. 2015;126.
- Eden T. Uptake and response of haricot bean (Phaseolus vulgaris L.) varieties to different levels of phosphorus application on entisols of alemaya. M.Sc. Thesis. Alemaya University, Alemaya, Ethiopia. 2002.
- Eden T. Uptake and response of haricot bean (Phaseolus vulgaris L.) varieties to different levels of phosphorus application on entisols of alemaya. M.Sc. Thesis. Alemaya University, Alemaya, Ethiopia. 2002.
- Hailu N, Fininsa C, Tana T, Mamo G. Effect of Climate Change Resilience Strategies on Common Bacterial Blight of Common Bean (Phaseolus vulgaris L.) in Semi-arid Agro-ecology of Eastern Ethiopia. J Plant Pathol Microbiol 2015;6(10):1-10.
- Rodríguez D, Luque JJ, Creamer B. Major constraints and trends for common bean production and commercialization: Establishing priorities for future research. Agronomy of Colombia. 2014;32:423-431.
- Fininsa C. Relationship between common bacterial blight severity and bean yield loss in pure stand and bean?-? Maize intercropping systems. Int J Pest Manag. 2003;49(3):177-185.
- Fourie D. Distribution and severity of bacterial disease of dry beans (Phaseolus vulgaris) in South Africa. J Plant Pathol. 2002;150:220-226.
- Schaad NW, Vidaver AK, Lacy GH, Rudolph K, Jones JB. Evaluation of proposed amended names of several Pseudomonads and Xanthomonads and recommendations. Phytopathol 2005;90:208-213.
- Schaad NW, Vidaver AK, Lacy GH, Rudolph K, Jones JB. Evaluation of proposed amended names of several Pseudomonads and Xanthomonads and recommendations. Phytopathol. 2005;90:208-213.
- Opio AF, Allen DJ, Teri JM. Pathogenic variation in the causal agent of common bacterial blight in phaseolus bean. Plant Pathol. 1996;45:1126-1133.
- Belachew K, Gebremariam M, Alemu K. Integrated management of common bacterial blight (Xanthomonas axonopodis pv. phaseoli) of common bean (Phaseolus vulgaris) in Kaffa, Southwest Ethiopia. Malays J Med Biol Res. 2015;2(2):147-152
- Gillard CL, Conner RL, Howard RJ, Pauls KP, Shaw L (2009). The performance of dry bean cultivars with and without common bacterial blight resistance in field studies across Canada. Can J Plant Sci 89: 405-416.
- Kassahun A. Reaction of common bean cultivars to Xanthomonas axonopodis pv. phaseoli strains and integrated management of common bacterial blight in Eastern Amhara Region, Ethiopia. Haramaya: Haramaya University. 2008.
- Ciancio A, Mukerji KG. Integrated management of diseases caused by fungi, phytoplasmaand bacteria (1st edn), Springer, Berlin, Germany. 2008.
- Abiy T, Fekede A, Chemeda F. Lowland pulse diseases research in Ethiopia. In: Ali KA, Gemechu K, Ahmed S, Rajendra B (Eds). Food and forage legumes of Ethiopia: Progress and Prospects. Addis Ababa, Ethiopia. 2006.
- Nesmith WC, Hartman JR. Bean diseases manual: Field crop fungicide guide index. North Dakota State University. 2001.
- CIAT (Centro International de Agricultura Tropical). Annual report. International centre for Tropical Agriculture, CIAT, Cali, Colombia. 1998.
- Campbell CL, Madden LV. Introduction to plant disease epidemiology. John Wiley and Sons, New York. USA. 1990.
- Vander Plank J. Plant Diseases; epidemics and control. Academic press, London, UK. 1963;206.
- Chaube HS, Singh US. Plant Disease Management: Principles and Practices. CRC Press, New York, USA. 1991,329.
- Robert GD, James HT. A Biometrical Approach. Principles of statistics. (2nd edn). McGraw-Hill, New York, USA. 1991.
- Shao FM, Teri JM. Yield losses in Phaseolus beans induced by anthracnose in Tanzania. Trop Pest Manag. 1985;31:60-62.
- Sharma PN, Padder BA, Sharma OP, Pathania A, Sharma P. Pathological and molecular diversity in Colletotrichum lindemuthianum (bean anthracnose) across Himachal Pradesh, a north-western Himalayan state of India. Australas Plant Pathol. 2007;36(2):191-197.
- Schwartz HF, Galvez GE. Common bean production problems: disease, insect, soil and climatic constraints of Phaseolus vulgaris. Centro Internacional de Agricultura Tropical (CIAT), Columbia. 1980;424.
- McMullen MP, Lamey HA. Seed treatment for disease control. Disease managementguide. Northern Dakota State University. 2000;447.
- Fetene S, Ayalew A. Integrated management of common bacterial blight (Xanthomonas campestris pv. phaseoli) and its effect on seed yield of common. International Journal of life science. 2016;4(3):336-348
- Gilbertson RL, Maxwell DP. Common bacterial blight of bean. Prentice Hall Inc. Englewood Cliffs, New Jersey, USA. 1992.
- Selamawit C. Occurrence of common bacterial blight strains and its effect on quality of bean seeds in Ethiopia. M.Sc Thesis, Alemaya University, Alemaya, Ethiopia. 2004.
- Tumsa K. Integrated management of common bacterial blight of common bean through host resistance and chemical applications in the central rift valley, Ethiopia. M.Sc. Thesis. Haramaya University, Haramaya, Ethiopia. 2007.
- Schwartz HF. Bacterial blight of beans. Diseases fact sheet. Colorado State University, No. 2.913. 2004.
Citation: Hailu N, Hailu H (2021) Management of Common Bacterial Blight (Xanthomonas campestris pv. phaseoli (Smith) Dye.) of Common Bean (Phaseolus vulgaris L.) Using Resistant Varieties and Bactericidal Chemicals in Southern Ethiopia. J Plant Pathol Microbiol 12:533.
Copyright: © 2021 Hailu N, et al. This is an open-access article distributed under the terms of the Creative Commons Attribution License, which permits unrestricted use, distribution, and reproduction in any medium, provided the original author and source are credited.