

Indexed In
- Open J Gate
- Genamics JournalSeek
- Academic Keys
- JournalTOCs
- CiteFactor
- Ulrich's Periodicals Directory
- Access to Global Online Research in Agriculture (AGORA)
- Electronic Journals Library
- Centre for Agriculture and Biosciences International (CABI)
- RefSeek
- Directory of Research Journal Indexing (DRJI)
- Hamdard University
- EBSCO A-Z
- OCLC- WorldCat
- Scholarsteer
- SWB online catalog
- Virtual Library of Biology (vifabio)
- Publons
- Geneva Foundation for Medical Education and Research
- Euro Pub
- Google Scholar
Useful Links
Share This Page
Journal Flyer
Open Access Journals
- Agri and Aquaculture
- Biochemistry
- Bioinformatics & Systems Biology
- Business & Management
- Chemistry
- Clinical Sciences
- Engineering
- Food & Nutrition
- General Science
- Genetics & Molecular Biology
- Immunology & Microbiology
- Medical Sciences
- Neuroscience & Psychology
- Nursing & Health Care
- Pharmaceutical Sciences
Research Article - (2025) Volume 16, Issue 1
Management of Chocolate Spot (Botrytis fabae L.) of Faba Bean (Vicia faba L.) Using Host Resistance and Fungicide Spray Frequencies in Dabat District, North Western Ethiopia
Dinku Atnafu1*, Abaynew Jemal2 and Yehizibalem Azmeraw32Department of Agricultural Entomology, Bahir Dar University, Bahir Dar, Ethiopia
3Department of Plant Pathology, Enjibara University, Injibara, Ethiopia
Received: 16-Nov-2023, Manuscript No. JPPM-23-23928; Editor assigned: 20-Nov-2023, Pre QC No. JPPM-23-23928 (PQ); Reviewed: 06-Dec-2023, QC No. JPPM-23-23928; Revised: 08-Jan-2025, Manuscript No. JPPM-23-23928 (R); Published: 15-Jan-2025, DOI: 10.35248/2157-7471.25.16.745
Abstract
Faba bean is multi-purpose crop that plays an important role in the socio-economic life of farming communities. Chocolate spot disease, caused by Botrytis fabae is one of the yields limiting factor of this crop resulting in yield losses up to 68% in Ethiopia. Therefore, this study was conducted to assess the prevalence of chocolate spot (Botrytis fabae) of faba bean (Vicia faba) and to manage chocolate spot (Botrytis fabae) disease through host resistance and fungicide spray frequencies in Dabat district during the 2022/2023 cropping season. For the field experiment, the treatments were three faba bean varieties (Local, Wolki and Hachalu) with four fungicide spraying frequency including (Unsprayed, 1 times spray, 2 times spray and 3 times spray) of Trust Cymocop 439.5% WP at 1.5 kg/ha. It was arranged in randomized complete block design in 3 × 4 factorial combinations with three replications. The disease, yield and yield related data were subjected to analysis of variance using the general linear model procedure of SAS 9.4. The field experiment results revealed that, the interaction of variety with fungicide spraying frequency had significant effect on chocolate spot disease management. The minimum disease severity (25.33%) recorded from Wolki with three times spraying frequency while the maximum disease severity (52.33%) was recorded from unsprayed local variety at the last day of assessment. The highest AUDPC (11408% unit day) was recorded from unsprayed local variety while the lowest AUDPC (573% unit day) was recorded from Walki variety with 3 times fungicide spraying frequency Trust Cymocop 439.5% WP. In this study Walki faba bean variety with fungicide treatment particularly with 3 times fungicide spraying frequency Trust Cymocop 439.5% WP had provided best result in terms of chocolate spot disease management and get benefit from yield production. Since the research was conducted for one year the experiment should be repeated.
Keywords
AUDPC; Chocolate spot; Disease assessment; Faba bean; Incidence
Introduction
Background and justification
Faba bean (Vicia faba L.) is DS an annual herbaceous plant with coarse hollow stems that can reach height of 0.3-2 meter. It has large pinnate leaves, consisting of two to six leaflets. White flowers with purple markings form in clusters of one to five, and one to four pods usually develop from each flower cluster.
Faba bean production is concentrated in the nine world major agro-ecological regions: The Mediterranean Basin, the Nile Valley, Ethiopia, Central Asia, East Asia, Oceania, Latin America, Northern Europe, and North America. China leads the world in faba bean production in both area coverage and production and Ethiopia is the second major production areas.
The faba bean (Vicia faba L.) in Ethiopia locally known as ''Bakela'' has been grown in the highlands of Ethiopia between 1800 and 3000 m above sea level and an annual rainfall of 700-1000 mm where the need for cold temperature is met.
In Ethiopia, faba bean is grown in almost all regions occupying 3.45% (437,106.04 hectares) from the total area (12.61%) allotted for the pulse with 3.01% (9,217,615.35 quintals) out of the total annual pulse production in the country. The primary producers of pulses are small-scale farmers with small and dispersed plots under rain fed conditions with substantially lower yields of less than 0.9 t/ha as compared to the improved Faba bean varieties in highland and mid-highland altitude areas of the country.
In Ethiopia, faba bean takes the largest share of area (466,698 ha) and production (1006751.828 tones) among the pulses grown. The average national yield of faba bean crop is about 2.2 t ha-1 which is very low compared to the average yield of 3.7 t ha-1 in major producer countries.
The Amhara region has the biggest faba bean production area (42.99%) and contributes to the very best production (48.27%) within the country followed by Oromia region that has 39.06% of the world and contributes 36.34% to National production. It's chiefly made in Gondar, Gojam, Wollo, Wollega, Shoa and Gamo-Gofa regions of Ethiopia [1].
Despite its wide cultivation, there are many biotic and abiotic factors which hamper faba bean production in the world. Among the biotic factor, faba bean chocolate spot caused by Botrytis fabae, is the most important disease throughout Europe, South East Asia, South America, Korea, India, Canada, Norway, the Middleeast, Northeast and Southern Africa, and Australia. Yield losses as high as 90% and total crop failure in severe epidemics of Botrytis fabae have been reported from areas where extended periods of wet weather conditions prevail. Faba bean chocolate spot (Botrytis fabae) is the major fungal disease hampering faba bean production in Ethiopia. It is a highly prevalent and destructive disease, causing yield loss up to 61% on a susceptible and 34% on tolerant faba bean genotypes in the central highlands. Sahile Samuel reported that higher yield losses of 67.5% within the unsprayed faba bean plots in northwest Ethiopia. The assembly of the crop is hugely declining because the native faba bean cultivars area unit entirely attacked by chocolate spot and alternative diseases in southwest Ethiopia. This disease exists across all the agroecological zones. However, it's additional serious in areas of high precipitation (>900 mm) and high elevation of >2000 m.a.s.l.
Different management methods are developed in numerous countries for reducing the losses in yield of faba bean caused by chocolate spot disease. These management choices embrace exploitation resistant/tolerant genotypes, the employment of chemical fungicides, adopting practices like crop residue management and sowing date alteration. Among them, resistant varieties are the foremost popular management method providing a sensible, long and friendly. In addition to the resistant varieties, fungicides have been loosely used strategy and provide effective and reliable diseases management measures. However, fungicides might not be eco-friendly and cost effective [2].
The growing importance of faba bean as an export crop in Ethiopia has led to a renewed interest by farmers to increase the area under production. However, there is a dearth of knowledge regarding the distribution of the disease. Survey data are useful for gaining insights into the occurrence, distribution and relative importance of different crop diseases. Very little survey work has been done for chocolate spot in Ethiopia, especially in southern western Ethiopia particularly in my study place, where such information is totally lacking. So that integration of faba bean varieties with different fungicide sparing frequency is importance to protect the faba bean varieties from high chocolate spot epidemics, increased yield, yield components and maximized marginal benefit compared to a single control approach. There is no documented information of faba bean cultivars combination with Trust-Cymocop 439.5 WP fungicide and the effect of fungicide application frequency and application interval relationship against chocolate spot disease of faba bean management in Ethiopia. Even though there is limited information about status and management of faba bean chocolate spot disease, there is no extensive information about the prevalence and disease management options, in Dabat district [3].
Materials and Methods
This research comprises two components, viz. field assessment on chocolate spot disease and field experiment to determine the effect of faba bean varieties and fungicide spray frequencies on chocolate spot disease development and its effect on yield and yield components on faba bean in Dabat district, North Gondar, Ethiopia.
Assessment of chocolate spot disease
Description of the study area: The study was conducted in Dabat district, North Gondar, Amhara region of Ethiopia during 2022 cropping season. Dabat is bordered in the south by Wegera district, in the west by Tach Armachiho district, in the northwest by Tegeda district, and in the Northeast by Debark district.
The district is situated 13°09'60.00"N latitude and 37°39'59.99"E longitude. The altitude of the district ranges 1500 to 3200 m.a.s.l. The mean annual rainfall in the Dabat district a ranges 800 to 1400 mm. The main rainy season starts at the beginning of June and continues up to the end of September Dabat district is located 814 km and 75 km from Addis Ababa and north Gondar city, respectively. The district has a total of 28,293 ha of cultivated land and a population of 176,795.
The minimum and maximum temperature of the district is 18 and 35°C respectively. The major soil types are clay loam and loamy sand. Major crops grown in the area are wheat (Triticum aestivum L.), faba bean (Vicia fabae), barley (Hordeum vulgare L.), potato (Solanum tubersum L.) and teff (Eragrostis tef L). Among these crops, faba bean accounts for 56.7% of production in the area (Figure 1) [4].

Figure 1: location map of the study area (Central Statistics Agency, 2023).
Management of chocolate spot (Botrytis fabae L.) of faba bean through integrated use of host resistance and fungicide frequencies sprays
Description of the experimental site: The experiment was conducted at Dabat zuria Kebele Administration (KAs) in Dabat district on farmer field during 2022/2023 cropping season. Dabat zuria Kebele lies at altitude of 2720 m.a.s.l. The mean annual temperature and rain fall of Dabat zuria is 19°C and 980 mm respectively. The agro ecological zone of Dabat zuria is Dega and has clay loam soil type. The study area is located 11.856°N latitude and 37.654°E longitude.
Dabat zuria KAs were located around Dabat town. It was 5 km away from Dabat town. The main reason to prefer this Kebele administration for field experiment is due to hot spot area for the disease and capacity for faba bean production, accessibility and logistic.
Experimental materials: Three faba bean varieties viz., Hachalu, Wolki and one local were used in this experimental study. Varieties were selected based on their resistance level to chocolate spot. Walki is moderately resistance; Hachalu is moderately susceptible and local susceptible to chocolate spot. Samuel, et al. reported that in most cases local varieties are low yielding and highly susceptible to both biotic and abiotic stresses. The varieties were obtained from Gondar agricultural research center and local cultivar from local market. Fungicide (Trust cymocop 439.5 WP) was used in this study and it was obtained from local market (Tables 1 and 2) [5].
| Faba bean varieties | Production domain (m.a.s.l) | Maturity days | Yield Qt/ha Main season Research/Farmer | Year of released | Reaction to chocolate spot |
|---|---|---|---|---|---|
| Walki | 1800–2800 | 133-146 | 24-52 20-42 | 2008 | Moderately resistance |
| Hachalu | 1900–2800 | 122-156 | 32-45 24-35 | 2010 | Moderately Susceptible |
| Local | 1800–2800 | 120-135 | NA 10-18 | NA | Susceptible |
Table 1: List of faba bean varieties, growth habit yield, year of released and disease reaction to chocolate spot disease.
| S. no | Description | Trust Cymocop 439.5 WP |
|---|---|---|
| 1 | Active ingredient | (Copper oxchloride 397.5 g/kg+cymoxanil 42 g/kg) |
| 2 | Formulation type | WP |
| 3 | Mode of application | Foliar application |
| 4 | Dosage/kg | 1.5 kg/ha |
Table 2: Description of Trust Cymocop 439.5 WP.
Experimental treatments, design and procedures: Three faba bean varieties viz. Wolki and Hachalu (improved varieties) and one local were used in this experimental study. The two improved varieties and one local variety was combined randomly with fungicide (Trust Cymocop WP (1.5 kg/ha)) application frequencies (one, two and three times spraying) including un-spray treatment which used as a control check That was 3 varieties and 4 fungicide spray frequency and totally 12 treatments used. The unsprayed plots were included for each variety to allow maximum chocolate spot development for comparison of the effect of disease levels on different parameters. The total numbers of plots were 36. The field experiment was arranged in Randomized Complete Block Design (RCBD) in factorial combination with three replications [6].
During fungicide sprays, plastic sheet was used to separate the plot being sprayed from the adjacent plots to prevent inter plot interference of spray drift. Between plots and blocks were 0.5 m, and 1 m apart respectively. Each plot has an area of (4.8 m2) 2 m × 2.4 m.
Treatments were assigned to each plot randomly. Each plot had six rows and the distance between rows was 0.4 m. The number of plants per row was 24 and the distance between plants was 0.1 m. The middle four rows were used for all data collection. The leaving with two outer rows on both sides to avoid the border effect [7].
The seeds were sown by row planting method at a depth of 5 cm to ensure adequate emergence. The plots were fertilized with Nitrogen Phosphorus Sulfur (NPS) at the rate of 100 kg ha-1 and land preparation, weeding, and other crop management practices were carried out uniformly for each plot per the recommendation. The yield data of the plots was converted to Kilogram per hectare (Table 3) [8].
| 1 | Local+No spray fungicide |
|---|---|
| 2 | Local+Trust cymocop439.5 WP fungicide one times spray |
| 3 | Local+Trust cymocop439.5 WP fungicide two times spray |
| 4 | Local+Trust cymocop439.5 WP fungicide three times spray |
| 5 | Walki+No spray fungicide |
| 6 | Walki+Trust cymocop439.5 WP fungicide one times spray |
| 7 | Walki+Trust cymocop439.5 WP fungicide two times spray |
| 8 | Walki+Trust cymocop439.5 WP fungicide three times spray |
| 9 | Hachalu+No spray fungicide |
| 10 | Hachalu+Trust cymocop439.5 WP fungicide one times spray |
| 11 | Hachalu+Trust cymocop439.5 WP fungicide two times spray |
| 12 | Hachalu+Trust cymocop439.5 WP fungicide three times spray |
Table 3: Experimental treatment combinations.
Data collected
Disease parameter: Disease incidence and severity: Disease assessment was made on the plot using quadrant from the whole plot starting from the onset of the disease and continued every seven days until crop maturity. Both diseased and healthy plants were counted from the quadrant for disease incidence. The Percentage of Disease Incidence (PDI) was calculated according to the formula [9].
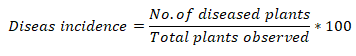
The disease severity was recorded from 12 pre-tagged plants in each plot. The disease severity of chocolate spot was recorded starting from the onset of disease in 7-days interval for three times using a 0–9 rating scale. The severity grades were converted into Percentage Severity Index (PSI) according to the formula by Wheeler [10].
The Area under the Disease Progress Curve (AUDPC) was calculated from PSI as follows:
![]()
Where, Xi represents the cumulative disease severity expressed as a proportion at the ith observation, ti the time of the ith assessment, and n the total number of observations.
Disease progress rate
The disease severity observation records at seven-day intervals were regressed over time and the disease progress rates were calculated for each variety using the formula adopted by Van der Plank, The apparent infection rate, expressed in disease units per day, was calculated from disease severity data transformed to logistic model (ln (Y/1-Y)) and Gompertz, -ln(-ln(Y)) where Y and 1-Y represent the proportion of infected plants and the proportion of healthy plants remaining in the plot, respectively. The transformed values (y) were regressed over time [11].
Prior comparison of the goodness of fit with the logistic model (ln(Y/1-Y)), showed that the Gompertz function is superior as indicated by generally higher coefficients of determination (R2).
Crop parameter
Plant height at flowering, numbers of pods per plant, number of seeds per pod, and pod length were determined from the four middle rows of 12 pre-tagged plants and seed yield per plot were recorded from four middle harvested rows, and yield per plot converted in to kg ha−1.
Days to flowering (50%) collected as the number of days’ form crop emergence to the time when 50% of the plant in each treatment shows the flower bud.
Days to 90% maturity was recorded when 90% of the plant is physiologically matured.
Plant height (cm) Average length of plant from the bottom to the tip of the plant was measured and recorded from 12 pre-tagged plant in each experimental unit at full maturity stage
Number of pod per plant was counted from randomly selected 12 pre-tagged plant in each experimental unit at maturity.
Pod length (cm) The average length of the pod from bottom to tip was measured using ruler from randomly selected 12 pretagged plant in each experimental unit at maturity.
Number of seed per pod was counted from is randomly 12 pretagged plants in each experimental unit at maturity.
Total grain yield (kg/ha) grain yield was harvested from central rows by avoiding border effects and converted to kg/ha after adjusted to a constant moisture level of pulses grains (10%) using a moisture tester.
Relative yield loss (%)
The relative loss in yield of each treatment was determined as percentage of that of protected plots of the experiment. Losses were calculated separately for each of the treatment and yield component of faba bean was determined as a percentage of that of the protected plots and the yield loss were calculated based on the formulas:
Where, RYL=Relative Yield Loss in percent, Yp=Yield from the maximum protected plots and Yt=Yield from other plots.
Correlation between yield and disease parameters
The correlations among the disease parameters and with the all yield components were tested at 5% probability level and the reliable yield loss estimated on the basis of the severity level by employing regression equations [12].
Data analysis: AUDPC values were used in the analysis of variance to compare amount of disease among plots with different treatments. ANOVA in the significant of treatment effect, means were having separated using Fisher’s protected Least Significance Difference (LSD) test at 0.05 level of probability. The data was analyzed using Statistical Analysis System (SAS) software version 9.2.
Cost benefit analysis
The prices for each variety of faba bean seeds (birr/kg) were assessed and the total price of the commodity obtained from each treatment was computed. Input costs like fungicide, cultivars, and labor was calculated according to their frequencies used. Cost of spray equipment to spray was also calculated. Based on the data obtain from the parameters, cost benefit analysis were perform using partial budget analysis, which is used to organize data and information about the cost and benefit of various agricultural alternatives to assess profitability of any new technologies (practice) to be imposed to the agricultural. Adjusted yield, gross field benefit, total cost, net benefit, marginal return and finally marginal rate of return was calculated as follows [13].
Adjusted yield (AjY): Average yield is reduced by 10% to reflect the difference between experimental yield and yield in farmers’ field.
![]()
Gross Field Benefit (GFB): was calculating by multiplying farm gate price that farmers received for the crop when they sold as adjusted yield [14].
![]()
Total Cost (TC): Cost of fungicide treatment other than the control in the experiment. The cost of other inputs and production practices were considered as insignificant among treatments.
Net Benefit (NB) is a gain computed by subtracting the total cost from gross field benefit [15].
![]()
Marginal Return (MR): It is amount of increasing in return due to the increasing of input.
Marginal Rate of Return (MRR): It was calculating as follows [16].
Where, MRR is marginal rate of returns, ΔNB difference in net income compared with control, ΔTC difference in input cost compared.
Results and Discussion
Field experiment
Chocolate spot disease incidence: The analysis of variance indicated that the main effect of varieties and fungicide spraying frequencies had highly significance different (P<0.01) reduce the incidence of chocolate spot disease recorded on all assessment dates from 67-102 DAS. Variation in the disease might be due to the difference in levels of resistance of the varieties (Tables 4 and 5).
The disease was more rapid on local variety, which reached at highest level of final disease incidence (68.00 %), followed by Hachalu and Wolki (63.00% and 58.92c %) at 102 DAS. This observation was agreed with the earlier reports by Samuel Sahile et al., and Abay Guta, et al. found that the disease development rate that was affected by the resistant level of the crop which is high on susceptible and low on resistant ones [17].
Fungicide spraying frequencies also had highly significantly different (P<0.01) from each other for disease incidence, the mean disease incidence was at initial 30.64a% (67DAS) and final 72.67a % (102DAS) on unsprayed plots and 23.42d% at initial (67DAS) and 57.22d% on final (102DAS) on three times spraying frequency of 1.5 kg/ha Trust Cymocop439.5WP fungicide sprayed. Abay Guta, et al. Reported that Trust Cymocop439 at the rate of 1.5 kg/ha applied every week at threshold level reduced incidence and severity of this disease. In this study 1.5 kg/ha Trust Cymocop439.5WP three times spraying frequency at threshold level reduced incidence of this disease. There was no significant differences between three times spraying frequencies 1.5 kg/ha Trust Cymocop439.5WP and two times spraying frequency 1.5 kg/ha Trust Cymocop439.5WP fungicide sprayed frequency at the final date of assessment (102DAS) [18].
| Varieties | 67DAS | 74DAS | 81DAS | 88DAS | 95DAS | 102DAS |
|---|---|---|---|---|---|---|
| 1 Local | 29.03a | 34.33a | 42.00a | 49.42a | 57.83a | 68.00a |
| 2 Wolki | 24.63c | 30.67b | 33.40c | 40.58c | 46.54c | 58.92c |
| 3 Hachalu | 26.00b | 31.83b | 36.40b | 43.08b | 51.92b | 63.00b |
| Mean | 26.55 | 32.28 | 37.27 | 44.36 | 52.1 | 63.31 |
| LSD (0.05) | 1.15 | 1.19 | 0.96 | 0.84 | 1.68 | 1.22 |
| F S F S0 | 30.64a | 38.67a | 42.67a | 49.33a | 58.11a | 72.67a |
| S1 | 27.11b | 32.44b | 38.46b | 46.00b | 52.78b | 64.00b |
| S2 | 25.03c | 30.44c | 35.72c | 43.22c | 50.17c | 59.33c |
| S3 | 23.42d | 27.56d | 32.22d | 38.89d | 47.33d | 57.22d |
| LSD ( 0.05) | 1.33 | 1.38 | 1.11 | 0.97 | 1.94 | 1.41 |
| CV | 5.14 | 4.37 | 3.04 | 2.23 | 3.8 | 2.27 |
Note: Means within the same column followed by the same letter(s) are not significantly different; DAS: Days After Sowing; LSD: Least Significant Difference; CV: Coefficient of Variations; S0: Zero spray; S1: Fungicide Once spray; S2: Fungicide Two times spray; S3: Fungicide Three times spray.
Table 4: Main effects of faba bean varieties and fungicide application frequency on incidence of chocolate spot disease under field condition.
| Varieties | FSF | 67DAS | 74DAS | 81DAS | 88DAS | 95DAS | 102DAS |
|---|---|---|---|---|---|---|---|
| Local | S0 | 36.93a | 42.00a | 46.00a | 56.00a | 62.00a | 78.00a |
| S1 | 28.00b | 34.00b | 43.00b | 50.00b | 58.67ba | 72.00b | |
| S2 | 26.00cebd | 32.00cb | 40.67cd | 47.00c | 55.00c | 62.00d | |
| S3 | 25.17efd | 29.33d | 38.33ef | 44.67de | 55.67bc | 60.00ed | |
| Wolki | S0 | 27.00cbd | 34.00b | 40.00ed | 45.33dc | 52.33dc | 68.00c |
| S1 | 25.67ced | 32.00cb | 34.44g | 43.33fe | 46.00e | 58.00ef | |
| S2 | 23.76gef | 30.00cd | 31.12h | 40.00g | 45.17e | 56.00gf | |
| S3 | 22.09g | 26.67e | 28.00i | 33.67h | 42.67e | 53.67g | |
| Hachalu | S0 | 28.00b | 40.00a | 42.00cb | 46.67c | 60.00a | 72.00b |
| S1 | 27.67cb | 31.33cd | 37.94f | 44.67de | 53.67dc | 62.00d | |
| S2 | 25.33ed | 29.33d | 35.33g | 42.67f | 50.33d | 60.00ed | |
| S3 | 23.01gf | 26.67e | 30.33h | 38.33g | 43.67e | 58.00ef | |
| LSD (0.05) | 2.31 | 2.39 | 1.92 | 1.68 | 3.36 | 2.44 | |
| CV (%) | 5.14 | 4.37 | 3.04 | 2.23 | 3.8 | 2.27 |
Note: Means within the same column followed by the same letter(s) are not significantly different; DAS: Days after Sowing; LSD: Least Significant Difference; CV: Coefficient of Variations; S0: Zero spray; S1: Fungicide Once spray; S2: Fungicide Two times spray; S3: Fungicide Three times spray.
Table 5: Interaction effect of faba bean varieties and fungicide application frequency on incidence of chocolate spot disease under field condition.
Chocolate spot disease severity: The combined analysis of variance showed that there was Chocolate spot disease severity data at 67DAS and 102DAS revealed very high significant (P<0.001), 74 DAS indicated highly significant (P<0.001) and at 81DAS and 88DAS indicated a significant (P<0.001) difference among main effect of varieties, fungicide spraying frequency and the interaction effects for chocolate spot disease severity recorded from the first assessment (67DAS) to the final assessment dates (102DAS) (Tables 6 and 7) [19].
| Varieties | 67DAS | 74DAS | 81DAS | 88DAS | 95DAS | 102DAS | |
|---|---|---|---|---|---|---|---|
| Local | 14.03a | 26.86a | 31.17a | 34.00a | 38.33a | 47.67a | |
| Wolki | 10.13c | 16.47c | 19.29c | 22.58c | 26.29c | 33.75c | |
| Hachalu | 11.59b | 20.30b | 23.25b | 27.83b | 31.25b | 37.00b | |
| LSD (0.05) | 1.16 | 0.91 | 1.17 | 1.67 | 1.34 | 1.19 | |
| F S F | S0 | 15.64a | 28.00a | 32.67a | 35.56a | 37.56a | 46.67a |
| S1 | 12.00b | 22.44b | 26.44b | 31.11b | 32.78b | 42.67b | |
| S2 | 10.36c | 19.26c | 21.50c | 24.89c | 30.17c | 38.00c | |
| S3 | 9.64c | 15.14d | 17.67d | 21.00d | 27.33d | 30.56d | |
| LSD( 0.05) | 1.34 | 1.05 | 1.35 | 1.92 | 1.55 | 1.37 | |
| CV | 11.54 | 5.06 | 5.61 | 5.2 | 4.96 | 3.55 | |
Note: Means within the same column followed by the same letter(s) are not significantly different; DAS: Days After Sowing; LSD: Least significant Difference; CV: Coefficient of Variations; S0: Zero spray; S1: Fungicide Once spray; S2: Fungicide Two times spray; S3: Fungicide Three times spray.
Table 6: Main effects of faba bean varieties and fungicide application frequency on severity of chocolate spot disease under field condition.
| Varieties | FSF | 67DAS | 74DAS | 81DAS | 88DAS | 95DAS | 102DAS |
|---|---|---|---|---|---|---|---|
| Local | S0 | 21.93a | 34.00a | 42.00a | 44.00a | 44.00a | 52.33a |
| S1 | 13.00b | 29.33b | 31.33b | 36.00b | 38.67b | 50.00ba | |
| S2 | 11.00fcebd | 24.00d | 28.00cd | 31.33c | 35.00cd | 48.00cb | |
| S3 | 10.17fced | 20.09f | 23.33e | 24.67d | 35.67cd | 40.33ed | |
| Wolki | S0 | 12.00cbd | 24.00d | 26.00d | 26.67d | 31.33ef | 41.67d |
| S1 | 10.67fced | 16.00h | 22.00fe | 25.33d | 26.00g | 38.00ef | |
| S2 | 8.76f | 15.67h | 16.17g | 20.00ef | 25.167hg | 30.00g | |
| S3 | 9.09fe | 10.21I | 13.00h | 18.33f | 22.67h | 25.33h | |
| Hachalu | S0 | 13.00b | 26.00c | 30.00cb | 36.00b | 37.33cb | 46.00c |
| S1 | 12.33cb | 22.00e | 26.00d | 32.00c | 33.67ed | 40.00ed | |
| S2 | 11.33cebd | 18.11g | 20.33f | 23.33ed | 30.33f | 36.00f | |
| S3 | 9.67fed | 15.10h | 16.67g | 20.00ef | 23.67hg | 26.00h | |
| LSD(0.05) | 2.33 | 1.82 | 2.33 | 3.33 | 2.68 | 2.38 | |
| CV (%) | 11.54 | 5.06 | 5.61 | 5.2 | 4.96 | 3.55 |
Note: Means within the same column followed by the same letter(s) are not significantly different; DAS: Days After Sowing; LSD: Least significant Difference; CV: Coefficient of Variations; S0: Zero spray; S1: Fungicide Once spray; S2: Fungicide Two times spray; S3: Fungicide Three times spray.
Table 7: Interaction effect of faba bean varieties and fungicide application frequency on severity of chocolate spot disease under field condition.
On the first date of assessment (67DAS), the highest disease severity 14.03% were observed on the local variety while the lowest 10.13%, and 11.59% were recorded from Wolki, and Hachalu varieties, respectively. At the final date of assessment (102 DAS), the highest disease severities 47.67%, 37.00 and the lowest 33.75% were recorded from the local, Hachalu and Wolki varieties respectively. Variety Hachalu showed moderately level of final disease severity of 37.00%. This observation was agreed with an earlier report by Abay Guta, et al. Found that the Wolki and Hachalu cultivar was moderately resistant to faba bean chocolate spot disease. According to the main effects of fungicide spraying frequencies, the highest disease severity was observed on unsprayed plots with mean value of 46.67% compared with the minimum amount of disease recorded from three times spraying frequencies (30.56%) at the final date of assessment (102DAS) [20].
The interaction effect of fungicides and varieties on Chocolate spot disease severity data at 67DAS 74DAS, 81 DAS 88DAS, 95DAS and 102DAS revealed very highly significant (P<0.01). The interaction effects of varieties and fungicide spraying frequency, the maximum disease severity was recorded from the unsprayed local variety (52.33%), followed by Hachalu and Wolki varieties (46.00% and 41.67%) respectively and the least disease severity was recorded from three times fungicide spraying frequencies when varieties of Wolki (25.33%), and (26.00% and 40.00%) on Hachalu and local respectively at the final dates of disease assessment (98DAS). The experiment that were done by using three to four sprays were applied, Trust Cymocop439.5WP at a rate of 0.7 kg per hectare proved more effective than Chlorothalonil [21].
Chocolate spot disease severities were reduced from three times fungicide spraying frequencies of Trust Cymocop439.5 WP application with all varieties in this field experimental study and have better ability to resist the disease than other treatment combinations. Ermias Teshome and Addisu Tagging reported that, a fungicide (Trust Cymocop439.5 WP at rate of 1.5 kg/ha) was integrated with sowing date and resistant faba bean variety the highest yield was harvested from plot treated with four times fungicide spray. This result agreed with Samuel Sahile, et al. reported that application of Trust Cymocop439.5 WP at fungicide spraying frequency significantly reduced chocolate spot severity. Dagne Kora, et al. Also indicated management of chocolate spot by Trust Cymocop439.5WP fungicide effectively control faba been chocolate spot [22].
Area under disease progress curve: The analysis of variance showed that there was very highly significant difference (P<0.001) among main effect of varieties, fungicide spraying frequencies and the interaction effects of varieties and fungicide spraying frequencies for AUDPC. From the analysis of variance exhibited the highest AUDPC value was recorded on Local variety 1121% day and the lowest from variety Wolki 747% day. Variety Hachalu showed moderate level of AUDPC value 893% day compared with Wolki and Local varieties (Table 8). This result was agreed with an earlier report by Abay Guta, et al. Found that the Wolki variety was moderately resistant to faba bean chocolate spot disease. AUDPC values varied among the faba bean varieties used in the experiment and is directly related to the yield loss.
| Varieties | AUDPC | Infection rate | |
|---|---|---|---|
| Local | 1121a | 0.024895 | |
| Wolki | 747c | 0.019754 | |
| Hachalu | 893b | 0.020278 | |
| Mean | 920.08 | ||
| LSD (0.05) | 24.25 | 0.0012 | |
| FSF | S0 | 1155a | 0.023098 |
| S1 | 970b | 0.02223 | |
| S2 | 840c | 0.021834 | |
| S3 | 715d | 0.019407 | |
| LSD( 0.05) | 28.01 | 0.0014 | |
| CV | 3.11 | 6.4 |
Note: Means within the same column followed by the same letter(s) are not significantly different; AUDPC: Area under Disease Progress Curve; LSD: Least Significant Difference’s; CV: Coefficient of Variations; S0: Zero spray; S1: One time fungicide spray, S2: Two times fungicide spray, S3: Three times fungicide spray
Table 8: Main effects of faba bean varieties and fungicide spraying frequency on area under disease progress curve and apparent infection rate of chocolate spot disease under field condition.
The main effect of fungicide spraying frequencies on AUDPC was also very highly significant differences (P<0.001) (Table 8). The maximum AUDPC value was recorded from the unsprayed varieties, 1155% day whereas, the least AUDPC value was recorded from varieties treated with three times spraying frequency 1.5 kg/ha Trust Cymocop439.5WP fungicide rate 715% day (Table 8). Jeger also showed that comparisons of disease progress curves and AUDPC between treatments are the most commonly used tools for evaluating practical disease management strategies [23].
The interaction effect of varieties and fungicide spraying frequencies on AUDPC was also very highly significant differences (P<0.001). The local variety of faba bean sprayed with one times, two times and three times fungicide spraying frequencies of 1.5 kg/ha Trust Cymocop439.5WP fungicide spraying frequencies showed that mean AUDPC value of 1135, 1035 and 903 (% unit/day) respectively, but the unsprayed Local variety showed mean AUDPC value of 1408% unit/day (Table 8). The improved varieties Wolki and Hachalu showed that the mean AUDPC value of (796, 675 and 573)% day and (979,810 and 669)% day sprayed with one times, two times and three times fungicide spraying frequency respectively, However the unsprayed varieties Wolki and Hachalu showed mean AUDPC value of 944 and 1112 (% unit day) respectively (Table 8). The highest mean AUDPC value was observed from Local unsprayed 1408% unit-day and lowest AUDPC from Wolki sprayed with three times fungicide spraying frequency 1.5 kg/ha of Trust Cymocop 439.5 WP fungicide rate 573% day (Figure 2). This result agreed with Dagne Kora, et al. who indicated that, spraying of fungicide every week on improved varieties significantly reduced the AUDPC value compared to the rest fungicide spray schedules and the unsprayed control [24].

Figure 2: Area under disease progress curve of chocolate spot disease in relation to varieties of Faba bean treated with different fungicide spraying frequency.
T=Treatment (T1=unsprayed Local with 1.5 kg/ha of Trust Cymocop 439.5 WP fungicide; T2=one times sprayed Local with 1.5 kg/ha of Trust Cymocop 439.5 WP; T3=two times sprayed Local with 1.5 kg/ha of Trust Cymocop 439.5 WP; T4=three time Local; T5=unsprayed Wolki with 1.5 kg/ha of Trust Cymocop 439.5 WP; T6=one times sprayed Wolki with 1.5 kg/ha of Mancozeb; T7=two times sprayed Wolki with 1.5 kg/ha of Trust Cymocop 439.5 WP; T8=three times Wolki; T9=Unsprayed Hachalu with 1.5 kg/ha of Trust Cymocop 439.5 WP; T10=one times sprayed Hachalu with 1.5 kg/ha of Trust Cymocop 439.5 WP; T11=two times sprayed local with 2.5 kg/ha of Trust Cymocop 439.5 WP; T12=Three times sprayed Hachalu.
Disease progress rat: Both logistic ln((y/1-y)), vander plank and Gompertz, -ln(-ln(y)) models were tested to choose the best fitted one in describing the rate of the disease development. The goodness of fit of models was tested based on the magnitude of the coefficient of determination (R2). Then based on their coefficient of determination values (R2), Gompertz model was better than the logistic model for the chocolate spot disease and was used to determine the disease progress rate parameters in the study. This showed that chocolate spot infection rate is apparently related to the logarithm of the ratio of the amount of diseased and healthy tissues present as described by Campbell and Madden (Tables 8 and 9).
| Varieties | FSF | AUDPC | Infection rate |
|---|---|---|---|
| Local | S0 | 1408a | 0.027029 |
| S1 | 1135b | 0.026304 | |
| S2 | 1035c | 0.024456 | |
| S3 | 903e | 0.024224 | |
| Wolki | S0 | 944ed | 0.02024 |
| S1 | 796f | 0.018776 | |
| S2 | 675g | 0.018233 | |
| S3 | 573h | 0.014989 | |
| Hachalu | S0 | 1112b | 0.02179 |
| S1 | 979d | 0.021659 | |
| S2 | 810f | 0.021331 | |
| S3 | 669g | 0.020677 | |
| LSD (0.05) | 48.51 | 0.0023 | |
| CV% | 3.11 | 6.4 |
Note: Means within the same column followed by the same letter(s) are not significantly different; AUDPC: Area under Disease Progress Curve; LSD: Least significant Difference’s; CV: Coefficient of Variations; S0: Zero spray; S1: One time fungicide spray; S2: Two times fungicide spray, S3: Three times fungicide spray
Table 9: Interaction effect of faba bean varieties and fungicide spraying frequency on area under disease progress curve and infection rate of chocolate spot disease under field condition.
A highly significant (P<0.01) differences were observed on disease progress rate among varieties, fungicide frequencies and their interaction. Disease progress rate of 0.0248949, 0.0202779 and 0.0197542 units/day were recorded on varieties Local, Hachalu and Wolki respectively. Based on fungicide spraying frequencies 0.0230983, 0.0222304, 0.0218337and 0.0194069 units/day were recorded from unsprayed, one-time spray, two times spray and three times spray of 1.5 kg/ha of Trust Cymocop 439.5 WP fungicide spraying frequencies respectively. These results indicated that the disease has progressed at faster rate on the unsprayed plot [25].
The interaction effect of local variety sprayed with one-time spray, two times spray and three times spray frequencies 0.026304, 0.024456 and 0.024224 units/day compared with its respective unsprayed local variety (0.027029 units-day) and variety Wolki sprayed with one-time spray, two times spray and three times spray gave 0.018776, 0.018233 and 0.014989 units/day compared with its respective unsprayed (0.02024) units/day. The disease progress rate of variety Hachalu sprayed with one-time spray, two times spray and three times spray also 0.021659, 0.021331 and 0.020677 units/day compared with unsprayed Hachalu variety which had 0.02179 units/day (Figures 3-5).

Figure 3: Chocolate spot progress curve based on percentage severity index as influenced by different rates of Trust Cymocop fungicide on local variety.

Figure 4: Chocolate spot progress curve based on percentage severity index as influenced by different spraying frequency of Trust Cymocop fungicide on Wolki variety.

Figure 5: Chocolate spot progress curve based on percentage severity index as influenced by different spraying frequency of Trust Cymocop fungicide on Hachalu Variety.
Effect of treatments on yield and yield components
Date to flowering and maturity: The mean days of 50% flowering of faba bean varieties ranged from 45.33 to 60.67 days. The longest period to flowering was recorded on the variety Hachalu (60.67 Th days). Hachalu had more days leading to 50% flowering than other variety, this difference may resulted from genetic variations of faba bean in similar to this result of Alemayehu, et al. Reported that days to 50% flowering ranged from 61.3 to 58.7. Data presented in Table 5 showed that fungicide applications frequencies significantly affect days to 90 % maturity of faba bean. When three faba bean varieties compared, Wolki and Local varieties showed 131 and 132 days to 90% maturity, respectively (Table 10). The longest durations of 134 90% maturity were recorded for the varieties of Hachalu, respectively. But, there were no significant differences all varieties [26].
| Varieties | FD | MD | PH | |
|---|---|---|---|---|
| Local | 45.33c | 119.50b | 87.37c | |
| Wolki | 53.67b | 124.75ba | 127.09a | |
| Hachalu | 60.67a | 127.75a | 118.28c | |
| Mean | 53.22 | 124 | 110.91 | |
| LSD (0.05) | 3.2 | 5.66 | 5.74 | |
| FSF | S0 | 42.67d | 109.78c | 79.94d |
| S1 | 47.44c | 124.22b | 101.72c | |
| S2 | 54.11b | 129.33ba | 121.81b | |
| S3 | 68.67a | 132.67a | 140.17a | |
| LSD(0.05) | 3.69 | 6.54 | 6.63 | |
| CV | 7.1 | 5.39 | 6.12 |
Note: FD: Flowering Day; MD: Maturity Day; PH: Plant Height; ns: no significant; LSD: Least Significant Difference; CV: Coefficient of Variations; S0: Zero spray; S1: Fungicide Once spray; S2: Fungicide Two times spray; S3: Fungicide Three times spray.
Table 10: Main effects of faba bean varieties and fungicide spray frequency on date to flowering 50%, maturity 90% and plant height.
This difference may be due to the variation in genetic back ground of the faba bean varieties and environmental conditions. The significant differences (P ≤ 0.01) days to 90% maturity between weekly spray intervals and unsprayed on all varieties. From sprayed plots, every one week fungicide spray showed longest to 90% days to maturity as compared to the other spray schedule. Varieties Wolki, Local, and Hachalu showed 132.67, 131.33, and 134.00 90% when weekly fungicide applied compared to untreated plots 117.67, 92.67, and 119 90% maturity dates, respectively. This indicated that frequent usage of fungicides that reduces disease infection and enhance the plants for perfoming its physiological function. The shortest durations of days to 90% maturity were recorded from untreated and 21 days treated plots of all varieties. These results are also relatively confirmed by the findings of Abay Guta, et al. Who reported that faba bean cultivar treated with fungicide showed longest days to matured when compared to untreated plots.
Plant height: Based on the analysis of variance plant height was highly significantly difference (P<0.01) among varieties at maturity stages. The maximum plant height at maturity was recorded from variety Wolki 127.09 (cm) and Minimum height was recorded from Local variety 87.37 (cm) and followed by variety Hachalu 118.28 (cm) maturity stages respectively. Mussa Jarso et al. showed that plant height of faba bean is ranged from 0.3 to 2 m depends on the nature of varieties and environmental conditions.
Plant height was highly significantly difference (P<0.01) among fungicide spraying frequency (main effects). The main effects of fungicide spraying frequency the maximum plant height was recorded from plots sprayed with three times fungicide spraying frequency of 1.5 kg/ha Trust Cymocop439.5 WP (140.17 cm and 121.81 cm) fungicide rates and the minimum plant height from unsprayed plots 79.94 (cm) at maturity. Mussa Jarso, et al. Showed that plant height of faba bean is ranged from 0.3 to 2 m depends on the nature of varieties and environmental conditions (Tables 10 and 11).
| Varieties | FSF | DF | DM | PH (cm) |
|---|---|---|---|---|
| Local | S0 | 34.00i | 92.67e | 44.60i |
| S1 | 41.67h | 125.bdac | 75.87h | |
| S2 | 49.33fge | 129.00bac | 101.47fg | |
| S3 | 56.33dc | 131.33ba | 127.53dc | |
| Wolki | S0 | 43.67hg | 117.67d | 104.43f |
| S1 | 48.67fg | 121.33bdc | 117.60de | |
| S2 | 55.667dce | 127.33bdac | 135.27bc | |
| S3 | 66.667b | 132.67a | 151.07a | |
| Hachalu | S0 | 50.33dfe | 119.00dc | 90.80g |
| S1 | 52.00dfce | 126.33bdac | 111.70fe | |
| S2 | 57.33c | 131.6ba | 128.70dc | |
| S3 | 83.00a | 134.00a | 141.90ba | |
| LSD (0.05) | 6.4 | 11.32 | 11.49 | |
| CV (%) | 7.1 | 5.39 | 6.12 |
Note: DF: Flowering Day; DM: Maturity Day; PH: Plant Height; ns: no significant; LSD: Least Significant Difference; CV: Coefficient of Variations; S0: Zero spray; S1: Fungicide Once spray; S2: Fungicide Two times spray; S3: Fungicide Three times spray.
Table 11: Interaction effects of faba bean varieties and fungicide spraying frequency on date to flowering 50%, maturity 90% and plant height.
The interaction effect of varieties and fungicide spraying frequency analysis of variance plant height was highly significantly difference (P<0.01). the maximum plant height at maturity was recorded from varieties Wolki and Hachalu treated with three times fungicide spraying frequency of 1.5 kg/ha Trust Cymocop439.5 WP (151.07 cm and, 141.90 cm) respectively and variety Local treated with three times fungicide spraying frequency with mean value (127.53 cm). And the minimum plant height was recorded from unsprayed varieties local (44.60 cm) and Hachalu and Wolki (90.80 g cm and 104.43 cm) respectively. Shahzad, et al. Reported that the height of the crop is mainly controlled by the genetic makeup of a genotype and it can also be affected by the environmental factor [27].
Pod length, number of pods per plant and number of seeds per pod: The highest mean pod length among the varieties was obtained from variety Wolki 9.14 cm Hachalu 8.85 and the lowest mean pod length was obtained from local variety 3.91 cm (Table 12). The analysis of variance revealed that the interaction of variety with fungicide spraying frequency showed very highly significant effect (P<0.001) on pod length. There were very highly significant effects (P<0.001) in pod length among the main effects of Trust Cymocop439.5 WP fungicide spraying frequency. The maximum pod length (10.38 cm) was with three times fungicide spraying frequency of fungicide application and the intermediate pod length 8.23 cm was recorded on two times fungicide spraying frequency of fungicide application. While the minimum pod length (3.84 cm) was recorded on untreated variety (Table 12). This variation of pod length occurs due to the resistance level of variety and time of fungicide application. Samuel Sahile, et al. Reported that in most cases local varieties are low yielding and highly susceptible to both biotic and abiotic stresses.
| Varieties | PL (cm) | NPPP | NSPP | HSW (gm) | Yield | |
|---|---|---|---|---|---|---|
| Local | 3.91b | 11.81c | 6.31c | 52.7c | 2.60c | |
| Wolki | 9.14a | 14.39a | 9.09a | 67.61b | 4.07a | |
| Hachalu | 8.85a | 13.29b | 8.24b | 77.80a | 3.57b | |
| Mean | 7.3 | 13.17 | 7.88 | 66.04 | 3.41 | |
| LSD (0.05) | 0.91 | 0.98 | 0.61 | 4.97 | 0.06 | |
| FSF | S0 | 3.84d | 9.79d | 4.97d | 39.62d | 2.89d |
| S1 | 6.75c | 12.21c | 6.70c | 63.91c | 3.25c | |
| S2 | 8.23b | 13.53b | 8.51b | 74.08b | 3.541b | |
| S3 | 10.38a | 17.13a | 11.34a | 86.53a | 4.11a | |
| LSD (0.05) | 1.05 | 1.14 | 0.71 | 5.73 | 0.08 | |
| CV | 14.69 | 8.82 | 9.21 | 8.88 | 2.25 | |
Note: PL: Pod Length; NPPP: Number of Pods per Plant, NSPP: Number of Seed/Pod, HSW: Hundred Seed Weight; S0=Zero spray, S1: One time fungicide spray, S2: Two times fungicide spray, S3: Three times fungicide spray, Means within the same column followed by the same letter(s) are not significantly different; LSD: Least Significant Difference, CV: Coefficient of Variations.
Table 12: Main effect of faba bean varieties and fungicide spray frequency on Pod length, number of pod per plant, number of seed per pod, hundred seed weight and grain yield.
The analysis of variance showed that the main effect of fungicide spraying frequency had very highly significantly difference (p<0.001) and interaction effect there was no significantly difference (p<0.05) on the number of pod per plant. Among faba bean variety the maximum number of pod per plant (9.14 cm) was observed on Wolki variety followed by Hachalu variety (8.85). The minimum number of pod per plant (3.91 cm) was recorded on Local variety. This result is similar with Abay, et al. Who reported that the significant different of pods per plant was observed among faba bean varieties.
The main effects of fungicide spraying frequency with three times fungicide spraying frequency sprayed with 1.5 kg/ha of Trust Cymocop439.5 WP fungicide rate and two times fungicide spraying frequency sprayed were the maximum pods per plants were recorded. And the minimum pods per plant were recorded from unsprayed varieties. The results of this study were in line with Hawthorne who found that application of fungicide gave maximum pods per plant compared to unsprayed.
The interaction effect of varieties and fungicide spraying frequency had significantly difference (p<0.001) on the number of pod per plant. the maximum pods per plants were recorded from varieties Wolki and Hachalu three times fungicide spraying frequency sprayed with 1.5 kg/ha of Trust Cymocop439.5 WP fungicide rate (13.04 and 12.57 pods) and (5.53 pods) on local varieties respectively. And the minimum pods per plant was recorded from unsprayed varieties of Wolki, Hachalu and Local (5.70 pods, 3.80 pods and 2.02 pods) respectively (Table 12).
This result agreed with Dagne Kora, et al. who indicated shorter fungicide spray frequency reduced the disease and increased the yield compared to the unsprayed plots. This observation also agree with the findings of Torres, et al. Who reported that yield reductions were observed when plans lose their flower because plants fail to set pods due to chocolate spot disease.
The main effects seeds per pod of varieties had significance difference between Wolki and Hachalu variety and highly significant effect on unsprayed local varieties relatively. Number of seeds per pod the main effects seeds per pod of varieties had significance difference (p<0.001) between varieties and the interaction of effect of varieties and fungicide rates (Table 11).
Hundred seed weight: The maximum amount of hundred seed weight was recorded from on variety Hachalu a mean value of (77.80 gm) followed by variety Wolki mean value (67.61 gm). The least hundred seed weight was recorded from local variety (52.7 gm) (Table 12). This was due to genetic variations on seed size. The results in line with the wok of Abay, et al. Who found 100 seeds weight variation observed among faba bean varieties and fungicide sprayed. There were very highly significant effects (P<0.001) in hundred seed weight among the main effects of Trust Cymocop 439.5 WP fungicide spraying frequency. Trust Cymocop439.5 WP fungicide at a rate of 1.5 kg ha-1 three times fungicide spraying frequency gave the highest hundred seed weight of faba bean 86.53 gm compared to the respective unsprayed plots 39.62 gm. From this study showed that there was the reduction of hundred seed weight in all unsprayed varieties compared to the sprayed varieties. This suggested that Trust-Cymocop fungicide application reduced seed infections that decrease the quality of the seed due to disease.
The analysis of variance indicated that interaction of varieties and fungicide spraying frequency had very highly significant effect (p<0.001) on hundred seed weight. The maximum hundred seed weight (94.67 gm) was recorded on Hachalu variety treated at three times fungicide spraying frequency followed by variety Wolki (85.50 gm) while the minimum hundred seed weight (76.43 gm) was recorded on unsprayed local variety (Table 12). From this study showed that there was the reduction of hundred seed weight in all unsprayed varieties compared to the sprayed varieties. This result agreed with Dagne Kora, et al. Who indicated shorter fungicide spray intervals reduced the disease and increased the yield compared to the unsprayed plots. Dagne Kora, et al. Also indicated that integration of moderately resistant variety with Trust Cymocop439.5 WP spray reduced the disease and increased the grain yield, as well as the seed weight of faba bean. This finding is in line with Dagne kora, et al. Who reported that chocolate spot disease has reduced the grain yield and quality by reducing 100 seeds weight.
Grain yield: Based on the combined analysis of variance the main effects of variety and fungicide spraying frequency had highly significant effect (p<0.001) on yield of faba bean (Tables 12 and 13). The main effects grain yield of varieties there was significance difference between Wolki and Hachalu variety and highly significant effect on unsprayed local varieties. The highest mean grain yield among the varieties was obtained from variety Wolki (3.96 ton ha-1) and The lowest mean grain yield was obtained from local variety (2.62 ton ha-1). There were highly significant effects (P<0.001) in grain yield among the main effects of Trust Cymocop439.5 WP fungicide spraying frequency. Trust Cymocop 439.5 WP fungicide at a rate of 2.5 kg ha-1 three times fungicide spraying frequency gave the highest yield of faba bean compared to the respective unsprayed plots. The mean grain yields recorded from three times fungicide spraying frequency.
| Varieties | FSF | PL | NPPP | NSPP | HSW(gm) | Yield (ton/ha) |
|---|---|---|---|---|---|---|
| Local | S0 | 2.02g | 8.46h | 4.03g | 23.10g | 1.78h |
| S1 | 3.44gf | 11.29gef | 5.60ef | 48.93f | 2.52g | |
| S2 | 4.67edf | 12.76cefd | 6.67ed | 62.33e | 2.59g | |
| S3 | 5.53ed | 14.75b | 8.93c | 76.43cd | 3.53e | |
| Wolki | S0 | 5.70d | 11.02gf | 5.67ef | 31.97g | 3.68d |
| S1 | 7.93c | 13.12cebd | 7.57d | 70.77ed | 3.83c | |
| S2 | 9.87b | 14.34cb | 9.97c | 79.20bcd | 4.11b | |
| S3 | 13.04a | 19.10a | 13.17a | 88.50ba | 4.65a | |
| Hachalu | S0 | 3.80egf | 9.90gh | 5.20gf | 63.81e | 3.21f |
| S1 | 8.87cb | 12.25efd | 6.93d | 72.03ecd | 3.41e | |
| S2 | 10.17b | 13.49cbd | 8.90c | 80.70bc | 3.53e | |
| S3 | 12.57a | 17.54a | 11.93b | 94.67a | 4.14b | |
| LSD(0.05) | 1.82 | 1.97 | 1.23 | 9.93 | 0.13 | |
| CV (%) | 14.69 | 8.82 | 9.21 | 8.88 | 2.25 |
Note: PL: Pod Length; NPPP: Number of Pods per Plant, NSPP: Number of Seed/Pod, HSW: Hundred Seed Weight; S0=Zero spray, S1: One time fungicide spray, S2: Two times fungicide spray, S3: Three times fungicide spray, Means within the same column followed by the same letter(s) are not significantly different; LSD: Least Significant Difference, CV: Coefficient of Variations.
Table 13: Interaction effects of faba bean varieties and fungicide spraying frequencies on pod length, number of pod per plant, number of seed per pod, hundred seed weight grain yield.
These results were agreed with Yekedem Bimrew and Hassen Shifa, they reported that Trust Cymocop 439.5 WP fungicide at a rate of 1.5 kg ha-1 gave good result than the respective unsprayed. Similarly, Dagne Kora, et al. Also reported that Trust Cymocop 439.5 WP application increased the yield of faba bean varieties, compared to the respective unsprayed controls.
The interaction effect of varieties and fungicide, three times fungicide spraying frequency was the highest grain yield (4.65 ton ha-1) was recorded on variety which was sprayed three times fungicide spraying frequency with Trust Cymocop 439.5 WP fungicide at a rate of 1.5 kg ha-1 (4.14 ton ha-1 and 3.21 ton ha-1 ) on Wolki, Hachalu and local varieties respectively. The lowest grain yield was recorded from unsprayed varieties local (1.78 ton ha-1), (3.33 ton ha-1 and 3.43 ton ha-1) on varieties Hachalu and Wolki respectively. Similarly Samuel Sahile, et al. Indicated that short fungicide spray intervals (21 days) reduced the disease severity and disease progress rate and increased the yield than the other spray intervals of Trust Cymocop439.5 WP fungicide. Another finding by Abay Guta, et al. reported the use of improved cultivars and fungicide protection as an integrated disease management increases yield and yield components.
The analysis of variance showed combination of variety and fungicide spraying frequency very highly significant effect (p<0.001) on yield loss. Research done in Northern Ethiopia showed that the use of improved faba bean varieties reduces chocolate spot disease incidence and severity and as a result it minimizes the yield losses.
According to the interaction effect of varieties and fungicide spraying frequency the highest relative yield losses recorded on the local variety (49.37%) which was unsprayed (control). Relatively, lower yield loss of (11.68%) was recorded from plots sprayed with two times 1.5 kg/ha of Trust Cymocop439.5 WP fungicide spraying frequency on Hachalu varieties. This result agreed with Dereje Gorfu and Yaynu Haile who reported that Chocolate spot caused yield losses of faba bean that varying from 34% on a tolerant genotype up to 61% on a susceptible genotype in Ethiopia. Misgana Mitiku indicated that Complete crop loss can occur when the environmental condition become conducive for chocolate spot disease.
Relative yield loss: The analysis of variance showed combination of variety and fungicide application schedule had significant effect (p<0.01) on yield loss (Table 14). The highest grain yield (4.65 ton ha-1) obtained from the variety Wolki sprayed with Trust Cymocop 439.5 WP application fungicide three times sprays and the lowest grain yield (1.78 ton ha-1) obtained from unsprayed local variety (Table 14). In this case three times spray frequencies of Trust Cymocop 439.5 WP application fungicide reduces the yield loss in all three faba bean variety. The maximum yield loss (26.03%) recorded on unsprayed.
| Varieties | Yield (ton/ha) | RYL% | |
|---|---|---|---|
| Local | 2.60c | 26.03a | |
| Wolki | 4.07a | 12.56b | |
| Hachalu | 3.57b | 13.68b | |
| Mean | 3.41 | 17.42 | |
| LSD | 0.06 | 1.99 | |
| FSF | S0 | 2.89d | 30.87a |
| S1 | 3.25c | 21.24b | |
| S2 | 3.409b | 17.57c | |
| S3 | 4.11a | 0 | |
| LSD | 0.08 | 2.3 | |
| CV | 2.25 | 13.5 |
Note: S0: Zero spray; S1: One time fungicide spray; S2: Two times fungicide spray; S3: Three times fungicide spray; Means within the same column followed by the same letter(s) are not significantly different; LSD: Least Significant Difference; CV: Coefficient of Variations.
Table 14: Main effects of faba bean varieties and fungicide spraying frequency on grain yield and relative yield loss.
Local variety and the minimum yield loss recorded on three faba bean variety with fungicide three time sprays of Trust Cymocop 439.5 WP application fungicide application. This result agreed with Dereje Gorfu and Yaynu Haile who reported that Chocolate spot caused yield losses of faba bean that varying from 34% on a tolerant genotype up to 61% on a susceptible genotype in Ethiopia. Misgana Mitiku indicated that Complete crop loss can occur when the environmental condition become conducive for chocolate spot disease. From this study showed that there was the reduction of hundred seed.
Weight in all unsprayed varieties compared to the sprayed varieties. This result agreed with Dagne Kora, et al. Who indicated fungicide spray reduced the disease and increased the yield compared to the unsprayed plots. Dagne Kora, et al. Also indicated that integration of moderately resistant variety with Trust Cymocop 439.5 WP spray reduced the disease and increased the grain yield, as well as the seed weight of faba bean.
Based on the interaction effect of variety with fungicide application the highest hundred seed weight (94.67 gm) recorded from Hachalu variety with three times spray fungicide application and the lowest hundred seed weight (23.10 gm) was recorded from un sprayed local variety. In this case the highest yield loss (49.37%) recorded from unsprayed local variety whereas the lowest yield loss (0.0%) recorded from Wolki variety with three time sprays fungicide application (Tables 14 and 15). This result indicated that the use of three time sprays fungicide application reduce hundred seed weight yield loss in all three faba bean variety. Sahile Samuel, et al. Research done in Northern Ethiopia showed that the use of improved faba bean varieties reduces chocolate spot disease incidence and severity and as a result it minimizes the yield loss.
| Varieties | FSF | Yield (ton/ha) | RYL% |
|---|---|---|---|
| Local | S0 | 1.78h | 49.37a |
| S1 | 2.52g | 28.32b | |
| S2 | 2.59g | 26.39b | |
| S3 | 3.53e | 0 | |
| Wolki | S0 | 3.68d | 20.86dc |
| S1 | 3.83c | 17.70de | |
| S2 | 4.11b | 11.68f | |
| S3 | 4.65a | 0 | |
| Hachalu | S0 | 3.21f | 22.38c |
| S1 | 3.41e | 17.70de | |
| S2 | 3.53e | 14.64fe | |
| S3 | 4.14b | 0 | |
| LSD | 0.13 | 3.98 |
Note: S0: Zero spray; S1: One time Fungicide spray; S2: Two times Fungicide spray; S3: Three times Fungicide spray; Means within the same column followed by the same letter(s) are not significantly different; LSD: Least Significant Difference; CV: Coefficient of Variations.
Table 15: Total yield and relative yield loss of faba bean varieties treated with different spraying frequencies.
Correlation analysis of disease and yield parameters
Association tests among disease variables and yield and yield component parameters were carried out by using simple correlation analysis. There was strong positive correlation between yield parameters of faba bean each other but all yield parameters have strong negative correlation with area under disease progress curve, disease severity and infection rate. AUDPC was negatively highly correlated with number of pods per plant (-0.85703**) and grain yields (-0.92069**) and severity was negatively highly correlated with number of pods per plant (-0.80949**) and grain yields (-0.90829**) the results indicated that the disease parameters which are AUDPC, severity, and infection rate highly significantly (P<0.01) correlated to each other. Yield and yield components themselves were positively correlated with each other. This result becomes in agreement with Abay Guta, et al. This showed that yield and all yield components had strong negative correlation with disease severity and positively correlated with each other. Dagne Kora, et al. Also reported that the correlation analysis between chocolate spot severity and AUDPC with yield components and agronomic parameter such as plant height, pod length number of pod per plant, and seed per pod negative relationship (Table 16).
| PH | PL | NPPP | NSPP | HSW | Yield | RYL | Severity | AUDPC | IR | |
|---|---|---|---|---|---|---|---|---|---|---|
| PH | 1 | |||||||||
| PL | 0.81228** | 1 | ||||||||
| NPPP | 0.66412** | 0.72791** | 1 | |||||||
| NSPP | 0.86494** | 0.85303** | 0.79301** | 1 | ||||||
| HSW | 0.8476** | 0.76645** | 0.68768** | 0.82492** | 1 | |||||
| YIELD | 0.88715** | 0.8275** | 0.70359** | 0.80478** | 0.72612** | 1 | ||||
| RYL | -0.87049** | -0.72952** | -0.77304** | -0.82997** | -0.81718** | -0.87238** | 1 | |||
| SEV | -0.82979** | -0.8898** | -0.80949** | -0.89189** | -0.77306** | -0.90829** | 0.81978** | 1 | ||
| AUDPC | -0.84628** | -0.85703** | -0.8501** | -0.83748** | -0.75201** | -0.92069** | 0.85578** | 0.92948** | 1 | |
| IR | 0.52442** | 0.631** | 0.42719** | 0.61365** | 0.43533** | 0.60705** | 0.4219** | 0.78125** | 5.6294 | 1 |
Note: **: Correlation is significant at the 0.01 level (2-tailed); AUDPC: Area under Disease Progress Curve; PH: Plant Height; NPPP: Number of Pods per Plant
Table 16: Association test for disease and yield parameter.
The regression analysis of the final severity (98DAS) as predictor with yield (dependent variable) showed a highly significant (p ≤ 0.01) relationship. The regression equation of the grain yield (t ha-1)=-10.95x+77.11 (R2=88.05%, P=0.00015) demonstrated reduction of about -10.95 t ha-1 grain yield with the increase of 1% severity (Figure 6). The values of coefficient of determination (R2) explained that 88.05 % of the losses in grain yield were due to the effect of the faba bean “chocolate spot” disease infection of faba bean estimated as the final severity on the yield loss (%). (The independent variable x indicates the disease severity level in percentage). Similarly, regression analysis of the final severity (102DAS) as predictor with hundred seeds weight.

Figure 6: Linear regressions of grain yield and terminal severity.
Economic analysis
The maximum net benefit (207885 ETB ha-1) was recorded from walki variety treated with 3 times spray of fungicide application compared to unsprayed walki variety (164955 ETB ha-1) and walki variety treated at 2 times spray of fungicide application recorded high net benefit (183873 ETB ha-1) compared to 1 times spray of Walki variety (171417 ETB ha-1) (Table 17).
The highest net benefit (184935 ETB ha-1) was recorded from Hachalu variety treated at 3 times spray of fungicide application compared to unsprayed Hachalu variety (143805 ETB ha-1) and Hachalu variety treated at 2 times spray of fungicide application recorded high net benefit (157773 ETB ha-1) compared to 1 times spray of Hachalu variety (152517 ETB ha-1)
Local variety treated with 3 times spray of fungicide had highest net benefit (157485 ETB ha-1) compared with its respective unsprayed plot (79455 ETB ha-1), 2 times spray plot (115473 ETB ha-1) and 1 times spray plot (112467ETB ha-1) of local variety with Trust Cymocop439.5 WP fungicide (Table 14). This result indicated that 3 times spray of Trust Cymocop439.5 WP fungicide had maximum net benefit compared to the rest spray frequencies.
| Var | Fun | Yield ton/ha | AY% | PP/Ton | GB/ha | TVC | NB | MRR |
|---|---|---|---|---|---|---|---|---|
| Local | S0 | 1.78 | 1.602 | 50000 | 80100 | 645 | 79455 | - |
| Wolki | S0 | 3.68 | 3.312 | 50000 | 165600 | 645 | 164955 | - |
| Hachalu | S0 | 3.21 | 2.889 | 50000 | 144450 | 645 | 143805 | 8900 |
| Local | S1 | 2.52 | 2.268 | 50000 | 113400 | 933 | 112467 | 11462.5 |
| Local | S2 | 2.59 | 2.331 | 50 | 116550 | 1077 | 115473 | 2087.5 |
| Local | S3 | 3.53 | 3.177 | 50000 | 158850 | 1365 | 157485 | 14587.5 |
| Wolki | S1 | 3.83 | 3.447 | 50000 | 172350 | 933 | 171417 | 2243.8 |
| Hachalu | S1 | 3.41 | 3.069 | 50000 | 153450 | 933 | 152517 | 3025 |
| Wolki | S2 | 4.11 | 3.699 | 50000 | 184950 | 1077 | 183873 | 8650 |
| Hachalu | S2 | 3.53 | 3.177 | 50000 | 158850 | 1077 | 157773 | 3650 |
| Wolki | S3 | 4.65 | 4.185 | 50000 | 209250 | 1365 | 207885 | 8337.5 |
| Hachalu | S3 | 4.14 | 3.726 | 50000 | 186300 | 1365 | 184935 | 9431.3 |
Note: Var: Varieties; AGY: Adjusted Grain Yield ton; TVC: Total Variable Cost; GY: Grain Yield; GB: Gross Benefit; NB: Net Benefit; MRR: Marginal Rate of Return; S0: Zero spray; S1: Fungicide One spray, S2: Fungicide Two spray; S3: Fungicide Three spray
Table 17: Partial budget analysis for chocolate spot management of faba bean crop.
The data analysis indicated that the highest Marginal rate of return was maintained from local variety treated with 1 times,3 times fungicide spraying frequency (14587.5 and 11462.5) respectively followed by variety Hachalu treated with unsprayed, and 3 times fungicide spraying frequency 1.5 kg/ha of Trust Cymocop439.5 WP fungicide (8900.0, and 9431.3). Moreover, Walki variety treated with 1 times, 2 times and three times fungicidespraying frequency with 1.5 kg/ha of Trust Cymocop439.5 WP fungicide was recorded promising Marginal rate of return with mean values of (8650.0 and 8337.3) respectively (Table 17).
Conclusion
Chocolate spot is the major economically importance disease in faba bean growing area of Dabat district, North Gondar Administrative Zone, Ethiopia. Chocolate spot distributes in different level of disease incidence and disease severity. This disease influences the yield and yield component of faba bean growing area by reducing hundred seed weight and farmers grow local susceptible variety and do not apply fungicides to manage the disease. This study raveled that plant density, sowing date, growth stage, altitude and precursor crop had effect on the prevalence of faba bean chocolate spot disease.
In this study, use of host plant resistance and application of Trust Cymocop439.5 WP fungicide considerably reduced the severity of the disease and increase the yields of the crop. In this study, Variety Wolki retarded the effect of chocolate spot disease compared with other treatments in either on the main effect or combined with all fungicide sprayed frequency. Three times sprayed frequency of Trust Cymocop439.5 WP fungicide with Wolki faba bean variety at Dabat district consistently reduced chocolate spot severity, incidence and area under disease progress curve and increased yield compared to the other spray frequency and unsprayed plot. So the integration of resistant variety with three time’s sprayed frequency of fungicide application increases yield and net benefit by reducing the disease incidence and severity.
Recommendations
It is recommended that three times spraying frequency of Trust Cymocop439.5 WP fungicide at right time with Wolki variety is increase faba bean production and can be recommended in the study area to manage chocolate spot disease. Otherwise research is one year work it must be repeated for general conclusive recommendation.
References
- Abay GM, Thangavel S, Woubit D. Evaluation of faba bean cultivars, fungicides and bio-control agents for the management of chocolate spot (Botrytis fabae Sard.) disease in Kellem Wollega, Western Oromiya, Ethiopia. J Biol Bio Health Care. 2017;7:15-31
- Beyene AT. Genetic analysis and characterization of faba bean (Vicia faba) for resistance to chocolate spot (Botrytis fabae) disease and yield in the Ethiopian highlands (Doctoral dissertation). 2014.
- Biruk B. Production and marketing activity of broad bean in Ethiopia. Ethiopian Community Exchange Authority Report. 2009:10-11.
- Bouhassan A, Sadiki M, Tivoli B. Evaluation of a collection of faba bean (Vicia faba L.) genotypes originating from the Maghreb for resistance to chocolate spot (Botrytis fabae) by assessment in the field and laboratory. Euphotic. 2004; 135(1):55-62.
- Campbell CL, Madden LV. Introduction to plant disease epidemiology.1990.
- CIMMYT Economics Program. From agronomic data to farmer recommendations: an economics training manual. CIMMYT;1988.
- Ababa A. Ethiopia Demographic and Health Survey 2005 Central Statistical Agency. 2006.
- Kora D, Hussein T, Ahmed S. Epidemiology of chocolate spot (Botrytis fabae Sard.) on faba bean (Vicia faba L.) in the Highlands of Bale, Sinana district, Southeastern Ethiopia. Glob J Pest Dis Crop Prot. 2016;4(1):131-138.
- Kora D, Hussein T, Ahmed S. Management of chocolate spot (Botrytis fabae L.) on faba bean in Bale Highland’s, Ethiopia. J Plant Sci. 2017;7(1):120-129.
- Gorfu D, Hiskias Y. Yield losses of crops due to plant diseases in Ethiopia. PMJOE. 2001;5:55-67.
- Elad Y, Williamson B, Tudzynski P, Delen N, Editors. Botrytis: biology, pathology and control. Springer Science and Business Media; 2004.
- Teshome E, Tagegn A. Integrated management of Chocolate spot (Botrytis fabae sard.) of Faba bean (Vicia faba L.) at highlands of Bale, south eastern Ethiopia. Res J Agric Environ Manag. 2013; 2(1):011-014.
- Tamiru G. Study on prevalence and importance of faba bean diseases in Sidama and Gedeo Highlands, South Eastern Ethiopia. Int J Pure Agric Adv. 2017;1(1):24-29.
- Eshetu G, Bimrew Y, Shifa H. Association of chocolate spot and faba bean rust epidemics with climate change resilient cultural practices in Bale Highlands, Ethiopia. Adv Agric. 2018;2018:1-3.
- Gomez KA, Gomez AA. Statistical procedures for agricultural research. John wiley and sons; 1984.
- Ebbersten S. ICARDA (International Center for Agricultural Research in the Dry Areas). 1983.
- Haile M. Severity of Chocolate Spot Disease on Faba Bean (Vicia faba L) and Characterization of Botrytis fabae Isolates in Southwest Ethiopia. 2018.
- Mitiku M. Integrated management of chocolate spot (Botrytis fabae) disease of faba bean (Vicia faba L.) In Ethiopia. Int J Res. 2017;5(9):194-205.
- Mussa J, Dereje G, Gemechu K. Procedures of faba bean improvement through hybridization. Technical Manual. 2008(21):48.
- Puspitasari W. Association analyses to genetically study reproduction and seed quality features of faba bean (Vicia faba L.) (Doctoral dissertation). 2017.
- Sahile S. The epidemiology and management options of chocolate spot disease (Botrytis fabae Sard.) on faba bean (Vicia faba L.) in Northern Ethiopia. A PhD (Doctoral dissertation, Dissertation, Haramaya University, Haramaya, Ethiopia). 2008.
- Sahile S, Fininsa C, Sakhuja PK, Ahmed S. Effect of mixed cropping and fungicides on chocolate spot (Botrytis fabae) of faba bean (Vicia faba) in Ethiopia. Crop Prot. 2008; 27(2):275-282.
- Sahile S, Ahmed S, Fininsa C, Abang MM, Sakhuja PK. Survey of chocolate spot (Botrytis fabae) disease of faba bean (Vicia faba L.) and assessment of factors influencing disease epidemics in northern Ethiopia. Crop Prot. 2008;27(11):1457-1463.
- Sahile S, Fininsa C, Sakhuja PK, Ahmed S. Yield loss of faba bean (Vicia faba) due to chocolate spot (Botrytis fabae) in sole and mixed cropping systems in Ethiopia. Arch Phytopathol Plant Prot. 2010 Aug 1;43(12):1144-1159.
- Sahile S, Abang MM, Fininsa C, Ahmed S, Sakhuja PK, Baum M. Pathogenic and genetic diversity of Botrytis fabae Sand. isolates from faba bean fields in different agro-ecological zones of Northern Ethiopia. Arch Phytopathol Plant Prot.2012; 45(10):1218-1236.
- Shahzad MA, Wasi-ud-Din WU, Sahi ST, Khan MM, Ehsanullah E, Maqsood Ahmad MA. Effect of sowing dates and seed treatment on grain yield and quality of wheat. 2007.
Citation: Atnafu D, Jemal A, Azmeraw Y (2025) Management of Chocolate Spot (Botrytis fabae L.) of Faba Bean (Vicia faba L.) Using Host Resistance and Fungicide Spray Frequencies in Dabat District, North Western Ethiopia. J Plant Pathol Microbiol. 16:716.
Copyright: © 2025 Atnafu D, et al. This is an open-access article distributed under the terms of the Creative Commons Attribution License, which permits unrestricted use, distribution, and reproduction in any medium, provided the original author and source are credited.