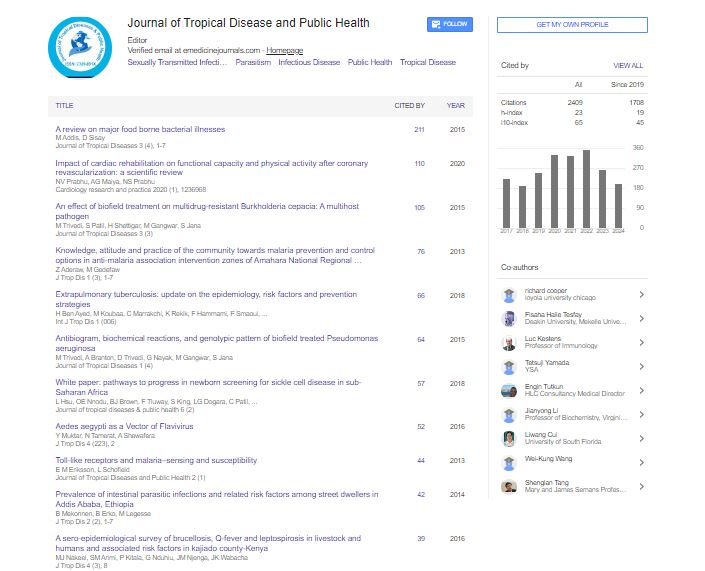

Indexed In
- Open J Gate
- Academic Keys
- ResearchBible
- China National Knowledge Infrastructure (CNKI)
- Centre for Agriculture and Biosciences International (CABI)
- RefSeek
- Hamdard University
- EBSCO A-Z
- OCLC- WorldCat
- CABI full text
- Publons
- Geneva Foundation for Medical Education and Research
- Google Scholar
Useful Links
Share This Page
Journal Flyer
Open Access Journals
- Agri and Aquaculture
- Biochemistry
- Bioinformatics & Systems Biology
- Business & Management
- Chemistry
- Clinical Sciences
- Engineering
- Food & Nutrition
- General Science
- Genetics & Molecular Biology
- Immunology & Microbiology
- Medical Sciences
- Neuroscience & Psychology
- Nursing & Health Care
- Pharmaceutical Sciences
Research Article - (2021) Volume 9, Issue 3
Magnitude of Anemia and Socio Demographic Factors Associated With It Among Adults Age 15-49 Years In Ethiopia: A Population Based Study Using The 2016 Demographic and Health Survey Data
Kaleab Tesfaye Tegegne1*, Abiyu Ayalew Assefa1, Eleni Tesfaye Tegegne2 and Mekibib Kassa Tessema32School of Nursing College of Medicine and Health Science, University of Gondar, Gondar, Ethiopia
3Leishmania Research and Treatment Center, University of Gondar, Gondar, Ethiopia
Received: 10-Feb-2021 Published: 25-Mar-2021, DOI: 10.35248/2329-891X.21.9.275
Abstract
Background: According to World Health Organization (WHO); anemia considered as a major public threat when prevalence was greater than 40%, a moderate public threat from 20-40%, and as a mild threat from 5-20%. This study aims to assess the prevalence of anemia and its associated socio demographic factors among adults age 15-49 years in Ethiopia.
Methods: Demographic and Health Surveys in 2016, in Ethiopia were analyzed in SPSS, using multivariate logistic regression. Socio demographic variables were selected based on their availability in the dataset.
Results: Of the total sample of 27289 of men and women 15-49 years at the time of survey, 19.8 % (n = 5078) anemia. Men and women 15-49 years living in rural areas 0.029 (AOR 0.029 ; 95% CI:0.018-0.048) ,men and women age living in afar region 0.821 (AOR 0.821; 95% CI: 0.725--0.929) , men and women who are in lowest wealth quintile 1.255 (AOR 1.255; 95% CI: 1.091-1.445) and an increase in one-year in age 9.952 (95% CI 6.2 to 16.1) were found significant predictors of anemia.
Conclusions: The magnitude of anemia in the current study was found to be a mild public health problem. Rural residence, low wealth quartile and old age were predictors of anemia among adults Age 15-49 years. There is significant urban-rural difference in anemia prevalence, indicating the need for targeting specific areas for intervention.
Keywords
Anemia; EDHS; Socio demographic; Ethiopia
Abbreviations and Acronyms
AOR: Adjusted Odds Ratios; COR: Crude Odds Ratios; EDHS: Ethiopian Demographic and Health Survey; ICF: Inner City Fund; SNNPR: Southern Nations Nationalities and Peoples’ Region; SPSS: Statistical Software; UNICEF: United Nations International Children’s Emergency Fund; WHO: World Health Organization
Introduction
Anemia is defined as a condition in which there is less than the normal hemoglobin level in the body, which decreases oxygencarrying capacity of red blood cells to tissues. Anemia is more common in developing countries because of poor nutritional status and high prevalence of parasitic infestation [1].
According to World Health Organization (WHO) anemia considered as a major public threat when prevalence was greater than 40%, as a moderate public threat when prevalence was from 20%-40%, and as a mild threat when prevalence was from 5%-20% [2]. Globally, anemia affects over a quarter of the world population [3,4].
The highest prevalence of anemia exists in the developing world its causes are multi-factorial. Anemia is responsible for significant morbidity and mortality [5,6]. A study in Uganda reported a prevalence of 16.8 to 33.8% anemia in adult men and women [7]. Another study also reported anemia, 12.5% in males and 13.2% in females in South Africa [8] and 23% prevalence in Zimbabwe [9]. A study from Ghana reported a 53.2% prevalence of anemia in non-pregnant women [10]. Similar studies have been reported in Ethiopia, 17% to 52.3% prevalence of anemia [11-13]. In addition, data from WHO indicated that prevalence of anemia among nonpregnant women in Ethiopia was 23.3% as of 2016. Its highest value over the past 26 years was 47.50% in 1990, while its lowest value was 21.40% in 2012 [14]. Prevention and control of anemia is important to reduce its consequences [15,16].
The magnitude of the different types of anemia and its severity have not yet well documented in Ethiopia [13,17]. Therefore, additional studies on anemia are required to produce national data. The majority of researches regarding anemia has been focused on children, adolescents and pregnant women and almost all of them are Institution based studies [18]. However, assessing anemia among apparently healthy adults through communitybased studies is essential. Therefore, the aim of this study was to assess the prevalence of anemia and its associated factors among adults age 15-49 years in Ethiopia.
Methods
Data source, sampling and data collection
The data for this study was extracted from the 2016 EDHS. The 2016 EDHS is the fourth and most recent in the Demographic and Health Survey series in Ethiopia. The survey was conducted in nine regional states and two city administrations of Ethiopia. Further details on sampling strategy can be found in the DHS manual [19].
A total of 16,583 eligible women and 11,606 eligible men between 15 and 49 years were approached to be interviewed. A response rate of 95% was observed with 15,683 women completing the interviews and response rate 86% among 11,606 men interviewed. The interviews included several standard questionnaires recording information ranging from basic socio-demographic information to detailed bio-medical information. Our analysis included all men and women age 15-49 years which resulted in a total weighted sample of 27,289.
Outcome variable
We used any Anemia as the outcome variable using the recommended definition as Anemia status by hemoglobin level for women 15-49 years age Not pregnant <12.0 g/dl, Pregnant <11.0 g/dl and for men 15-49 years age <13.0 g/dl (1 if the people have anemia 0 otherwise).
Co-variates
The basic socio-demographic variables were selected based on their availability in the dataset The included basic socio-demographic factors are highest education level (categorized as “no education”, “primary”, “secondary”, “more than secondary ”) and working status in the past 12 months (“not working” or “working and occupation status (“not working”, “non-agriculture” and “agriculture”), marital status (“never married”, “currently married”, “Living together”, “Divorced/separated” and “Widowed”) age (“15-19 years”, “20- 24 years”, “25-29 years” 30-34 years” “35-39 years” “40-45 years” and “45-49 years”) and mothers exposure to mass media (“no” or “yes”). Number of living children (“1”, “1-2”, “3-4” and “5+”), Literacy (“Cannot read at all”, “Can read part/whole sentence” and “Other”). Household factors included household wealth index (categorized as “poorest”, “poorer”, “middle”, “richer” and “richest”).
The household wealth index was calculated using scores based on household assets with analyses conducted by the National Population Commission and Inner City Fund (ICF) International based on a methodology developed from previous DHSs [20,21] and using methods recommended by the World Bank Poverty Network and United Nations International Children’s Emergency Fund (UNICEF) [22].
Community level factors recorded were the place of residence (“rural” or “urban”) and geographical region.
The geographical regions were grouped into nine regional states of Ethiopia; namely Afar, Amhara, Benishangul-Gumuz, Gambella, Harari, Oromia, Somali, Southern Nations Nationalities and Peoples’ Region (SNNP), and Tigray, and two city administrations named Addis Ababa and Dire Dawa [19].
Statistical analysis
Sampling weights provided with the EDHS dataset were used during analysis. Further details on sample weights can be found in the EDHS report [19]. Descriptive statistics were employed to show the distribution of background characteristics. We used logistic regression model to determine the true association between anemia and basic socio-demographic factors. Both unadjusted and adjusted odds/ratios (ORs) were reported with 95% confidence intervals (95% CI). Besides, diagnostic tests were done, particularly goodness of fit of the model by the Hosmer and Lemeshow test; (where p-value of 1.00 was found), The Cronbach’s alpha result of the variables is 0.889 The Nagelkerke R Square shows that about 70.6% of the variation in the outcome variable (Anemia) is explained by this logistic model. The overall accuracy of this model to predict subjects having Anemia (with a predicted probability of 0.5 or greater) is 88.4%. All analyses were performed using statistical software SPSS (Version 16.0).
Results
Baseline characteristics
Of the total sample of 27289 of men and women 15-49 years at the time of survey, 19.8% (n=5078) have anemia (Table 1).
Table 1: Socio demographic characteristics of men and women age 15-49 years according to Anemia, Ethiopia 2016.
| Characterstics | Overall (n=25653) | Anemia | |
|---|---|---|---|
| N (%) | Yes (n-5078) | No (n-20575) | |
| Age | |||
| 15-19 | 5953 (23.2%) | 3381 (66.6%) | 2572 (12.5%) |
| 20-24 | 4645 (18.1%) | 1697 (33.4%) | 2948 (14.3%) |
| Residence | |||
| Urban | 5779 (22.5%) | 3476 (68.5%) | 2303 (11.2%) |
| Rural | 19874 (77.5%) | 1602 (31.5%) | 18272 (88.8%) |
| Region | |||
| Tigray | 1837 (7.2%) | 1129 (22.2%) | 708 (3.4%) |
| Affar | 210 (8%) | 128 (2.5%) | 82 (4%) |
| Amhara | 628 (25.8%) | 3714 (73.1%) | 2914 (14.2%) |
| Oromiya | 10110 (39.4%) | 107 (2.1%) | 10003 (48.6%) |
| Wealth quintile | |||
| Lowest | 4472 (17.4%) | 2633(51.9%) | 1839 (8.9%) |
| Second | 4927 (19.2%) | 2445 (48.1%) | 2482(12.1%) |
| Marital status | |||
| Never married | 8918 (34.8%) | 4036 (79.5%) | 4882 (23.7%) |
| Married | 15103 (58.9%) | 1042 (20.5%) | 14061 (68.3%) |
As summarized in Table 2, majority (57.5%) of the respondents were female and a predominant percentage of the men and women 15-49 years lived in rural areas (78.8%), respondatns in the regions of Oromiya were (37.1%) and Amhara (24.3%). 32.1% of men and women 15-49 years reported not working in the past 12 months at the time of survey, and 39.2% did not have any formal education. In addition to education status, around 45.9% of men and women 15-49 years reported having poor literacy skills and could not read at all (Table 2).
Table 2: Individual, household and community level characteristics of men and women 15-49 years, Ethiopia 2016.
| Socio-demographic factors | N (%) |
|---|---|
| SEX | |
| Male | 11606(42.5%) |
| Female | 15683(57.5%) |
| Wealth index | |
| Lowest | 4472(16.4%) |
| Second | 4927(18.1%) |
| Middle | 5224(19.1%) |
| Fourth | 5566(20.4%) |
| Highest | 7098(26.0%) |
| Residence | |
| Urban | 5779(21.2%) |
| Rural | 21509(78.8%) |
| Age category | |
| 15-19 | 5953 (21.8%) |
| 20-24 | 4645 (17.0 %) |
| 25-29 | 4934 (18.1%) |
| 30-34 | 3980(14.6%) |
| 35-39 | 3318(12.2%) |
| 40-44 | 2496(9.1%) |
| 45-49 | 1961(7.2%) |
| Religion | |
| Orthodox | 11946(43.8%) |
| working status (past 12 months) | |
| Working | 18518(67.9%) |
| Marital status | |
| Married | 16059(58.9%) |
| Literacy | |
| Cannot read at all | 12530(45.9%) |
| Number of living children | |
| 0 | 10843(39.7%) |
| 1-2 | 5972(21.9%) |
| 3-4 | 4834(17.7%) |
| >5 | 5640 (20.7%) |
| Frequency of reading newspaper | |
| Yes | 1703(6.2%) |
| No | 25586(93.8%) |
| Frequency of listening to the radio | |
| Yes | 5919(21.7%) |
| No | 21370(78.3%) |
| Frequency of watching TV | |
| Yes | 4938(18.1%) |
| No | 22351(81.9%) |
| Region | |
| Tigray | 1837(6.7%) |
| Afar | 210(0.8%) |
| Amhara | 6628 (24.3%) |
| Oromiya | 10110(37.1%) |
| Somali | 760(2.8%) |
| Benishangul-Gumuz | 278(1.0%) |
| SNNPR | 5659(20.7%) |
| Gambela | 79 (0.3%) |
| Harari | 67(0.2%) |
| Addis Ababa | 1503(5.5%) |
| Dire Dawa | 156(0.6%) |
| Occupation | |
| Not working | 8746(32.0%) |
| Non-agriculture | 7669(28.1%) |
| Agriculture | 10874(39.8%) |
| Educational Status | |
| No education | 10701(39.2%) |
| Primary | 11098(40.7%) |
| Secondary | 3602(13.2%) |
| More than secondary | 1887(6.9%) |
| N | 27289 |
Majorities (39.8%) of the respondent’s occupation were agriculture, 28.1% were non agriculture employee in addition, and 43.8% of the respondents were orthodox religion followers. In terms of men and women 15-49 years age, overall 21.8% of men and women were between 15 and 19 years of age.
Most men and women 15-49 years (58.9%) reported as currently married at the time of the survey. Of the total, only 16.4% were in lowest wealth quintile and 26.0% were in the highest wealth quintile. In terms of the number of living children, about 39.7% of men and women 15-49 years reported to have one living children and 20.7% had more than 5 number of living children during survey. Regarding exposure to mass media, 6.2% read newsletter, 18.1% watch to TV and 21.7% listen to radio.
Multivariable analysis
As expected, men and women 15-49 years who are in lowest wealth quintile had 25% (AOR 1.255; 95% CI: 1.091-1.445) higher odds of having anemia. In addition, residence they live had significant association with men and women 15-49 years living in rural areas having 97% reduced odds of anemia (AOR 0.029; 95% CI:0.018- 0.048) compared to men and women 15-49 years who had live in urban areas.
Demographically, since age is a quantitative numerical variable, an increase in one-year in age has 9.952 (95% CI 6.2 to 16.1) times decrease in odds of having Anemia. Odds of anemia among men and women age 15-49 years in afar region decreased by 18% ( AOR 0.821; 95% CI: 0.725-0.929) compared to men and women age 15- 49 years residing in Tigray region. Table 3 shows unadjusted and Adjusted Odds Ratios (AOR) that were calculated to determine the strength of association between the co-variates and anemia (Table 3).
Table 3: Unadjusted and adjusted Odds Ratio for Anemia in Ethiopia 2016.
| Charecteristics | Unadjusted | Adjusted | ||
|---|---|---|---|---|
| COR (95%CI) | p value | AOR (95%CI) | p value | |
| Age | 0.178(0.169 , 0.188) | 0 | 9.952(6.156, 16.091) | 0 |
| Residence | ||||
| Urban | 1 | - | - | - |
| Rural | 0.058(0.054--0.063) | 0 | 0 .029 (0.018-0.048) | 0 |
| Region | ||||
| Tigray | 0.979 ( 0.730- 1.312) | 0.886 | 0.979 (0.730-1.312) | 0.886 |
| Afar | 0.799 (0 .719- 0.888) | 0 | 0.821( 0.725-0.929) | 0.002 |
| Amhara | 0 .007 (0.005-0.008 ) | 0 | not Retained in model | - |
| Wealth quintile | ||||
| Lowest | 0.688 (0 .634- 0 747) | 0 | 1.255(1.091-1.445) | 0 .002 |
| Second | 1 | - | - | - |
| Marital Status | ||||
| Never married | 0.090 (0 .083-0.097) | 0 | not Retained in the model | - |
| Married | 1 | - | - | - |
Backward stepwise model with dichotomous outcome of (0=no anemia; 1=anemia), CI: Confidence Intervals, 1: Reference Category
Discussion
The overall magnitude of anemia was found to be 19.8% (n=5078) and, this, is, lower, compared, to, previous, studies, 26.2%, 31.0% a study conducted in Gondar, North West Ethiopia (22.4%) and a study conducted in South Africa (25.8%), Arba Minch (52.3%), Dire Dawa (41.2%) and Tikur Anbessa Specialized Hospital (34.6%) [23-29].
It was also lower than the findings of studies conducted in other sub-Saharan countries: Nigeria (67%), Benin City, Nigeria (60.16%) and Tanzania (70.7%) [30-32]. Previous global estimates made by DeMaeyer in 1985 indicated that approximately 30% of the world’s population was anemic [33].
Globally, anaemia affects 1.62 billion people which correspond to 24.8% of the population prevalence in men (12.7%). The prevalence of anemia was 27.4% [34-35].
A recent study by Umeta et al. also documented a comparable prevalence of 30.4%. This figure is higher than the 2002 estimate of UNICEF (17.4%) and what has been documented by Hayder et al. (18.4%) in 1999. The overall prevalence of anemia was 40.9 % study done in Egypt (39%) [36-40].
The findings over the decade did not witness tangible progress in the reduction of anemia in Ethiopia. However, the magnitude found in the current study was higher than in studies conducted at Hawassa Referral Hospital (12.0%), Jimma University Hospital (16.2%), and Ras Desta Damtew Memorial Hospital (2.85%) and in Malawi (16.2%) the findings from The People's Republic of China (13.4%), Serbia (7.7%), and Korea (8.4%) [41-47]. Variations in the methods employed, and a larger proportion of nationally representative data, are more likely to account for the differences between these estimates. The differences in the magnitude of anemia may be explained by differences in the study time, study area. Demographically, since age is a quantitative numerical variable, an increase in one-year in age has 9.952 (95% CI 6.2 to 16.1) times decrease in odds of having Anemia.
Studies in Ethiopia and Tanzania reported higher prevalence in older age groups, studies in Tanzania (50) Nigeria and India failed to witness any association [48-52].
As expected, men and women 15-49 years who are in lowest wealth quintile had 25% (AOR 1.255; 95% CI; 1.091-1.445) higher odds of having anemia.
Regarding other socio-demographic factors, being from lower economic and education category, and living in rural areas were identified as predisposing factors to anemia. Hence, empowering women in terms of education and economic status would have positive contributions to avert the problem [53].
In addition, residence they live had significant association with men and women 15-49 years living in rural areas having 97% reduced odds of anemia (AOR 0.029; 95% CI: 0.018-0.048) compared to men and women 15-49 years who had live in urban areas. Odds of anemia among men and women age 15-49 years in afar region decreased by 18% ( AOR 0.821; 95% CI: 0.725-0.929) compared to men and women age 15-49 years residing in Tigray region. Anemia prevalence was 20.1% among, urban and 46.6% among rural residents [39].
This observed, high prevalence of anemia among urban residents was similar to the finding from the Ethiopian demographic and health survey 2011, 31% for rural and 16% for, urban. However, this, finding was inconsistent with a study done in central and eastern China, where the, finding was almost the same, 13.6% in urban and 13.3%, in rural areas [54-55].
The possible reasons might be due to low socioeconomic status, low serving of iron-rich, foods, lack of adequate nutrition information and, a high number of illiterates in urban areas as compared, to rural in this study.
Conclusions
The magnitude of anemia in the current study was found to be a mild public health problem. Rural residence, low wealth quartile and old age were predictors of anemia among adults Age 15- 49 years. There is significant urban-rural difference in anemia prevalence, indicating the need for targeting specific areas for intervention. Therefore, it is recommended that educational empowerment, nutrition education and nutrition service have a positive contribution in combating anemia in Ethiopia , especially in Urban areas.
Acknowledgement
We are grateful to Measure DHS, ICF International Rockville, Maryland, USA for providing the 2016 EDHS data for this analysis.
Ethics Approval and Consent to Participate
This study is a secondary data analysis of the EDHS, which is publicly available, approval was sought from MEASURE DHS/ICF International and permission was granted for this use. The original DHS data were collected in conformity with international and national ethical guidelines. Ethical clearance was provided by the Ethiopian Public Health Institute (EPHI) (formerly the Ethiopian Health and Nutrition Research Institute (EHNRI).
Review Board, the National Research Ethics Review Committee (NRERC) at the Ministry of Science and Technology, the Institutional Review Board of ICF International, and the United States Centers for Disease Control and Prevention (CDC). Written consent was obtained from respondents and data were recorded anonymously at the time of data collection during the EDHS 2016.
Availability of Supporting Data
The survey datasets used in this study was based on publicly available dataset that is freely available online with no participant’s identity from http://www.dhsprogram.com/data/available-datasets.cfm. Approval was sought from MEASURE DHS/ICF International and permission was granted for this use.
Conflicts of Interest
The authors declare that they have no conflicts of interest.
Authors Contributions
Abiyu Ayalew Assefa, Kaleab Tesfaye Tegegne, Eleni Tesfaye Tegegne, and Mekibib Kassa Tessema were involved in formatting the research question. Kaleab Tesfaye Tegegne performed the analysis with assistance from Abiyu Ayalew Assefa, Eleni Tesfaye Tegegne and Mekibib Kassa Tessema. All authors prepared the initial draft of the manuscript. Eleni Tesfaye Tegegne and Kaleab Tesfaye Tegegne critically revised the manuscript for intellectual content. All authors approved the final version of the manuscript.
Funding
This study did not receive any funding from any organization.
REFERENCES
- Allen LH. Anemia and iron deficiency: Effects on pregnancy outcome. Am J Clin Nutr. 2000;71:1280S-12804S.
- Ethiopia Demographic and Health Survey 2011. Central Statistical Agency Addis Ababa, Ethiopia. 2011.
- McLean E, Cogswell M, Egli I, Wojdyla D, de Benoist B. Worldwide prevalence of anaemia, WHO vitamin and mineral nutrition information system, 1993-2005. Public Health Nutr. 2009;12:444-454.
- Pasricha SR. Anemia: A comprehensive global estimate. Blood. 2014;123:611-612.
- Tolentino K, Friedman JF. An update on anemia in less developed countries. Am J Trop Med Hyg. 2007;77:44-51.
- Prasanth R. Prevalence of anemia in both developing and developed countries around the world. World J Anemia. 2017;1:40-43.
- Mugisha JO, Baisley K, Asiki G, Seeley J, Kuper H. Prevalence, types, risk factors and clinical correlates of Anaemia in older people in a rural Ugandan population. PLoS One. 2013;8: e78394.
- Oldewage-Theron WH, Samuel F, Grobler C, Egal A. Anaemia prevalence and dietary intake of elderly persons living in a peri-urban settlement in South Africa. J Family Ecol Consum Sci. 2008;36:22-29.
- Allain TJ, Gomo Z, Wilson AO, Ndemera B, Adamchak DJ, et al. Anaemia, macrocytosis, vitamin B-12 and folate levels in elderly Zimbabweans. Cent Afr J Med. 1997;43:325-327.
- Samuel TCK, Agboli E, Hoffman H, Walana W. Malaria and anemia in pregnant and non-pregnant women of child-bearing age at the university hospital, Kumasi, Ghana. Open J Med Microbiol. 2013;3:1-3
- WHO/CDC. Worldwide Prevalence of Anemia. Switzerland: WHO Global Database on Anemia, World Health Organization, Geneva; 2008.
- Central Statistical Agency and ICF Macro, Ethiopia. Demographic and Health Survey Preliminary Report, Central Statistical Agency, Addis Ababa, Ethiopia. ICF Macro, Calverton, Md, USA. 2011.
- Haidar J. Prevalence of anaemia deficiencies of iron and folic acid and their determinants in Ethiopian women. J Health Popul Nutr. 2010;28:359-368.
- World Health Organization, Global Health Observatory Data Repository/World Health Statistics.
- Iron deficiency anaemia WHO/UNICEF/UNU. Assessment, prevention, and control. Geneva: World Health Organization. 2001
- WHO, UNICEF, UNU. Iron deficiency Anaemia: Assessment, prevention and control. A Guide for Programme Managers, WHO, UNICEF, UNU, Geneva, Switzerland. 2001.
- Betelihem T, Asaye B, Paulos N, Aster T. Effect of maternal iron deficiency anemia on the iron store of newborns in Ethiopia. Anemia. 2015;15:1-6.
- Gebremedhin S, Fikre E. Correlates of anemia among women of reproductive age in Ethiopia: Evidence from Ethiopian DHS 2005. Ethiop J Health Dev. 2011;25:1-9.
- Central Statistical Agency (CSA) and ICF. 2016 Ethiopia Demographic and Health Survey Key Findings. 2017.
- Central Statistical Authority/Ethiopia and ORC Macro. Ethiopia Demographic and Health Survey 2000. Addis Ababa, Ethiopia. 2001.
- Central Statistical Authority/Ethiopia and ORC Macro. Ethiopia Demographic and Health Survey 2005. Addis Ababa, Ethiopia. 2006.
- Filmer D, Pritchett L. Estimating wealth effects without expenditure data or tears: An application to educational enrollments in states of India. Demography. 2001;38:115-132.
- Mengistu A, Egata G, Hawulte B, Markos M, Lolaso T. Anemia and associated factors among adults with Human Immune Deficiency Virus on antiretroviral therapy in public health facilities of Kembata Tembaro Zone, Southern Ethiopia: A cross-sectional study. HIV AIDS. 2020;12:341-349.
- Negesse A, Getaneh T, Temesgen H, Taddege T, Jara D, Abebaw Z. Prevalence of anemia and its associated factors in human immuno deficiency virus infected adult individuals in Ethiopia: A systematic review and meta-analysis. BMC Hematol. 2018;18:1-10.
- Alem M, Kena T, Baye N, Ahmed R, Tilahun S. Prevalence of anemia and associated risk factors among adult HIV patients at the anti-retroviral therapy clinic at the University of Gondar Hospital, Gondar, Northwest Ethiopia. Open Access Sci Rep. 2013;2:1-5.
- Simbarashe TM, Brennan AT, IanSanne A. Anemia among HIV-infected patients initiating antiretroviral therapy in South Africa: Improvement in hemoglobin regardless of degree of immunosuppression and the initiating ART regimen. J Trop Med. 2013;26:1-6.
- Melese H, Mesele M, Tadesse A. Anemia among adult HIV patients in Ethiopia: A hospital-based cross-sectional study. Dove Press. 2016;2017:25-30.
- Geleta D, Gudina E, Demissie B, Birhanu S. Prevalence of anemia and associated factors among phivs attendants antiretroviral therapy clinics in public health institutions in Dire Dawa Town, East Ethiopia. J Med Physiol Biophys. 2016;22:1-8.
- Bizuwork K, Bedada T. Factors associated with anemia among people living with HIV/AIDS taking ART in Ethiopia. Hindawi. 2019;19:1-8.
- Pennap GR, Abubakar K. Prevalence of anemia among human immunodeficiency virus infected patients accessing healthcare in federal medical center Keffi. Nigeria Int J Trop Dis Health. 2015;10:1-7.
- Omregie R, Omokaro EU, Palmer O, Ogefere HO, Egbeobauwaye A, Adegheet JE, et al. Prevalence of anaemia among HIV-infected patients in Benin City, Nigeria. Tanzan J Health Res. 2009;11:1-4.
- Daniel W, Kilonzo SB, Mpondo BC. Magnitude and correlates of moderate to severe anemia among adult HIV patients receiving first line HAART in Northwestern Tanzania: A cross sectional clinic based study. Pan Afr Med J. 2016;23:1-26
- DeMaeyer E, Adiels-Tegman M. The prevalence of anaemia in the world. World Health Stat Q. 1985;38:302-316.
- Benoist B. Worldwide prevalence of anemia 1993-2005. WHO Global database on anaemia. 2008.
- Gebremedhin S, Fikre E. Correlates of anemia among women of reproductive age in Ethiopia: Evidence from Ethiopian DHS 2005. Ethiop J Health Dev. 2011;25:1-9.
- Umeta M, Haidar J, Demissie T, Akalu G, Ayana G. Iron deficiency anemia among women of reproductive age in nine administrative regions of Ethiopia. Ethiop J Health Dev. 2008;22:252-258.
- United Nations Development Program Emergency Unit for Ethiopia. Primary health Care in Ethiopia. University of Pennsylvania. 2000.
- Haidar J, Nekatibeb H, Urga K. Iron deficiency anemia in pregnant and lactating mothers in rural Ethiopia. East Afri Med J 1999;76:618-622.
- Tesfaye TS, Tessema F, Habtemu J. Prevalence of anemia and associated factors among “Apparently Healthy” urban and rural residents in Ethiopia: A comparative cross-sectional study. J Blood Med. 2020;11: 89-96.
- Tawfik AS, Hanna ET, Abdel-maksoud AM. Anemia and iron deficiency anemia in Egypt. IOSR J Pharm. 2015;5:30-34.
- Daka D, Lelissa D, Amsalu A. Prevalence of anaemia before and after the initiation of antiretroviral therapy at ART centre of Hawassa University Referral Hospital, Hawassa. South Ethiopia Schol J Med. 2013;3:1-10.
- Gedefaw L, Yemane T, Sahlemariam Z, Yilma D. Anemia and risk factors in HAART Naive and HAART experienced HIV positive persons in Jimma South West Ethiopia: A Comparative Study. Plose One. 2013;8:1-6.
- Kenenisa C, Tsegaye A, Desta K. Prevalence of anemia before and after initiation of antiretroviral therapy on HIV infected patients at Ras Desta Damtew Memorial Hospital, Addis Ababa, Ethiopia. J Med Health Sci. 2018;7:22-30.
- Adamu AL, Crampin A, Kayuni N. Prevalence and risk factors for anemia severity and type in Malawian men and women: Urban and rural differences. Bio Med Central. 2017;15:12-19.
- Li L, Luo R, Sylvia S, Medina A, Rozelle S. The prevalence of anemia in Central and Eastern China: evidence from the China Healthand nutrition survey. Southeast Asian J Trop Med Public Health. 2015;46:306-321.
- Kolarovic J, Culafic J, Velibor C, Nada V. The incidence of anemia in the adult working population of Vojvodina. J med Biochem. 2014;33:14-24.
- Lee JO, Lee JH, Ahn S. Prevalence and risk factors for iron deficiency anemia in the Korean population: Results of the fifth Korea National Health and Nutrition Examination Survey. J Korean Med Sci. 2014;29:224-229.
- Haidar J, Pobocik R. Iron deficiency anemia is not a rare problem among women of reproductive ages in Ethiopia: A Community based cross-sectional study. BMC Blood Dis. 2009;9:1-10.
- Hinderaker SG, Olsen BE, Bergsjo P, Lie RT, Gasheka P, Kvale G. Anemia in pregnancy in the highlands of Tanzania. Acta Obstet Gynecol Scand. 2001;80:18-26.
- Massawe SN, Urassa EN, Nystrom L, Lindmark G. Anemia in women of reproductive age in Dar-essalaam, Tanzania. East Afri Med J. 2002;79:461-466.
- Dim CC, Onah HE. The prevalence of anemia among pregnant women at booking in Enugu, Southeastern Nigeria. Med Gen Med. 2007;9:11-19.
- Bentley ME, Griffiths PL. The burden of anemia among women in India. Eur J Clin Nutr. 2003;57:52-60.
- Gebremedhin S, Fikre E. Correlates of anemia among women of reproductive age in Ethiopia. Ethiop J Health Dev. 2011;25:1-19.
- Central Statistical Agency. Ethiopia Demographic and HealthSurvey. The Democratic Republic of Ethiopia. Central StatisticalAgency. 2012.
- Luo R, Sylvia S, Medina A, Rozelle S, Li L,. The prevalence of anemia in Central and Eastern China: evidence from the China Health and nutrition survey. J Trop Med Public Health. 2015;46:306-321.
Citation: Tegegne KT, Assefa AA, Tegegne ET, Tessema MK (2021) Magnitude of Anemia And Socio Demographic Factors Associated With It Among Adults Age 15-49 Years In Ethiopia: A Population Based Study Using The 2016 Demographic And Health Survey Data. J Trop Dis 9:275. doi: 10.35248/2329-891X.2021.9.275
Copyright: © 2021 Tegegne KT, et al. This is an open-access article distributed under the terms of the Creative Commons Attribution License, which permits unrestricted use, distribution, and reproduction in any medium, provided the original author and source are credited.