

Indexed In
- Open J Gate
- Genamics JournalSeek
- Academic Keys
- ResearchBible
- Cosmos IF
- Access to Global Online Research in Agriculture (AGORA)
- Electronic Journals Library
- RefSeek
- Directory of Research Journal Indexing (DRJI)
- Hamdard University
- EBSCO A-Z
- OCLC- WorldCat
- Scholarsteer
- SWB online catalog
- Virtual Library of Biology (vifabio)
- Publons
- Geneva Foundation for Medical Education and Research
- Euro Pub
- Google Scholar
Useful Links
Share This Page
Journal Flyer

Open Access Journals
- Agri and Aquaculture
- Biochemistry
- Bioinformatics & Systems Biology
- Business & Management
- Chemistry
- Clinical Sciences
- Engineering
- Food & Nutrition
- General Science
- Genetics & Molecular Biology
- Immunology & Microbiology
- Medical Sciences
- Neuroscience & Psychology
- Nursing & Health Care
- Pharmaceutical Sciences
Research Article - (2021) Volume 10, Issue 7
Irrigated rice area mapping over Bangladesh with remotely sensed data from 2001 to 2018
Md Rahedul Islam*Received: 01-Jul-2021 Published: 23-Jul-2021, DOI: 10.35248/2168-9881.21.10.213
Abstract
Spatial information on irrigated area is very important for crops water requirements, agricultural planning, water management, and climate changes mitigation. It is challenging to map irrigated rice areas by images classification methods due to the spectral similarity between with and without irrigation. In this study, we developed an index for potential irrigated rice area map for three different seasons by using remote sensing-based evapotranspiration (MOD16A2), precipitation (GSMaP) data from 2001 to 2018 and local climate adjusted CROPWAT based rice crop coefficient data. By using the index, classified the rice are withing three different types of irrigated area; (i) irrigated, (ii) rainfed and (iii) supplementary irrigated rice area for three different rice growing season of Bangladesh. The result compared with the National statistical and others relevant irrigated area data. It’s found, the dry season irrigated rice (Boro) area shows a good relationship with the national statistical data, but the wet seasons amon and aus irrigated rice areas shows comparatively low agreement.
Keywords
Crop water requirement; Evapotranspiration; Effective precipitation; Boro rice; Aus rice; Amon rice
Introduction
Background of the Study
Bangladesh is an agricultural country with a very high cropping intensity and diverse crop cultivating country. Almost, 70% of the territory dominant by agriculture land (World Bank, 2014). Bangladesh is the 4th largest per head rice consuming (500gm per per person) and rice producing country in the world (FAO, 2015). The rice is the dominant crop of the country and it covers three-fourths of all cropland area and contributes 70% of calories consumed [1].Rice is the staple food for more of the half of world population and rice production sector is the largest consumers of irrigational water [2]. Due to the drastic population growth (98 billion) growth need 70% more food (FAOSTAT, 2015) in 2050. But the arable land area of the country is even decreasing over time due to increasing demand for residential and industrial use [3]. Bangladesh also suffers from periodic natural calamities such as drought, flooding, and cyclones. Due to its location in a delta, climate change and associated sea level rise are expected to increase the risk for flooding and salinization of agricultural lands, especially near the southern coast [4,5]. The rice cultivated areas of Bangladesh is located low-land, flat and inundate areas and these areas are easily damaged by natural disaster likes floods, drought and storms. The rice cropping pattern of Bangladesh are mainly three types- Boro Rice in dry season, Amon and Aus rice in comparatively wet season. The Boro rice is the main rice production and it’s under fully irrigated condition. Due to the climate change and natural disaster during rainy season especially flood.
The drastic growth of world population is accelerated the pressure on global food supply [6,7]. With one of the largest populations in the world, mainly composed of rural inhabitants who depend on agriculture as their principal income source, the competition for land and water throughout Bangladesh is huge and expanding. Bangladesh agriculture is a striking symbol of the long-term land use changes that have taken place in recent decades in south Asia (Figure 1). The irrigation practices development leads green revolution and increased food production drastically. The Irrigation developments and yield improvement have been sustained by the construction of surface water use and shallow and deep tube-well irrigation pump also increased from 0.2 million to 10 million from 1985 to 2012. Currently, agriculture consumes more than 84% of the withdrawal groundwater (FAO, 2010).

Figure 1: The overall flowchart of the research methodology used in this study.
Irrigation expansion and technological development can meet the food scarcity [8], but there are limits of cultivated lands can offset the increase in food shortage in many regions but there are adverse and far reaching impacts on bio-diversity [9]. Irrigated agriculture, which currently shares ~40% of the global crop production, is an important contributor to augment world food production, especially in semi-arid and arid regions [10-12].
As a result, accurate information on irrigation extent, irrigation requirement and impacts of irrigation on environment are very important. There are a number of attempts have been taken for irrigation data set and irrigated mapping over the globe. The studies are mostly divided in to two categories – on the basis of scale, global and regional or national level; on the basis of data set- statistical data, model and simulation based and the spatial information or remote sensing based. Remote sensing is the most efficient and depended tools for the irrigated area mapping. The long-term phenology analysis, soil moisture and temperature analysis and the various indices analysis based remote sensing studies are becoming popular for irrigated area mapping. The global map of irrigated areas version 5 (GIMA5) used census-based statistics and produced irrigation equipped area with resolution of 5 arc-minutes from 2000 to 2008 [13]. The MIRCA also produced same data set on 2000 [13]. The GIMA used 500m remote sensing data and unsupervised classifier is the higher resolution map for world irrigation area [14]. The Global Rain-fed, Irrigated, and Paddy Croplands (GRIPC) map has the highest spatial resolution (500 m) among these four products [15]. These global studies are global scale and not effective for the local scale studies. The global data set does not represent the accurate irrigation data because the cropping pattern and irrigated area changing over the time. There are also a number of studies on local level, MODIS 500 m Spectral Matching Method in India [16-18], crop types and irrigation water use. We developed three irrigation potential indices by using the time series normalized difference vegetation index (NDVI) precipitation data and multitempral cloud free data [19]. Detection of Irrigated Crops from Sentinel-1 and Sentinel-2 Data to Estimate Seasonal Groundwater Use in South India. Most of the study are- phenology based, spectral matching, and spatial distribution. Moreover, there is very less significant irrigated area studies with remote sensing in Bangladesh.
Irrigated area mapping with remote sensing data is challenging due to the almost similar spectral reflectance from irrigated and non-irrigated rice phenology. Most of the case the irrigated area mapped based on the annual questionnaires survey, filed observation, interviews, expert opinion and statistical data. The statistical department of United Nations Food and Agriculture organization (FAOSTAT), country wise national census report used similar traditional method for irrigated and rainfed rice area mapping. The global map of irrigated area (GIMA5) used census based statistical data and produce irrigation equipped area with 5 arc-minutes resolution from 2000-2000.
Portmann, Siebert and Döll, (2010) evaluate the monthly global irrigated rainfed crop area (MIRCA2000) with national and sub-national level reported statistical data set for 26 crop classes in 2000. The result found that the rice paddy is the crop with largest harvested irrigated area, 33% of global crop production and 44% of total cereal production comes from irrigated agriculture. Similar types of dataset showed irrigated area increased 1990-2005 [20], but the statistical data, the crop types, growing season, local weather condition dynamic, existing crop condition are pay less attention. The satellite images based remote sensing application is one of the efficient tools for irrigated rice area mapping. There is a significant number of researchers have been conducted and still going on for irrigated rice area mapping with remotes sensing data over the globe. The long-term phenology analysis, soil moisture and temperature analysis, and the remote sensing based various indices analysis becoming popular for irrigated area mapping [5]. The global Rainfed, irrigated, and paddy croplands (GRIPC) with integrating the statistical surveys, gridded climatic and remote sensing dataset. The study used MODIS and associated dataset with supervised classification and found 66 M ha irrigated paddy rice area.
Another study on applied multiple remote sensing data AVHRR, MODIS NDVI, JERS SAR associated with climatic data, google earth, and intensive field information to estimate the Global irrigated area map (GIAM) [21]. With the phenology indices and ground truth data they used spectral matching techniques (SMTs) to estimate the irrigated area in terms of annual irrigated area and equipped for irrigated area. The result shows overall accuracy 79- 91% with the omission error does not exceed 21% and commission error less than 23%.
Ambika, Wardlow and Mishra, (2016) mapped high resolution irrigated area map from 2000 to 2015 over India with remotely sensed data. The study used 250 m spatial resolution MODIS Normalized Difference Vegetation Index (NDVI) dataset with the 56-land use land cover data for all agro-ecological zone in the study area. The result compared with the national statistical and ground survey data and found satisfactory accuracy with R2 value 0.95.
In regional scale stimate the irrigated and rainfed irrigated rice area with satellite data and intensive field data in Bangladesh. The study used MODIS 500-m and 8 days composite NDVI dataset with spectral matching techniques. The result compared with national and sub-national and statistical data and found very good agreement [15]. Similarly, the AQUACROP model, MODIS data, Landsat data with filed data and statistical data have been used for annual irrigated rice area mapping [22-24]. Most of the study have been conducted on the existing field condition, it’s didn’t consider the sources of irrigation and climatic conditions. In this study, we consider the vegetation condition, crop water requirement and sources of irrigation water [25].
Objectives
Irrigated area mapping for substantial year-to-year and seasonal variability in weather conditions complicates planning for water managers and agricultural producers and makes it difficult to apply standard rule-of-thumb approaches to agricultural water management. Hence, this study is an attempt to irrigated area mapping with long-term remote sensing data over Bangladesh. The main objectives of this study to map irrigated area over Bangladesh, along with asses the Alternative Wetting and Drying Irrigation technique. The objectives of the studies are-
(i) Estimated the irrigated area with climatic parameter,
(ii) Analysis the long-term and seasonal variation of irrigated area,
(iii) Comparison with relevant source of information.
Methodology
The methodology includes data clollection from remote sensing sources and other relavent sources of data, data analysis and presentation with table, graph and figure. The overall flowchart show in (Figure 1).
Data Use
The Moderate Resolution Imaging Spectroradiometer (MODIS) MOD16A2 data at 500 m spatial resolution, 8-day temporal resolution an atmospheric corrected data obtained from the United States Geological Survey database used for potential evapotranspiration estimation. The h26v06, h25v05 and h226v07 tiles covered the study area data from 2001-2018. The data originally recorded using sinusoidal projection in the hierarchical data format (HDF) were mosaicked, resized to the study area, and re-projected and resample into 1Km resolution on the geographical coordinate system using the Modis reprojection tool (MRT) algorithm. The monthly potential evapotranspiration (PET) extracted from the MOD16A2 8-day time composite data. The Global Satellite Mapping of Precipitation microwave (GSMaP) monthly data on 10 km Spatial resolution data used for monthly precipitation analysis (https://gportal.jaxa.jp/gpr/.). The precipitation data over the study area from 2001 to 2018 used to analysis the effective precipitation. The FAO CROPWAT software used for the crop water requirement estimation. The historical climatic data on precipitation, temperature, evapotranspiration data from CLIMWAT and Bangladesh Meteorological Department (BMD) have been used for this study. The statistical data on irrigated seasonal rice area were collected from Bangladesh Bureau of Statistics (BBS), FAOSTAT, and other reliable sources of reported data. Moreover, the literature review, published and unpublished data source from research organization, newspaper was used for the comparison and validation the result of this study.
CWR Assessment for Rice Paddy
The crop water requirement (CWR) refers the depth of water need for rice to meet the water loss through evapotranspiration (ET) of a disses free, available soil water and fertility condition in the growing environment and fully potential production. Generally, rice crop water requirement (RCWR) considered as continuously flooded (CF) rice RCWR. According to the FAO-56 guidelines followed for rice CWR of traditional cultivation [10], whereas
 (1)
(1)
Where, RCWR is the rice crop water requirement (mm), ET is monthly evapotranspiration (mm) and Kc is crop coefficient.
The equation-1 used for monthly CWR assessment of three different rice growing season of Bangladesh.
Evapotranspiration (ET) Estimation
The potential evapotranspiration calculated from MOD16A2 8 days composite 500m spatial resolution data. The reference evapotranspiration and potential evapotranspiration are different term but in rice cultivation condition without any water stress potential evapotranspiration is almost similar to reference evapotranspiration (Parvez and Inayathulla 2019). The potential evapotranspiration as reference evapotranspiration for flooded rice cultivation. The Moderate Resolution Imaging Spectrometer MOD16A2 version 6 Evapotranspiration with 8 days temporal and 500m spatial resolution data have been used for this study. The Penman-Monteith equation, which include inputs of daily meteorological reanalysis data along with MODIS vegetation properties dynamics, albedo, and land cover have been used in MOD16A2 algorithm [16]. The pixel values of MOD_ET layer is the sum of all eight days within the composite period. The data resampled and re-composite in monthly ET of each year from 2001-2018.
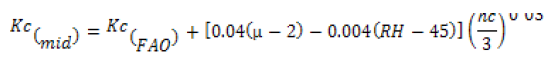
Crop Coefficient (Kc) Estimation
The crop coefficient (Kc) is the most important part of a crop water requirement assessment. The Kc is the ratio of potential evapotranspiration (ETc) of a crop and the reference evapotranspiration (ETo) in a disses free, water stress free, and fully potential growth condition of that crop. Generally, the crop coefficient estimated as follows
 (2)
(2)
Where, Kc = Crop co-efficient for rice, ETc is the potential evapotranspiration (ET) and ETo is the reference crop evapotranspiration.
The crop Kc value for the rice is depends on the growing period, water availability, climatic condition, and cultivation practices. The crop growing stages is very important for Kc estimation and it’s varied in different stage. In this study, the rice growing stages considered as (i) initial stage- 0 to 30 days after transplanting, (ii) midseason stage – 30 to 90 days after transplanting and (iii) late season stage – 90 to harvested days after transplanting. The FAO standard kc value for the initial, midseason and late season stage are 1.05, 1.20 and 0.95 respectively, in sub-tropical region (R. Allen 1998). But the kc value for rice crop varied for climatic condition differ from region to region. In this study, the local climatic condition evaluates with the meteorological data and used the following equation for local climate adjusted Kc value.
 (3)
(3)
 (4)
(4)
 (5)
(5)
Where,
Kc FAO value for K(ini) Kc(mid) and Kc(late) taken from FAO chart (1.05, 1.20 and 0.95 respectively),
u2 mean value for daily wind speed at 2 m height over grass during the late season growth stage (ms-1)
RH mean value for daily minimum relative humidity during the late season stage (%),
h is the mean plant height during the respective season stage (m)
Finally, based on the equitation-1, the monthly and seasonal (boro, aus and amon) CWR estimated from 2001 to 2018 over the Bangladesh.
Effective Precipitation Estimation
Effective precipitation is the portion of water from total precipitation used for rice crop water requirement. The total amount of precipitation could not be used for rice crop water requirement because of seepage loss, percolation loss, and run off loss. Global Satellite Mapping of Precipitation (GSMaP) monthly precipitation data with a 0.1 x 0.1-degree resolution have been used for effective precipitation estimation. GSMaP precipitation values are estimated using multi-band passive microwave and infrared radiometers from the GPM Core Observatory satellite and with the assistance of a constellation of other satellites (Shige et al. 2009). The monthly GSMaP data resampled into 1km and calculated the monthly effective precipitation for rice. There are several methods for effective precipitation estimation. In this study, we investigated FAO/AGLU, USDA S.C and FAO fixed ratio with 70%, 75% and 80% of total rainfall [18]. Based on the literature review, expert opinion, local climatic condition the fixed ratio method used for this study [19] . Moreover, we use sensitivity analysis for three different fixed (70%, 75% and 80%) case and fixed 75% for the effective precipitation estimation. The equation used as follows.
 (6)
(6)
Where, Tp is the total precipitation in mm and 0.75 used as fixed ratio for rice paddy in Bangladesh.
Irrigated Rice Area Mapping
Irrigation is the water supply from other than natural sources to meet up the crop water requirement for the crop growth and production fulfilment. The irrigated rice area is calculated by using the rice crop water demand as CWR and the supply of water for meet up the demand as irrigation. The rice crop cultivated under flooded condition and it’s need to continuous supply of water. The amount of water required for the rice growing season is refers as rice crop water requirement (RCWR). This required water for rice generally comes from two ways; i) natural means rainfall, ii) artificial means irrigation. If the rainfall is not enough for rice growing condition, then it’s need alternative sources of water which refers as irrigated. The CWR and sources of supply as effective precipitation, and potential irrigated or rainfed rice area determined as follows.
 (7)
(7)
Where, CWR is the rice crop water requirement (mm), Ep is the effective precipitation (mm).
If the crop water requirement is higher than the effective precipitation, the pixel considered as the irrigated area and lower means the rainfed area. On the base of Eq. (7), the irrigated and rainfed area mapped. In between the irrigated and rainfed area, considered the rice crop stress tolerate and uncertainty of estimation. Then, set a range of value and considered as supplementary irrigated area. The sensitivity analysis for the irrigated, supplementary irrigated and rainfed rice area conducted. Three different set of value assigned for the sensitiveness of the result and compared with the available data source to fix the value for the irrigation type fixation. This irrigated and rainfed area map overlay with the rice area map and finally calculated the irrigated, supplementary irrigated and rainfed rice area. The three different seasons (boro, aus and amon) irrigated and rainfed rice area are calculated and mapped from 2001 to 2018.
Comparison and Validation
The result from this chapter is compared with the national government, international organization reported data and relevant studies. The effective precipitation estimation result compared with the FAO, USDA, and Indian method estimation. The Kc and CWR result compare with the FAO CROPWAT estimation result and relevant studies. The estimate irrigated, supplementary irrigated and rainfed rice area result compare with the governmental reported statistical data, FAO AGUASTAT data and relevant reported studies.
Result
Crop Co-efficient Estimation Result
The crop coefficient (Kc) value for the rice depends on the growing period, water availability, climatic condition, and cultivation practices. The standard Kc values for rice varied from 1.05 in initial, 1.25 mid-season to 0.95 in late season in Bangladesh [47] for 140 days growing period(R. G. Allen et al. 1998). In this study evaluate the local climate influence and seasonal variation of Kc value and found 1.05, 1.22 and 0.96 for initial, midseason, and late season respectively, for boro rice growing season. In rainy season aus rice growing season the Kc estimated Kc value in initial stage is 1.05, mid-season stage 1.18 and late season stage 0.98. In case of amon season paddy rice Kc value are 1.05, 1.10 and 0.96 for the similar growth stage. (Figure 2) shows the FO guided, climate adjusted and AWD applied Kc vale for seasonal rice growth stages.

Figure 2: The FAO guided crop coefficient (kc) value and climate adjusted estimated Kc value for boro, aus and amon rice.
Effective Precipitation Estimation Result
The effective precipitation estimation depends on crop types, rainfall intensity and magnitude, physiographic condition, and soil types. The effective precipitation has been calculated with USDA S.C, FAO AGLW and fixed ratio Indian-1 method [13]. The different Ep calculation method’s result have been compared; the results are showed in (Figure 3). Due to the precipitation pattern, intensity, physiographic similarities, the Indian-1 fixed ration methods show the best fitted curve in the study area. Based on the literature review, physical condition and rainfall pattern, the Indian-1 method select for the effective precipitation calculation.

Figure 3: The monthly total rainfall and estimated effective precipitation result with FAO/AGLU, USDA and Indin-1 methods (0.70, 0.75, and 0.80 fixed ratio) in the study area.
The Indian-1 fixed ratio with three different values used and calculate the sensitivity on irrigated rice area estimation result. Three different set of value considered for the sensitiveness analysis on the estimated irrigation area. (Table 1) shows the different set range value for this study. The fixed ratio 0.75 showed the best result from the sensitivity analysis and it used for the effective precipitation estimation for rice paddy irrigation assessment in this study.
| (Ep-CWR) set | A | B | C |
|---|---|---|---|
| Irrigated | < -300 | < -200 | < -100 |
| Supplementary Irrigated | -300 – 0 | -200 – 0 | -100 - 0 |
| Rainfed | > 0 | > 0 | > 0 |
Table 1: Three set of range values for irrigated, supplementary irrigated and rainfed rice area determination and sensitivity analysis for asses the seasonal variation of the irrigated area over Bangladesh.
Seasonal CWR for Irrigated Rice
The methodology used for this study to estimate the irrigated, supplementary irrigated and rainfed rice area estimation has great influence of precipitation and evapotranspiration. The CWR result for three different rice growing season also observed variation. In the boro rice growing season the CWR for irrigated rice speckled from 350 mm to 950 mm. In the CWR distribution for boro rice area, the north-western and central-norther part of the country required more CWR and southern and eastern part of the country shows less CWR comparatively. As the evapotranspiration rate is higher in rice growing season, the estimate CWR also slightly higher than the boro rice season. The amon rice paddy CWR for CF irrigation also varied from 350 to 1100 mm over the region.
Like the aus rice growing season the early growth stage of amon rice paddy experienced higher ET rate. The central and southern part of the country required higher CWR for CF irrigation. The result from the climate adjusted model and CROPWAT model compared in different weather station in the study area. The climate adjusted CWR model showed little bit overestimated compared with the CROPWAT model. The climate adjusted model estimated CWR for CF irrigated rice in Bogura, Mymensignh and Khulna station are 581-635 mm, 595-778 mm, and 612-743 mm, respectively for boro rice season. Whereas the CROPWAT model estimated CWR are 488, 512 and 514 mm, respective station. The estimated CWR for boro, aus and amon rice also varied over the time. In (Table 2) shows the comparative result from climate adjusted model estimation and CROPWAT estimated CWR for AWD and CF irrigated rice.
| Location | Rice Season | Climate adjusted Model Estimated CWR (mm) | CROPWAT model Estimated CWR (mm) |
|---|---|---|---|
| Bogura | Boro Rice | 581-756 | 488 |
| Aus Rice | 680- 742 | 520 | |
| Amon Rice | 636-720 | 514 | |
| Mymensingh | Boro Rice | 595-788 | 453 |
| Aus Rice | 645-812 | 512 | |
| Amon Rice | 630-786 | 554 | |
| Khulna | Boro Rice | 612-743 | 514 |
| Aus Rice | 643-734 | 535 | |
| Amon Rice | 634-712 | 497 |
Table 2: Comparision of estimated CWR for seasonal rice with this study used climate adjusted model and CROPWAT model in sellected station.
Irrigated Rice Area Mapping Result
Irrigated Boro Rice Area Result: The boro rice season is the maximum rice producing season by total rice production and second one by area. The highest per unit yield and favourable climatic condition with irrigation facilities development are inducing the boro rice season as popular among the farmer. The boro rice season is the mostly irrigated with very few areas supplementary irrigated. There is no rainfed boro rice paddy in the study area and almost negligible rice area is supplementary irrigated. The estimated irrigated boro rice was 3.19 M ha in 2001 and becomes 4.57 M ha in 2018. The irrigated boro rice area demonstrated drastic increases over the time. This change happened due to the boro rice area expansion not due to the supplementary or rainfed rice area increased. The supplementary irrigated area shows comparatively higher in 2015. (Figure 4) shows the irrigated and supplementary irrigated boro rice area in Bangladesh.

Figure 4: Estimated irrigated, supplementary irrigated and rainfed boro rice area in study area from 2001 to 2018.
The estimated irrigated boro rice area showed the similar distribution pattern as boro rice distribution pattern. The central-northern and the north-western region of the country’s irrigated boro rice area. The north-western part of the country is the drought prone area and the region faces severe water scarcity during summer season. The government subsidise deep irrigation water pump installed to ensure the irrigation facilities. The eastern part of the country boro rice is mainly seasonal wet land and it’s the most rainfall pattern experienced. As a result, the supplementary irrigated are mainly in this area. (Figure 5) shows the irrigated and supplementary irrigated area distribution over the study area from 2001 to 2018. The details maps added at appendix C.

Figure 5: Distribution of estimated irrigated, supplementary irrigated and rainfed boro rice area in study; (a) 2001, (b) 2002, (c) 2003, (d) 2004, (e) 2005, (f) 2006, (g) 2007, (h) 2008, (i) 2009, (j) 2010, (k) 2011, (l) 2012, (m) 2013, (n) 2014, (o) 2015, (p) 2016, (q) 2017 and (r) 2018.
Irrigated Aus Rice Area Result: The rainy season aus cultivating season is dominated by supplementary and rainfed rice area. The country experienced huge amount of precipitation especially during to the harvested season. Due to the excess rainfall the season frequently face severe flood and production loss. The season is lest rice cultivated season in the country. The irrigated aus rice area was 436 thousand ha in 2001 and becomes 649 thousand ha in 2018. The irrigated, supplementary and rainfed area fluctuated with the rainfall pattern change. (Figure 6) shows the supplementary and rainfed aus rice area in the country.

Figure 6: Estimated irrigated, supplementary irrigated and rainfed aus rice area in study area from 2001 to 2018.
The estimated irrigated aus rice area demonstrated that the north western part of the country is the mainly irrigated aus rice area. Along with, the north-western part of the country also the major aus rice cultivated area. The region is the less rainfall region in the country and face water scarcity during the summer season. Moreover, the region is comparatively high elevation and less flood risk zone. The southern part and the north-western part of the country’s aus rice area are fully rainfed. The supplementary irrigated area is the dominant most of the year as the early planted aus require irrigation due to the monsoon season start from June. (Figure 7) shows the irrigated, supplementary and rainfed aus rice area distribution map.

Figure 7: Distribution of estimated irrigated, supplementary irrigated and rainfed aus rice area in study; (a) 2001, (b) 2002, (c) 2003, (d) 2004, (e) 2005, (f) 2006, (g) 2007, (h) 2008, (i) 2009, (j) 2010, (k) 2011, (l) 2012, (m) 2013, (n) 2014, (o) 2015, (p) 2016, (q) 2017 and (r) 2018.
Irrigated Amon Rice Area Result: The amon rice growing period is started from the monsoon season and end at the late monsoon season. It is the largest rice growing season in the country by area. Although the season is considered as rainfed rice season but mostly in late season need irrigation. The estimated irrigated amon rice area was 2.2 M ha and becomes 1.7 Mha in 2018. The estimated irrigated amon rice area shown decline trend as the amon rice area also declined over the time. The irrigated, supplementary irrigated and rainfed rice area fluctuated among the years over the country. The common trends are with decreased the irrigated area means increases the supplementary irrigated and rainfed rice area or vis versa. The irrigated area estimation model used in this study mainly depends on the climatic parameters, especially the rainfall. With the variation of precipitation pattern and magnitude the irrigated, supplementary irrigated and rainfed rice area also changed. (Figure 8) shows the estimated irrigated, supplementary irrigated and rainfed rice in the study are from 2001 to 2018.

Figure 8: Estimated irrigated, supplementary irrigated and rainfed amon rice area in study area from 2001 to 2018
The irrigated, supplementary irrigated and rainfed amon rice distribution followed the amon rice distribution pattern. The central-western and central-southern part of the country are dominant irrigated amon rice area. The region is less rainfall and higher temperature observed area. The central-northern part of the country’s amon rice area demonstrated as supplementary irrigated area. The north-eastern and south-eastern part of the country is rainfed amon area. The (Figure 9) shows the irrigated, supplementary irrigated and rainfed amon rice area distribution.

Figure 9: Distribution of estimated irrigated, supplementary irrigated and rainfed amon rice area in study; (a) 2001, (b) 2002, (c) 2003, (d) 2004, (e) 2005, (f) 2006, (g) 2007, (h) 2008, (i) 2009, (j) 2010, (k) 2011, (l) 2012, (m) 2013, (n) 2014, (o) 2015, (p) 2016, (q) 2017 and (r) 2018.
Irrigated Rice Area Validation with Governmental Statistical Data
The irrigated rice area of Bangladesh has been calculated using the climatic parameter; evapotranspiration (MOD_ET) and effective precipitation (GSMaP). The estimated data compared with the national statistical data. The boro rice area has a very good relationship with the statistical data. Due to the very high difference between the effective precipitation and crop water requirement, the irrigated Boro rice area calculation has a very good agreement. The calculated irrigated Boro rice area little bit overestimated compared to the statistical data. The linear scatter plot of the estimated and reported irrigated boro rice area showed very good agreement, where the R2 value is 0.087. The aus season is considered as rainfed and there is no available statistics of irrigated aus rice area. The irrigated Amon rice area shows a fluctuation trend with the national statistical data. In 2015 and 2016 the comparison curve for irrigated amon rice area showed almost similar value. Due to the climate change impacts the precipitation pattern changing and the rainy season shrinking with higher magnitude in the country [19]. The overall correlation of estimated irrigated and reported irrigated amon rice area show poor agreement with R2 value 0.55. The probable causes of overestimation of irrigated Amon area are; i) due to the climate change, ii) farmers lately planted for save the Amon rice from damaged to flood and growing period extended to the dryer months, iii) the variation of irrigated area definition and calculation between the remote sensing-based our methodology and national statistical methods. The calculated rice area fluctuated with the weather condition of the year. Although, there are not available data on supplementary irrigated area but several studies also found the supplementary irrigated area is increasing in the country [15-17]. The comparison of calculated irrigated rice area and statistical data shows in (Figure 10).

Figure 10: Estimated irrigated boro and amon rice area comparison with the government reported national statistical data.
Discussion
Irrigated rice area comparison with relevant studies
The estimated irrigated area compared with the national irrigation survey data from Bangladesh Agriculture Research Council (BADC 2018). The irrigated area is mainly defined in the country as the form of groundwater use irrigation by different types of irrigation pump and the surface water irrigation as cannel, dam, and others. The 80% of total irrigated area is used groundwater irrigation. As a result, the number of irrigation pump is an important indicator of irrigated area. The higher number of irrigation pump refers the higher percentage of area under irrigation. We compare our result with the number of irrigation pump over the country. In (Figure 11) shows the different types of operating irrigation pump in Bangladesh. As the deep tube well (DTW) irrigation pump lifted water from deep aquifer and the irrigation coverage area also larger. The installation cost of the DTW is very high and generally government organization installed the pump among the farmer cooperative level. The shallow tube well (STW) is comparatively less irrigated coverage area and installed under the farmer ownership and the most convenient irrigation system in the country. The low lifted pump (LLP) is the very small irrigation coverage irrigated area and low-cost operation. As the DTW number is almost fixed after 2011 but the STW irrigated pump increased drastically up to 2014 and decreased from 2015. The result from this study also shows similar statistics in term of irrigated, supplementary irrigated and rainfed rice area.

Figure 11: The number of operating irrigation pump over the country as deep tube well (DTW) pump, Shallow tube well (STW) pump and low lifted pump (LLP).
Moreover, the sub national level irrigated area without different irrigation pump compared with the result of this study. The number of DTW and STW irrigated pump are comparatively high number and the irrigated area also larger in Rangpur and Rajshahi division. Whereas the Sylhet and Barishal division are the comparatively less irrigated area coverage with a smaller number of irrigation pump. The irrigated area from our study also showed higher estimated in central-north (Rangpur, Mymensingh division) and central western part (Rajshahi division). On the other hand, the Sylhet, Khulna and Barishal division are less irrigated area in both estimated and reported irrigated area (Figure 12). The area equipped for irrigation (AEI) statistics from Global irrigated Area Map (GIAM) also compared with the result from this study. Although the area equipped for irrigation does not refers as irrigated rice area but it’s another indicator for irrigated rice area map. Moreover, the irrigated agriculture area and irrigated rice area also different term. The FAOSTAT reported AEI area and the estimated rice area from this study shows also good agreement. The reported irrigated area shows increasing trend over the time and the estimated rice area in boro season also showed increasing trends. The irrigated aus and amon rice comparison is very difficult due to the unavailable seasonal irrigated area statistics. But the monthly precipitation and evapotranspiration data in the country also a potential tool for seasonal irrigated rice area validation. The monthly ET and precipitation difference in the aus and amon season fluctuated through the season and the irrigated area also fluctuated. In figure 13 shows the comparison result of this study estimated irrigated rice area and FAOSTAT reported AEI in Bangladesh from 2001- 2018.

Figure 12: Irrigated area and the numbers of irrigation pump installed in the country under major administrative boundary (Division) level.

Figure 13: Irrigated area comparison with FAOSATA area equipped for irrigation area in Bangladesh from 2001 to 2018.
Uncertainties
The CWR and irrigated area mapping with remote sensing is challenging and there are several uncertainties of estimation. The CWR depends on ET and Kc value for rice. In this study used MOD16A2 dataset which greatly influenced by cloud contamination especially during rainy season. The Kc value used in this study is dimensionless monthly value, but the Kc value change every day with the crop growth. So, this is the limitation of this study and probable causes of discrepancy. The irrigated area estimated with the climatic parameter effective precipitation and CWR for entire growing period. There is difference between monthly irrigated area and seasonal irrigated area. Like in case of amon irrigated area estimation, the amon rice planted in July/ August is rainy season and there is almost every day precipitation occurred. So, in July/August the amon rice area is rainfed. Similarly, September also rainfed but from October to November the rainfall pattern decreased, and it’s need supplementary water and becomes irrigated. But for entire growing period the amon rice area become irrigated. The estimated irrigated area compared with national statistics reported irrigated area. The national statistics data collection based on field visit, expert opinion and previous years’ experience. The statistical data also have some biasness which is another source of uncertainties.
Conclusion
The estimated irrigated, supplementary irrigated and rainfed rice for boro, aus and amon season shows the temporal and seasonal variation over the time. The boro rice area is almost fully irrigated and showed very good agreement (R2 value 0.87) with reported national statistical data. The estimated irrigated amon rice area showed fluctuation over the time and illustrated poor agreement (R2 value 0.55) with the reported rice area is very important for the country because of largest irrigated season in summer and irrigated rice area. The aus rice area shows almost rainfed and supplementary irrigated. The irrigated boro consume huge amount of ground water. The Amon rice season are mainly irrigated and supplementary irrigated and aus season is almost rainfed. The climatic parameters based irrigated rice area could be helpful for the academician and policy maker for irrigated water management, ground water depletion assessment, and climate change mitigation.
REFERENCES
- Ali MH, Mubarak S. Effective Rainfall Calculation Methods for Field Crops: An Overview, Analysis and New Formulation. Asian Research Journal of Agriculture. 2017;7:1-2.
- Richard A. Crop Evapotranspiration - Guidelines for Computing Crop Water Requirements - {FAO} {Irrigation} and Drainage Paper 56. 1998.
- Allen RG, Pereira LS, Raes D, Smith M. Allen_FAO. Irrigation and Drainage Paper No. 56.1998.
- Ambika AK, Wardlow B, Mishra V. Remotely Sensed High Resolution Irrigated Area Mapping in India for 2000 to 2015. Scientific Data. 2016;3.
- BADC. Minor Irrigation Survey Report 2017-2018.” Survey and Monitoring Project. 2018.
- Carrijo DR, Lundy ME, Linquist BA. Rice Yields and Water Use under Alternate Wetting and Drying Irrigation: A Meta-Analysis. Field Crops Research. 2017;203:173-180.
- Gumma MK, Thenkabail PS, Maunahan A, Islam S, Nelson A. Mapping Seasonal Rice Cropland Extent and Area in the High Cropping Intensity Environment of Bangladesh Using MODIS 500m Data for the Year 2010. ISPRS. 2014;91:98-113.
- Hossain, MB, S Yesmin, M Maniruzzaman, and JC Biswas. 2017. “Irrigation Scheduling of Rice (Oryza Sativa L.) Using CROPWAT Model in the Western Region of Bangladesh.” The Agriculturists. 2017;15:19-27.
- Mainuddin M, Kirby M, Chowdhury RAR, Sanjida L, Sarker LH, Shah- Newaz SM et al. Bangladesh Integrated Water Resources Assessment Supplementary Report :Land Use, Crop Production, and Irrigation Demand. 2014.
- Pereira LS, Alves I. Crop Water Requirements Crop Water Requirements. 2005.
- Mosleh MK, Hassan QK, Chowdhury EH. Application of Remote Sensors in Mapping Rice Area and Forecasting Its Production: A Review. Sensors (Switzerland). 2015;15:769-791.
- Qiaozhen M, Zhao M, Running SW. MODIS Global Terrestrial Evapotranspiration (ET) Product (MOD16A2/A3). 2013.
- KK Chalapathi, Parvez MB, Inayathulla M, Prabhu N. Estimation of Crop Water Requirement for Kolar Taluk Sub Watershed. 2019;6:34-41.
- Portmann FT, Siebert S, Döll P. MIRCA2000-Global Monthly Irrigated and Rainfed Crop Areas around the Year 2000: A New High-Resolution Data Set for Agricultural and Hydrological Modeling. Global Biogeochemical Cycles. 2010;24.
- Doorenbos P. Crop Water Requirements Crop Water Requirements. 1984.
- Abdus SM, Iftekharuddaula KM, Siddique AB, Rashid MA, Rashid H, Momin MS, et al. Strategic Plan for Increasing Aus and Aman Rice Cultivation in Bangladesh. 2014.
- Sakti AD, Dimara A, Takeuchi W. 2018. Development of Long-Term Global Crop Water Requirement by Integrating Development of Long-Term Global Crop Water Requirement by Integrating Multi-Source Earth Observation Data Products. 2018.
- Salmon JM, Friedl MA, Frolking S, Wisser D, Douglas E. Global Rain-Fed , Irrigated , and Paddy Croplands : A New High Resolution Map Derived from Remote Sensing , Crop Inventories and Climate Data. International Journal of Applied Earth Observations and Geoinformation. 2015;38:321–34.
- Rose N, Sankaranarayanan S, Pande SK, Das D. Application of FAO-CROPWAT software for modelling irrigation schedule of rice in Rwanda. AJOL. 2019;1:7–13.
- Sen R, Karim NN, Islam MT, Adham AKM. Estimation of Supplemental Irrigation for Aman Rice Cultivation in Bogra and Dinajpur Districts of Bangladesh. Progressive Agriculture. 2017;28: 42–54.
- Shige S, Yamamoto T, Tsukiyama T, Kida S, Ashiwake H, Kubota T, et al. The GSMaP Precipitation Retrieval Algorithm for Microwave Sounders—Part I: Over-Ocean Algorithm. IEEE Transactions on Geoscience and Remote Sensing. 2009;47:3084–3097.
- Siebert S, Kummu M, Porkka M, Döll P, Ramankutty N, Scanlon BR. Historical Irrigation Dataset (HID).” Hydrology and Earth System Sciences. 2015;19:1521–1545.
- Pillai SU, Sushanth CM, Mammen G, Joseph EJ. FAO-CROPWAT Model-Based Estimation of Crop Water Need and Appraisal of Water Resources for Sustainable Water Resource Management : Pilot Study for Kollam District – Humid Tropical Region of Kerala , India. JSTOR. 2017; 112:2010-2017.
- Tabbal DF, Bouman BAM, Bhuiyan SI, Sibayan EB, Sattar MA. On-Farm Strategies for Reducing Water Input in Irrigated Rice; Case Studies in the Philippines. Agricultural Water Management. 2002;56:93–112.
- Thenkabail PS, Biradar CM, Noojipady P, Dheeravath V, Li Y, Velpuri M, et al. Global Irrigated Area Map (GIAM), Derived from Remote Sensing, for the End of the Last Millennium. International Journal of Remote Sensing. 2009;30:3679–3733.
Citation: Islam MR (2021) Irrigated rice area mapping over Bangladesh with remotely sensed data from 2001 to 2018. Agrotechnology 10: 213.
Copyright: © 2021 Islam MR. This is an open-access article distributed under the terms of the Creative Commons Attribution License, which permits unrestricted use, distribution, and reproduction in any medium, provided the original author and source are credited.