


Indexed In
- Open J Gate
- RefSeek
- Hamdard University
- EBSCO A-Z
- OCLC- WorldCat
- Publons
- International Scientific Indexing
- Euro Pub
- Google Scholar
Useful Links
Share This Page
Journal Flyer

Open Access Journals
- Agri and Aquaculture
- Biochemistry
- Bioinformatics & Systems Biology
- Business & Management
- Chemistry
- Clinical Sciences
- Engineering
- Food & Nutrition
- General Science
- Genetics & Molecular Biology
- Immunology & Microbiology
- Medical Sciences
- Neuroscience & Psychology
- Nursing & Health Care
- Pharmaceutical Sciences
Research Article - (2020) Volume 9, Issue 2
Investigate the Sensitivity of the Satellite-Based Agricultural Drought Indices to Monitor the Drought Condition of Paddy and Introduction to Enhanced Multi-Temporal Drought Indices
Jayawardhana WGNN* and Chathurange VMIReceived: 07-Feb-2020 Published: 04-Mar-2020, DOI: 10.35248/2469-4134.20.9.272
Abstract
Vegetation Health Monitoring from space and the Normalized Difference Vegetation Index (NDVI) are widely used in the field of photosynthesis capacity of vegetation. The number of drought indices calculates by comparing the NDVI of time of observation with the Long term NDVI values and called as “multi-temporal drought indices” in this study. Some are developed using only the data of the time of observation and no time-series data required, therefore called “ non-temporal drought indices ” . This study analyzed multi-temporal and non-temporal drought indices calculated using NDVI, Normalized Difference Water Index (NDWI), and Land Surface Temperature (LST). These indices utilize not only to monitor agricultural droughts but monitor the crop condition also. Freely available 19 years MODIS satellite data (MOD13Q1 and MOD11A2) were used to calculate them and discussed the sensitivity of the indices for the monitoring of agricultural droughts and crop conditions in the rain-fed dry zone paddy agriculture in Sri Lanka. For that, the Relationship of all variables with Climate Hazards Group Infrared Precipitation with Station data (chirps), rainfall anomaly, and Standardized Precipitation Index (SPI) were analyzed. This study observed that the NDWI Anomaly and Vegetation water condition Index (VWCI) shows a considerable relationship with SPI and rainfall. Also, this study identified that the false drought conditions can be seen in multi-temporal drought indices, due to the changes of the time of the start of the season and suggested a method to overcome such errors in heavily dynamic climatic areas. The new approach is called “Enhanced multi-temporal drought indices”.
Keywords
NDVI; NDWI; VWCI; MODIS; SPI; Sri Lanka
Introduction
Sri Lanka is one of the countries which highly depend on agriculture. The primary food crop of Sri Lanka is rice. The continuous monitoring of the paddy lands in Sri Lanka is essential for decision making on food security of the country and will benefit to avoid food instability.
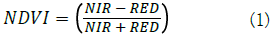
Vegetation condition monitoring from space is more popular today. It helps to provide real time spatial information too. In addition, the availability of long term spatial data covering the entire island is one of the advantages of using satellite images for vegetation monitoring. Normalized Difference Vegetation Index (NDVI) is utilized as a fundamental index based on the number of agricultural drought indices. NDVI uses the red and photographic Infra-Red (IR) radiances to monitor the photosynthetically active biomass of plant canopies [1]. Equation 1 shows the formula of NDVI. The red channel is located in the chlorophyll absorption region and the reflectance of healthy vegetation is high in the Near Infra-Red (NIR) region of the electromagnetic spectrum.
NDVI solely is not a drought index. By definition, low NDVI values indicated the stressed in vegetation, but to define it as drought or degradation of crop condition the scientists introduced the comparison of the current NDVI with long term data. Vegetation Condition Index (VCI) [2] developed to detect drought and to measure the time of its onset, intensity, duration, and impact of vegetation. The index describes not only the well-defined, widespread drought but also much localized short term droughts [2]. Temperature Condition Index (TCI), and Vegetation Health Index (VHI) introduced simultaneously to determine temperature-related vegetation drought and also stress caused by excessive wetness [2]. VHI introduced to compensate for some drawbacks of the use of VCI individually as an agricultural drought index. For example during the periods of flood or heavy rain over the agricultural area the NDVI value depresses. Therefore VCI represents it as a drought situation but actually, it is excessive wetness. NDVI and VCI both sensitive to flood and drought both as well as other environmental phenomena like wildfire, pest infestation, hail, etc. and this may result in an incorrect interpretation or identification of a drought-like signal [3]. A combination of VCI together with TCI is a successful attempt to monitor agricultural droughts [4]. Standardized Vegetation Index (SVI) [5] is one of the multitemporal drought indexes. The Index describes the deviation of the current NDVI from the Long-term mean NDVI in a number of standard deviations. Actually, the Index measures, the Z score of the current NDVI with historical data. Another method to measure the current crop condition is to take the Anomaly from the long term mean, called NDVI_Anomaly. It quantifies the deviation of the vegetation condition in time of observation from the normal behavior.
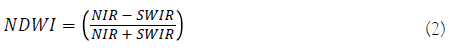
Normalized Difference Water Index (NDWI) [6] uses the NIR and Short Wave Infra-Red (SWIR) bands in the wavelengths 0.86 μm and 1.24 μm respectively. The liquid water absorption ability is high in the SWIR region than the NIR region; therefore, the crop with high liquid water content has the higher NDWI values while stressed vegetation has minus or very low NDWI values. Equation 2 shows the formula of NDWI. NDWI should be considered as an independent vegetation index. It is complementary to NDVI but not a substitute for NDVI [6].
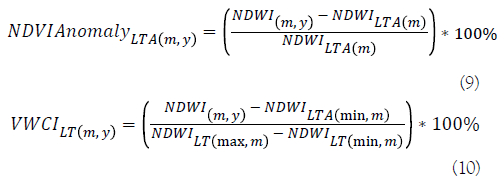
Ability of NDVI and NDWI to depict the crop stress was checked by the scientists and concluded that the relationship between satellite-derived vegetation indices and soil moisture is highly dependent on the land cover heterogeneity and soil type [7]. They suggested that both indices are appropriate for monitoring drought stress on vegetation but recommends to the sensitivity analysis for the different geographical regions further [7]. The sensitivity of the NDWI is high in response to the agricultural drought than NDVI [8]. NDWI describes the plant water stress and NDWI is not a drought index. Therefore (Normalised Difference Drought Index) NDDI [9] was introduced by combining the NDVI and NDWI together and the drought severity measured by the NDVI and NDWI of the time of observation. But no global drought thresholds are designed for NDDI. The NDDI was found to have the highest correlation with precipitation and capture the historical drought impacts on crop yield well and the suggested to use NDDI to monitor agricultural droughts in highly dynamic tropical catchments and VHI recommends for forest condition monitoring. [10].
The understanding of the relationship between the agricultural drought indices and the rainfall and rainfall derived indices is essential in regional scale as done in this study. Normally, the precipitation deficits are called as a meteorological drought. The long term meteorological drought will convert to the agricultural drought and the main factor influenced to occur the agricultural drought is soil moisture. The insufficient soil moisture is called as agricultural droughts. If the meteorological droughts exist for the longer duration it will affect the streamflow and groundwater table called a hydrological drought. Standardized Precipitation Index (SPI) [11] is a powerful meteorological drought Index. Rainfall is an only requirement to calculate SPI and it can be calculated into different time scales. The SPI calculation for any location is based on the long-term precipitation record for the desired period of at least 30 years [11]. This long-term record is fitted to a probability distribution, which is then transformed into a normal distribution so that the mean SPI for the location and desired period is zero [11]. Short term SPI (one to six months SPI) represents the soil moisture deficits which directly related to agricultural drought [12].
Moderate Resolution Imaging Spectroradiometer (MODIS) sensor is a popular sensor which uses for agricultural monitoring. The filtering techniques required to make the smoothed time series from that data [13]. The fitted data have the ability to depict the trends and already utilized by scientists to obtain the maximum benefit from the free remote sensing sensors especially in developing countries [14].
Regression models are using the integration of satellite-based vegetation indices, climate-based drought indices and biophysical parameters like soil properties and land cover with a combination of the accurate in situ measurements. One such integrated drought index is the Vegetation Drought Response Index (VegDRI) [3]. VegDRI shows a higher relationship with rainfall and SPI, especially in rainfed areas. But the accurate and well-distributed ground network is essential for such models. Implementations of such data integration approaches are difficult with sparsely available ground measuring networks. Therefore understand the relationship between agricultural and meteorological indices generated by freely available sensors data is always vital. In this context of view, the main objectives of this study is to analyses the relationship between satellite-derived multi-temporal/non temporal drought indices (VCI, VHI, SVI, NDVI Anomaly, NDWI Anomaly, Vegetation Water Condition Index (VWCI) and NDDI) with meteorological factors (rainfall, rainfall Anomaly, multi-scale SPI) and other vegetation variables (NDVI, NDWI, LST, TCI) in the rain-fed dry zone paddy agriculture in Sri Lanka. The rainfall based indices are calculated using Climate Hazards Group InfraRed Precipitation with Station data (chirps). This study identified the error of multi-temporal drought indices in areas that have highly dynamic weather conditions and introduced an approach to enhance the accuracy of the multi-temporal drought indices, called as the “Enhanced multi-temporal drought indices”.
Study area and data
This study is done for Sri Lanka. There are three climatic zones in Sri Lanka namely Dry Zone, Intermediate Zone, and Wet Zone. Yala (April to September) and Maha (October to March of next year) are the crop growing seasons of Sri Lanka and Maha is the major season. The Yala and Maha cultivation season starts with the southwest and northeast monsoons respectively. Figure 1 shows the crop growing extent of Sri Lanka approximately. The map created by using Global Food Security Analysis- Support Data at 30 Meters (GFSAD30) data 15.

Figure 1. approximate the crop growing extent of Sri Lanka.
Terra Moderate Resolution Imagine Spectroradiometer (MODIS) Vegetation Indices, MOD13Q1 data has been used to generate the NDVI and NDWI. Data are in the spatial resolution of 250 m and 16 days Maximum value composite. Year 2000 to 2018 Long term data were used for the analysis. Data downloaded from ‘ EARTHDATA ’ which powered by Earth Observing System Data and Information System (EOSDIS) and the user-friendly environment to download the NASA Earth Science data from various platforms. MOD11A2, average 8-day per-pixel MODIS day time Land Surface Temperature and Emissivity (LST&E) with a 1 km spatial resolution data are used to calculate Temperature Condition Index (TCI) and Vegetation Health Index (VHI). For the correlation analysis monthly Climate Hazards Group InfraRed Precipitation with Station (chirps) data (5 km) downloaded from the year 1981 and the rainfall anomaly and the Standardized Precipitation Index (SPI) was calculated. Chirps data are downloaded from the Famine Early warning systems network (FEWS NET). Global Food Security Analysis-Support Data at 30 Meters (GFSAD30) used to identify the crop areas of Sri Lanka [15].
Methodology
Generation of vegetation greenness and vegetation waterrelated indices (NDVI, NDWI)
MOD13Q1 data from year 2000 to 2018 were downloaded and pre-processed. In this regard, the ‘R’ package, ‘MODIStsp’ (A Tool for Automatic Preprocessing of MODIS Time Series – v1.3.9) was used. Sri Lanka covered by the h25v08 and h26v08 Scenes and mosaicked both. Quality Assurance (QA) layer used to mask out the bad pixels. NDVI, NIR and SWIR layer extracted and Crop mask were applied. NDVI is already coming with the product and NDWI 6 is calculated by using equation (2). As a time series smoothing technique, Savitsky – Golay 12 moving window is applied for the MOD13Q1 NDVI and NDWI and the fitted data are transformed into the images. NDVI and NDWI values lie between -1 to +1. Therefore, the indices converted to 8bit (0 to 255) before calculating drought indices. 16-day NDVI and NDWI were converted to monthly indices by taking the maximum of the two corresponding 16-day composites.
Generation of multi-temporal agricultural drought indices. (NDVI Anomaly, VCI, SVI, VHI, NDWI Anomaly, VWCI)
In this study NDVI Anomaly, VCI, SVI, VHI and vegetation Water Condition Index (VWCI) are called multi-temporal drought indices, because these indices are calculated by comparing the NDVI of time of observation with the Long term or historical NDVI values of the same time.
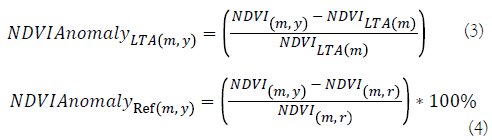
Equation 3 and 4 show the way of calculation of NDVI Anomaly. There are two ways used to calculate NDVI Anomaly, one is NDVI Anomaly to long term average (NDVI AnomalyLTA) and NDVI Anomaly to reference year (NDVI AnomalyRef). Reference year means the less drought year called a normal year. ‘ m ’ and ‘ y ’ denoted to ‘ month ’ and ‘ year ’ respectively in all the indices explained in this research. NDVI of time of observation is compared with the average long term NDVI for the same time. ‘r’ denoted to reference year. NDVI Anomaly ranges from -100 to +100 and categorized as, -100 to -40 Severe drought, -40 to -20 Moderate Negative Anomaly, -20 to -10 Mid Negative Anomaly, and -10 to +100 as Normal. In the normal region, the values can be further subdivided in to moderately wet, very wet and extremely wet.
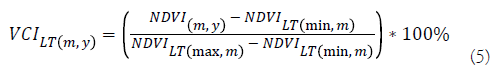
Vegetation Condition Index (VCI) 2, is calculated using the eq. (5). ‘min’ and ‘max’ denoted to Long Term Minimum and Long Term Maximum. For VCI, 19-year time series were used and monthly VCI was calculated. The NDVI of a particular month of a current year is compared with the long term Maximum and Minimum NDVI values of the same month. The basic idea of the index is, the Closeness of the current vegetation greenness to the maximum long term vegetation greenness is considered to measure the drought severity. VCI values lie between 0 to 100 and 0 to 10 as extreme drought, 10 to 20 as severe drought, 20 to 30 as Moderate drought and 30 to 40 as of mid-drought and 40 to 100 as no drought. ‘LT’ means Long Term.
Standardized Vegetation Index (SVI) [5] is calculated using Eq. 6. SD means the standard deviation. In this study, we used SVI values -2 or less extremely dry, -2 to -1.5 Severely dry, -1.5 to -1 moderately dry, -1 to +1 near normal, 1 to 1.5 Moderate wet, 1.5 to 2 very wet, 2 or higher extremely wet.
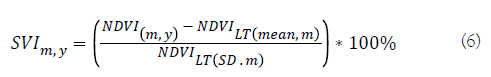
VHI2 was calculated using the VCI together with the Temperature condition Index (TCI)2. Equation 7 shows the formula of TCI. TCI is a vegetation temperature-related index and not an agricultural drought index. 8 day composite of MODIS Land Surface Temperature (LST) (MOD11A2) of 1 km spatial resolution data were converted to monthly by averaging corresponding 8-day images and used to calculate TCI. Therefore VCI data are also resampled to 1 km. VCILT is used to calculate VHI. Equation 8 shows the formula of VHI. is the weight and selected as 0.5 because of the unknown conditions of soil moisture, temperature, and precipitation 10.
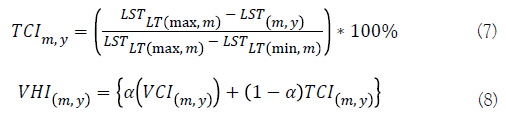
In this study, NDVI Anomaly and VCI are modified slightly to generate the NDWI Anomaly and Vegetation Water condition Index (VWCI). Equation 9 and 10 show the formula of NDWI Anomaly and VWCI respectively. The only modification is replacing the NDVI by NDWI in the Equation (3) and (5). The basic idea of the index is, the Closeness of the current vegetation water content to the long term vegetation water content is considered to measure the drought severity.
Generation non-temporal agricultural drought index (NDDI)
NDDI is called as a non-temporal drought index because the index is calculated only using the NDVI and NDWI of the time of observation, no time-series data required. NDDI [9] is calculated using Eq. (11).
The indices were calculated for the whole Sri Lanka and for the better visualization purpose, the crop mask applied. The images of Julian date 97 to 257 are taken as Yala Season for the particular year and the images of Julian dates 273 to 81 of the next year are taken as Maha Season.
All indices were calculated for the whole country and for the correlation analysis the locations are selected in rain-fed paddy cultivation.
Generation of climate based drought indices (rainfall anomaly, multi-scale SPI)
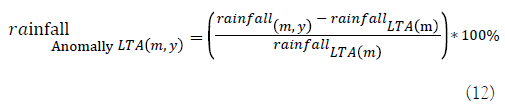
Climate Hazards Group InfraRed Precipitation with Station data (Chirps) monthly rainfall downloaded from 1981 and rainfall anomaly is calculated using Eq. (12). Rainfall (m,y) is the monthly(m) rainfall of the particular year(y) and rainfallLTA(m) means the Long Term Average of the rainfall of ‘m’ months.
SPI 11 is calculated using the historical chirps rainfall data from the year 1981 for the selected points. The Standardized Precipitation Index (SPI) is calculated by monthly precipitation data. It is prepared as the data set is moving in the sense that each month a new value is determined from the previous months. Each of the data sets is fitted to the Gamma function to define the relationship of probability to precipitation [11]. Once the relationship of probability to precipitation is established from the historical records, the probability of any observed precipitation data point is calculated and used along with an estimate of the inverse normal to calculate the precipitation deviation for a normally distributed probability density with a mean of zero and standard deviation of unity [11]. This value is the SPI for the particular precipitation data point [11]. To calculate the 2 months SPI of April 2018 a historic data of months of March and April are considered and for the month of May 2018 SPI the historic rainfall of the months of April and May are considered.
The time series of the all above variables from 2000 to 2018 were analyzed individually. The correlation coefficient of each variable with each other and with climate-based indices are evaluated. Finally concluded on the sensitivity of each variable to response to the agricultural drought and crop condition monitoring. Finally introduces the ‘Enhanced multi-temporal drought indices” as a solution to the identified issue in this study which is the delay or early start of the season.
Results
Figure 2 shows the difference of the time series phenology in rain-fed and irrigated areas in Sri Lanka. It is observed that, only the major season (Maha) is cultivated in the rain-fed areas. The NDVI of the irrigated areas is higher than in rain-fed areas.

Figure 2. The paddy phenological stages and phenology curve of fed and irrigated areas are detailed in the graphical representation.
The use of medium or low spatial resolution data is not sufficient for agricultural Monitoring in Sri Lanka. Because of the narrow strip type spread of the agricultural lands consequently, mixed pixel error may happen. Figure 3 contained a good representation of this issue. In low or medium resolution pixels more than 50% is covered by non-agricultural areas. The agricultural drought indices calculated in this study are in the spatial resolution of 250 m and the VHI is in the spatial resolution of 1 km. It leads to the error in interpretation because the reflectance of a mixed pixel is combined with both vegetation and other features on the ground. This problem is dominant in wet and intermediate climatic zones in Sri Lanka. In this research, five sample locations were selected carefully in the larger agricultural plots in the dry zone to omit such errors.

Figure 3. Mixed pixel error when using medium/low-resolution data for agricultural monitoring in Sri Lanka. (Yellow boundary- 1 km pixel, white boundary: 250 m pixel).
Figure 4 shows the drought severity maps generated in this study. Observed that the Different indices shown different severity for the same area and make confusion in decision making. Therefore identify the ability of each index to monitor the crop/drought condition in Sri Lanka is required and subsequent paragraphs are shown the results of the correlation analysis carried out by this research only using satellite-derived agricultural drought indices and rainfall derived information.

Figure 4. The satellite-derived vegetation and meteorological parameters of Sri Lanka, 2018, Dec.
MOD13Q1 is a 16-day Maximum Value composite product, Therefore the time series filtering technique required to maintain the uniformity of data in NDVI and NDWI time series. Figure 5 shows the difference between the original time series and the fitted data. If we use sentinel 2 (10 m spatial resolution) or other high resolution optical remote sensing data, the missing data and clouds noises still remain. Therefore either it should be mask out the noisy pixel before doing the analysis or should replace the cloud or missing values using time series filtering is essential but great consideration required when selecting the fitting parameters.

Figure 5. Raw data and the time series filtered data.
Correlation among vegetation greenness (NDVI), vegetation water content (NDWI) and land surface temperature (LST, TCI)
TCI has no relationship with NDVI, NDWI or LST. Vegetation greenness and vegetation water content is highly correlated (0.89). LST has a strong negative correlation with NDVI and NDWI. Table 1 shows the correlation matrix which shows the relationship between NDVI, NDWI, LST, and TCI. Figure 6 shows the graphical representation of these relationships.

Figure 6. Graphical representation of correlation between NDVI, NDWI and LST and temporal changes of NDVI, NDWI and LST (Maha Season, rain-fed) are represented in the images respectively.
| NDVI | NDWI | LST | TCI | |
|---|---|---|---|---|
| NDVI | 1 | |||
| NDWI | 0.89 | 1 | ||
| LST | -0.81 | -0.88 | 1 | |
| TCI | 0.03 | 0.1 | -0.28 | 1 |
Table 1: Correlation Matrix 1.
Correlation among different drought indices
VCI, SVI, NDVI_AnomalyLTA, and VHI highly correlated with each other. NDVI Anomalyref has a low correlation coefficient with other indices and always better in comparison with the long term average than comparing with one single year. NDDI, NDWI Anomaly, and VWCI have a strong relationship with each other. NDDI has no relationship with other indices except NDWI_Anomaly and VWCI. NDDI, NDWI_Anomaly, and VWCI have a comparatively weak relationship with NDVI based drought indices. It seems that NDVI based indices correlated together and NDWI related drought indices correlated together. Table 2 shows the relationship between different agricultural drought indices. Figure 7 shows the temporal changes of different agricultural drought indices.

Figure 7. Temporal changes of different drought indices.
| VCI | SVI | NDVI_anomaly _LTA | NDVI_Anomaly_ref | VHI | NDDI | NDWI_anomaly | VWCI | |
|---|---|---|---|---|---|---|---|---|
| VCI | 1 | |||||||
| SVI | 0.96 | 1 | ||||||
| NDVI_Anomaly_LTA | 0.9 | 0.97 | 1 | |||||
| NDVI_Anomaly_ref | 0.42 | 0.48 | 0.47 | 1 | ||||
| VHI | 0.81 | 0.78 | 0.71 | 0.29 | 1 | |||
| NDDI | -0.3 | -0.1 | -0.06 | -0.17 | -0.2 | 1 | ||
| NDWI_Anomaly | 0.57 | 0.56 | 0.52 | 0.25 | 0.62 | -0.69 | 1 | |
| VWCI | 0.67 | 0.6 | 0.55 | 0.3 | 0.6 | -0.76 | 0.83 | 1 |
Table 2: Correlation matrix 2.
Correlation of different drought indices to vegetation greenness, vegetation water, and vegetation surface temperature
TCI has a strong positive relationship only with VHI and has no relationship with any other parameters. Only VWCI and VCI are having a considerable positive relationship with NDVI. Only NDWI_Anomaly and VWCI, VCI and NDDI have a relationship with NDWI. Only NDWI related drought indices (VWCI, NDWI_Anomaly, and NDDI) have a high correlation with LST, but any other indices are not. Table 3 shows the relationship of different agricultural drought indices to NDVI, NDWI, LST, and TCI. Figure 8 depicted the graphical representation of this relationship.

Figure 8. Graphical representation of the correlation of VWCI and NDDI with LST.
| NDVI | NDWI | LST | TCI | |
|---|---|---|---|---|
| VCI | 0.62 | 0.52 | -0.37 | 0.29 |
| SVI | 0.44 | 0.34 | -0.19 | 0.29 |
| NDVI_Anomaly_LTA | 0.45 | 0.31 | -0.15 | 0.22 |
| NDVI_Anomaly_ref | 0.27 | 0.24 | -0.26 | 0.06 |
| VHI | 0.41 | 0.37 | -0.4 | 0.78 |
| NDDI | -0.5 | -0.8 | 0.73 | -0.15 |
| NDWI_Anomaly | 0.24 | 0.51 | -0.52 | 0.38 |
| VWCI | 0.59 | 0.78 | -0.57 | 0.3 |
Table 3: Correlation Matrix 3.
Relationship of all variables to rainfall and SPI
SPI is not an agricultural drought index. It is a meteorological drought index. But agricultural drought happens after a meteorological drought, especially in rain-fed agriculture. In some cases identified that Even the meteorological drought happen but it does not affect the agricultural condition because it happens in the harvesting stage of the paddy. The stage of flowering to maturity only required 10% of the total water requirement. During the maturity stage, the paddy is least sensitive to soil moisture stress. After the yellowish ripening stage, there is no necessity for standing water (as of March 13, 2019, the Tamil Nadu Agricultural University listed on its website ‘expert system for paddy’). Therefore to understand the relationship between meteorological drought indices and agricultural drought indices only consider during cultivation season is important.
Figure 9 shows the variations of 2 months SPI, 6 months SPI and I year SPI. 1-year SPI does not show the frequent variations but short term SPI are varied very frequently. Short term SPI is highly dynamic and it does not remain the same condition at least during consecutive 2 months.

Figure 9. (a) 2months, 6 months and 1-year SPI changes, 2010 to 2017, (b) 1-year SPI (1982 to 2018), (c) 2 months SPI (1982 to 2018) (d) Temporal changes of monthly rainfall and NDVI.
NDVI, NDWI, and VWCI show a relatively high correlation with rainfall (0.49, 0.51, and 0.45 respectively). VWCI is the only drought index which sensitive to the rainfall of the time of observation. NDWI Anomaly shows a considerable relationship with 2,3,4,5 and 6 months SPI. That means the present agricultural drought condition is sensitive to the past 2,3,4,5 and 6 months' rainfall from the time of observation in NDWI Anomaly. VWCI was sensitive to the current rainfall and the past 2 months of rainfall. Table 4 shows the relationship between the indices with rainfall and SPI. Figure 10 shows the graphical representation. Ra_An means the rainfall Anomaly in Table 4.

Figure 10. Graphical representation relationship between 2 months SPI and NDWI_Anomaly.
| NDVI | NDWI | LST | TCI | VCI | SVI | NDVI_Anomaly_LTA | NDVI_Anomaly_ref | VHI | NDDI | NDWI_Anomaly | VWCI | |
|---|---|---|---|---|---|---|---|---|---|---|---|---|
| rainfall | 0.49 | 0.51 | -0.4 | 0.18 | 0.36 | 0.25 | 0.24 | -0.16 | 0.34 | -0.35 | 0.27 | 0.45 |
| Ra_ An | 0.07 | 0.12 | -0.09 | 0.17 | 0.17 | 0.19 | 0.22 | 0.12 | 0.27 | -0.13 | 0.27 | 0.27 |
| spi1 | 0.02 | 0.14 | -0.1 | 0.23 | 0.19 | 0.2 | 0.22 | 0.12 | 0.32 | -0.23 | 0.41 | 0.34 |
| spi2 | 0.13 | 0.23 | -0.16 | 0.2 | 0.33 | 0.33 | 0.31 | 0.14 | 0.36 | -0.27 | 0.45 | 0.41 |
| spi3 | 0.11 | 0.22 | -0.17 | 0.2 | 0.25 | 0.25 | 0.23 | 0.11 | 0.29 | -0.29 | 0.44 | 0.36 |
| spi4 | 0.12 | 0.25 | -0.18 | 0.18 | 0.24 | 0.23 | 0.21 | 0.11 | 0.26 | -0.33 | 0.44 | 0.37 |
| spi5 | 0.12 | 0.25 | -0.2 | 0.19 | 0.26 | 0.24 | 0.22 | 0.12 | 0.28 | -0.34 | 0.43 | 0.37 |
| spi6 | 0.11 | 0.24 | -0.19 | 0.19 | 0.27 | 0.25 | 0.23 | 0.11 | 0.28 | -0.32 | 0.44 | 0.36 |
| spi7 | 0.09 | 0.2 | -0.12 | 0.18 | 0.28 | 0.27 | 0.24 | 0.12 | 0.28 | -0.27 | 0.42 | 0.34 |
| spi8 | 0.06 | 0.16 | -0.03 | 0.13 | 0.28 | 0.28 | 0.25 | 0.1 | 0.25 | -0.21 | 0.37 | 0.3 |
| spi9 | 0.08 | 0.17 | -0.06 | 0.1 | 0.24 | 0.23 | 0.2 | 0.06 | 0.2 | -0.21 | 0.3 | 0.29 |
| spi10 | 0.11 | 0.18 | -0.06 | 0.06 | 0.23 | 0.21 | 0.16 | 0.04 | 0.16 | -0.2 | 0.22 | 0.27 |
| spi11 | 0.09 | 0.1 | -0.02 | 0.01 | 0.15 | 0.12 | 0.08 | 0.02 | 0.08 | -0.08 | 0.06 | 0.16 |
| spi12 | 0.09 | 0.1 | -0.04 | -0.01 | 0.14 | 0.11 | 0.07 | 0.02 | 0.06 | -0.08 | 0.04 | 0.14 |
Table 4: Correlation matrix 4.
Introduction to enhanced multi-temporal drought indices
Drought misclassification is a common drawback that exists in the multi-temporal drought indices when it used for highly dynamic climate regions. Non-drought areas identified as drought areas are called commission error and the drought areas are identified as non-drought areas, called omission error. In multi-temporal drought indices for some agricultural areas of Sri Lanka, ambiguous results were seen and the identified reason for this is explained in the following few sentences of this paragraph. In the indices, the NDVI of the current month is compared with the historical or long term Maximum, average, Minimum or Standard deviation of the same month. But the phenological event is not exactly happening on the same day each year because of the delay in the monsoons and changes in the agricultural practices in the year to year. Of course, the delays in the monsoon are called a drought but it is a meteorological drought. All meteorological droughts are not converts to agricultural droughts always. After sufficient rainfall occurs in the delayed monsoon, the cultivation season starts and the agricultural droughts always may not occur in delayed cultivation season. If the changes of the time in the onset of the cultivation season changes it leads to the changes in the time of the happening of other subsequent phenological events. Likewise, the huge changes in the time of the phenological event in the year to year lead the inaccurate results in the multitemporal drought indices. Figure 11 describes the changes at the start of the season. If In some country or a region the time of tillering, the time of flowering etc. is same in each season the comparison of the current condition with Long Term is fine in all multi-temporal drought indices but comparison of the tillering stage NDVI with the flowering or other stages is always useless and it leads to the drought misclassification.

Figure 11. Multiyear seasonal changes. (The red arrows shows the changes of the time of the happening of maximum tillering stage).
This study suggested the method to overcome such errors in heavily dynamic areas. The new attempt of this study is, the introduction of the new multi-temporal Drought Indices namely Enhanced NDVI Anomaly (ENDVI Anomaly), Enhanced Vegetation Condition Index (EVCI), and Enhanced Standardized Vegetation Index (ESVI). For the purpose of better understanding, the calculation of drought index in the maximum tillering stage is explained here. The previous multitemporal indices generate the monthly drought index and the enhanced multi-temporal drought indices show the drought severity of each growth stage. The basic idea is, the current vegetation greenness should have to compare with the long term statistics of the same growth stage.
The equations to calculate ENDVI Anomaly, EVCI and ESVI are equations 13, 14 and 15 respectively. NDVI(SMax) is the Maximum NDVI of the current Season which is also the NDVI of the maximum tillering stage of a paddy plant NDVILT (Mean,SMax) is the average of the SMax of the years 2000 to 2018 for the particular season. NDVILT(max,SMax) is the maximum of the SMax of the years 2000 to 2018 for the particular season, NDVILT(min,SMax) is the minimum of the SMax of the years 2000 to 2018 for the particular season and NDVILT(SD,SMax) is the Standard deviation of the SMax of the years 2000 to 2018
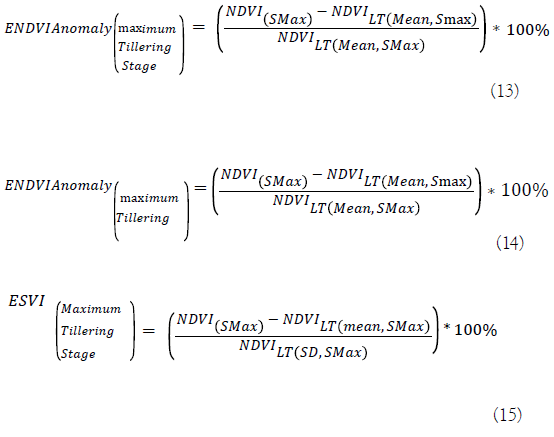
The above introduced three new Enhanced drought indices represent the overall vegetation health of the reproductive phase and the indices compare the Maximum NDVI value of the Season (SMax) with the long term Average, Maximum, Minimum and Standard deviation of the SMax. In the new drought indices, drought or vegetation condition of the unique growth stage of the current season is compared with the long term data of the same growth stage. Figure 12 shows the good graphical information to understand the calculation of drought index per time and drought index per growth stage.

Figure 12. Calculation of drought index per time and per growth stage.
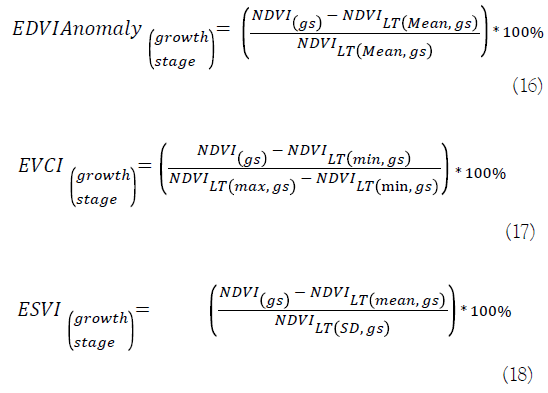
If required to know the vegetation condition of every growth stage in detail, the idea introduced in this research to fit the phenology curve for each year in such a way, that the Maximum NDVI happens at the same time and generation of the seasonal indices according to each growth stage. In such cases the equations are the same as equations 13, 14 and 15, the only difference is ‘gs’ used instead of ‘SMax’ and ‘gs’ is the growth stage of time observation (Equations 16, 17 and 18). Therefore the study suggests rearranging the Long term paddy phonological curves to meet the same growth stages together in time axis and replace the time axis by growth stage.
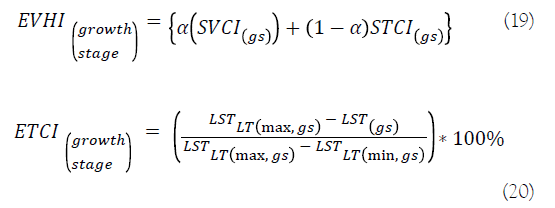
Enhanced Vegetation Health Index (EVHI) can be calculated using Equation 19. To calculate EVHI for particular growth stage of a season, EVCI of a particular growth stage has to be calculated. LST of the same growth stage of each season has to be identified and Enhanced Temperature condition (ETCI) is calculated likewise. The way of calculation is described in the Eq.20. The growth stage of time of observation is represented by ‘gs’.
Likewise, the EVHI can be calculated for the different growth stages as EVHITillering to stem elongation, EVHIpanicle initiation to booting, EVHIheading to flowering, EVHImilky stage, EVHImature grain stage.
This seems to be a good index because the NDVI of the current flowering stage is compared with the long term NDVI of the same stage. In this index, the agricultural drought monitoring of the cultivation season in early or delay monsoons than normal also. The authors suggested calculating Enhanced multitemporal drought indices for the highly dynamic climatic areas.
Conclusion
This study is an attempt to depict the relationship among; satellites based vegetation indices, agricultural drought indices with meteorological parameters and investigate the ability of drought indices to monitor the crop condition and agricultural droughts.
LST has a considerable relationship with NDWI, NDVI, NDDI, NDWI Anomaly, and VWCI but multi-temporal LST (TCI) looks meaningless, no relationship with any of the parameters except with VHI. NDWI is more sensitive to LST variations than NDVI and the NDWI based agricultural drought indices are more sensitive to LST variations than NDVI based agricultural drought indices.
NDWI and NDVI have a strong relationship but NDVI based multi-temporal drought indices and NDWI based multitemporal drought indices do not show a very strong relationship. That means multi-temporal vegetation greenness and vegetation water conditions have a comparatively weak relationship, but NDVI based indices have a strong correlation with each other and NDWI based indices have a strong relationship among them.
NDWI Anomaly has a considerable relationship (0.45) with 2,3,4,5 and 6 months SPI and VWCI is related to the current rainfall (0.45) as well as 2 months SPI (0.41). This proves that the NDWI_Anomaly and VWCI are the best available indices for agricultural drought monitoring in rainfed areas. NDWI related multi-temporal agricultural drought indices are most reliable than NDVI based agricultural drought indices. Other Indices (NDVI Anomaly, VCI, NDDI, SVI, and VHI) are better to monitor crop conditions than agricultural droughts.
Changes of NDVI have a unique signature (phenology) but the vegetation condition/drought condition is highly dynamic during the cultivation season. The maximum correlation coefficient of an agricultural drought index with rainfall and SPI is 0.45 means quiet weak but strong when comparing to the available other indices. That means it is difficult to quantify the agricultural drought only using the satellite-based vegetation water condition and greenness monitoring. The parameters should include expressing the soil moisture deficits for accurate early warning systems. So the strong well-distributed ground observing stations with very frequent precise measurements are required to integrate with above vegetation indices. The accurate crop extent map, rain-fed and irrigated area map and the historical disaster records (ground truths) with geographic location are the limitations experienced in this study.
The global drought thresholds of every agricultural drought indices need to be redefined regionally with the ground truths.
Medium or low-resolution data are not suitable for agricultural monitoring of Sri Lanka due to the availability of narrow agricultural plots. Sentinel 2 is a free remote sensing sensor that is more popular nowadays but the clouds, noises are remaining as an optical sensor. Advanced time series filtering techniques should be used before calculate any of the drought indexes. Time series filtering is always worth than spatial filtering in optical remote sensing data, but great consideration required to stop removing the good quality data.
This study identified that some seasons are highly deviated from normal because of early or delay monsoons. In such dynamic areas, the multi-temporal drought indices are not recommended. Instead, Enhanced multi-temporal drought indices are introduced in this research and the idea is the current crop condition of a particular growth stage should have to compare the Long term data of the same growth stage but not with time. Muti-temporal drought indices and Enhance multi-temporal drought indices are equal for the areas which are not highly dynamic. But drought index per growth stage is always better and meaningful than drought index per month in highly dynamic agricultural zones. The tools generation to calculate Enhanced multi-temporal agricultural drought Indices is open to the agricultural and remote sensing research community.
Disclosure
No potential conflict of interest was reported by the authors.
REFERENCES
- Tucker, Red CJ. Photographic infrared linear combinations for monitoring vegetation. Remote Sensing of Environment. 1979;8(2):127-50.
- Kogan FN. Application of vegetation index and brightness temperature for drought detection. Advances in Space Research. 1995;15(11):91-100.
- Brown JF, Wardlow BD, Tadesse T, Hayes MJ, Reed BC. The vegetation drought response index (VegDRI): A new integrated approach for monitoring drought stress in vegetation. GIScience & Remote Sensing. 2008;45(1):16-46.
- Singh RP, Roy S, Kogan F. Vegetation and temperature condition indices from NOAA AVHRR data for drought monitoring over India. International Journal of Remote Sensing. 2003;24(22): 4393-402.
- Peters AJ, Walter-Shea EA, Ji L, Vina A, Hayes M, Svoboda MD. Drought monitoring with NDVI-based standardized vegetation index. Photogrammetric Engineering and Remote Sensing. 2002;68(1):71-5.
- Gao BC. NDWI: A normalized difference water index for remote sensing of vegetation liquid water from space. Remote Sensing of Environment. 1996;58(3):257-66.
- Gu Y, Hunt E, Wardlow B, Basara JB, Brown JF, Verdin JP. Evaluation of MODIS NDVI and NDWI for vegetation drought monitoring using Oklahoma Mesonet soil moisture data. Geophysical Research Letters. 2008;35(22).
- Gu Y, Brown JF, Verdin JP, Wardlow B. A fiveyear analysis of MODIS NDVI and NDWI for grassland drought assessment over the central Great Plains of the United States. Geophysical Research Letters. 2007;34(6).
- Renza D, Martinez E, Arquero A, Sanchez J. Drought estimation maps by means of multidate Landsat fused images. In: Proceedings of the 30th EARSeL Symposium. 2010.
- Du TL, Bui DD, Nguyen MD, Lee H. Satellite-based, multi-indices for evaluation of agricultural droughts in a highly dynamic tropical catchment, Central Vietnam. Water. 2018;10(5):659.
- McKee TB, Doesken NJ, Kleist J. The relationship of drought frequency and duration to time scales. In: Proceedings of the 8th Conference on Applied Climatology. 1993;17(22):179-183.
- Svoboda M, Hayes M, Wood D. Standardized Precipitation Index User Guide. World Meteorological Organization Geneva, Switzerland. 2012.
- Jonsson P, Eklundh L. TIMESAT: A program for analyzing timeseries of satellite sensor data. Computers & Geosciences. 2004;30(8):833-45.
- Jayawardhana WG, Chathurange VM. Extraction of agricultural phenological parameters of Sri Lanka using MODIS, NDVI time series data. Procedia Food Science. 2016;6:235-41.
- Thenkabail PS, Knox JW, Ozdogan M, Gumma MK, Congalton RG, Wu ZT, et al. Assessing future risks to agricultural productivity, water resources and food security: How can remote sensing help? PE&RS, Photogrammetric Engineering & Remote Sensing. 2012;78(8):773-82.
Citation: Jayawardhana WGNN, Chathurange VMI (2020) Investigate the Sensitivity of the Satellite-Based Agricultural Drought Indices to Monitor the Drought Condition of Paddy and Introduction to Enhanced Multi-Temporal Drought Indices. J Remote Sens GIS. 9:272. DOI: 10.35248/2469-4134.20.9.272
Copyright: © 2020 Jayawardhana WGNN, et al. This is an open-access article distributed under the terms of the Creative Commons Attribution License, which permits unrestricted use, distribution, and reproduction in any medium, provided the original author and source are credited.