Indexed In
- Open J Gate
- RefSeek
- Hamdard University
- EBSCO A-Z
- OCLC- WorldCat
- Publons
- International Scientific Indexing
- Euro Pub
- Google Scholar
Useful Links
Share This Page
Journal Flyer

Open Access Journals
- Agri and Aquaculture
- Biochemistry
- Bioinformatics & Systems Biology
- Business & Management
- Chemistry
- Clinical Sciences
- Engineering
- Food & Nutrition
- General Science
- Genetics & Molecular Biology
- Immunology & Microbiology
- Medical Sciences
- Neuroscience & Psychology
- Nursing & Health Care
- Pharmaceutical Sciences
Research Article - (2023) Volume 12, Issue 3
GIS Based Crime Mapping and Analysis Hotspot in the Case of Mekelle City, Tigray Region, Northern Ethiopia
Fikre Hagos1* and Aynalem Gebyehu22Department of Geo-Informatics, Mekelle Institute of Technology, Mekelle University, Mekelle Tigray, P.O. Box: 23, Ethiopia
Received: 27-Feb-2023, Manuscript No. JGRS-23-20019; Editor assigned: 02-Mar-2023, Pre QC No. JGRS-23-20019 (PQ); Reviewed: 16-Mar-2023, QC No. JGRS-23-20019; Revised: 10-May-2023, Manuscript No. JGRS-23-20019 (R); Published: 17-May-2023
Abstract
The aim of this study was GIS based crime mapping and analysis hotspot in terms of time and space from 2010 to 2019. The data necessary for the study was collected from the Mekelle city police offices crime occurred records format. Furthermore, additional information required for the study area collected through interviewing Mekelle zone, police officers. The locations of frequent crime happened occurrences were specified using GPS X-Y coordinates of crime occurred spot were and for verifying used Google earth and added to ArcGIS 10.6. Data analysis was made using ArcGIS 10.6 and excel. The results were presented in the form of hotspot area map, bar graph, line graphs, figures, tables and spatial hotspot distribution maps. The result of the study exposed that, 24603 crime occurred recorded in the Mekelle city police Offices for study period. About 57 peoples were answered the questioner and 13 people also interviewed and discussion about the crime occurred in Mekelle city and each sub-city from 2010 to 2019. Unevenly Mekelle city in 159 places happened different types of crimes Accidents have occurred in 24603 different crime recorded Accident spots of the city in the study period. Besides, from the study area, Kedemay weyane is highest recorded and show in the hotspot map, Hawelti and Adihaki sub-city the 2nd stages but the other sub city was similarly hotspot identified in the city. It was concluded that the frequency of occurrence of crime occurred and number of victims was shows that decreased from time to time because of the police community to give more training and awareness to the community of Mekelle city, Each sub-city and the other factor also to strongly control the area and cooperate with voluntary young people of the community and so no.
Keywords
GIS; Remote sensing; Crime stat; Hotspots analysis; Crime mapping
Introduction
Now a day’s crime is becoming a global issue and its form varies from place to place in its type, intensity, motive and its sophistication. These criminal acts include active terrorism, robbery, killings, sexual abuse, corruption, vandalism, theft, human police kin, etc. The causes for these criminal acts have different reasons, which include economic, political, religion, psychological, racial, personal background and day-to-day activities of individuals and groups. The special distribution of these criminal acts has a direct relationship with the socio economic situation of the society, on the economic development and stability of a country. Hence, in order to bring back the peace and stability of a country and to create a safe and sustainable social interaction of well-organized crime controlling and management system has to be established within society [1]. Crime mapping identifies high crime areas, where the risk of victimization is relatively high, where residents have great difficulty exerting social controls; it identifies concentrations of crime, determines the causes of these concentrations, and then implement responses to reduce these concentrations. Much of crime analysis is dedicated to locating neighborhoods with high concentrations of crime and much of crime mapping is devoted to their detection [2]. In Ethiopia, criminal activities are becoming major challenges of the country where their special distribution and their type varying from place to place. Crime occurrences have a direct relationship with urbanization, population density, economic interaction, social and cultural characteristics, wealth distribution among citizens and the strength of law enforcement. In general, Ethiopia has a higher crime rate in urban cities than the rural areas due to some of the above mentioned factors. Hence, Mekelle city is our current study area location, being the regional capital of Tigray regional state it occurred different types of crimes at different places and times. The special distribution, type and the time of the crime event vary from one sub-city to another.
Accordingly, our study area, Mekelle zone police, located at the center of the city has higher crime rates than other sub-cities. The reason lies in the fact that it has high economic activity both in the day and night times. Hence, in this research, the spatial distribution, type, frequency, time of occurrence, and major victims of the criminal act was studied briefly. In addition, the crime extent and the capacity and distribution of police stations within the sub-city were evaluated. Finally, problem solving recommendations was stated as much as possible.
Therefore, crime trips appear to be governed by the offender’s goal to minimize the costs of committing the crime, including distance, and the availability of potential targets. The influences of these factors may act in unison, as opposing forces, or somewhere in between [3]. Following assumption that offender prefers nearby targets as opposed to ones further away, criminal travel was indicative of target availability. If a cluster of targets exists near the offender’s home, and the offender is cognitive of such targets, a crime trip was short. However, targets are not always immediately available to the offender, especially commercial or spatially fixed targets [4]. Crime mapping helps an investigator in geographic identification and profiling. By analyzing temporal and spatial data, obtain in crime mapping analysis investigators are able to prioritize suspect and victims based on their address information [5]. Temporal and spatial data is useful in providing investigators with information on the characteristic of individuals and location that they may likely fell comfortable to commit criminal offense, therefore, investigators and analysis can identify both the awareness space and activity of the criminals and their probable victims or targets. It also lowers down the number of suspects in case of serial crime cases and can allow police to manage information on the thousand and hundreds of suspects [6]. Like criminal investigation, crime mapping has the ability to help investigators to separate the numerous numbers of suspects they have arrested in order to reach the most perfect and likely suspect.
Finally, it assists in prioritizing areas for directed police patrols or areas canvasses in case the offenders are operating during a narrow period [7]. Investigators may use crime-mapping analysis negatively in a way they may emphasize on certain crimes while others are left or remains un-recorded or researched on. Crime mapping also increases stigmatization and reduces investment for those living in areas with high crime rate, and may give a criminal access to the same information from which policing strategy is derived from. Similarly, even when this information is not made public, crime maps develop strategies in which is discriminatory against certain locations and communities [8].
Therefore, the application of crime mapping analysis needs to be thoughtful as in the data collection and analysis. Crime mapping is a powerful tool, which requires careful handling. Most of the law enforcement agencies both private and government delayed back or dissociated from using crime mapping due to lack of resource or satisfaction with its application [9].
According to Blake M. Randol, suggest that the reason for the initial low adoption of mapping technology was mainly due to its immaturity at the analytical stage. In addition, when the data collected from maps on crime is anecdotal and historical meaning that the current dynamics do not emerge from the data, the policing agents and other efforts focus on the old problem rather than new ones [10]. The GIS allows integration and analysis of data to identify, apprehend and prosecute suspects; it aids more proactive behavior through effective allocation of resources and better policy setting [11]. For example, thematic maps could be used to predict likely sensitive points/areas in the hotspot area. Data on surface communication, telephone communication and demographic pattern can all be used to predict the sensitivity of a locality in relation to a given time [12]. Law enforcement needs information management, especially location information. Traditional law enforcement for different types of police applications really deals with data collection. However, data collection without data analysis is useless. Not only does GIS allow integration and spatial analysis of data to identify, apprehend and prosecute suspects, it also aids more proactive measures through effective allocation of resources and better policy setting [13]. Urbanization and socio-economic development of developing countries have a major impact on the peace and stability of society [14]. In most developed countries crime occurred in different forms and scales are becoming serious concerns of nations [15]. Knowing on where and when creation incidents of crime occur can be assist the police to better prevent them from occurring. This is possible because limited police resources can be used in knowing crime in faced areas at times [16]. Mekelle is the capital city of Tigray regional national state the study area, accordingly, our study area, has higher crime rates than other Tigray regional national state. The reason was to select our study area I was taken prediscussion where the high crime area is happened with Tigray regional state police commotion and Mekelle zone police information and flow up offices. They Saied that to its relative location to other cities accordingly historical backgrounds Mekelle city was high crime area than it is the economic center of the region. Hence, most of the commercial activities of the city are located here. Outstanding to all the above mentioned factors, the crime level within Mekelle city was higher than other sub-city. The crime types range from daylight looting of money, electronic materials, accessories of cars and different individual properties to nighttime group robbery of individual house, business centers and individual citizens. These crimes are conducted by simple cheating or using forceful attacks on the victims. Some of the nighttime crimes are conducted using force supported by attaching materials such as knife and steel rod and fatal crime is a common phenomenon. The rate and crime occurrence areas differ from place to place within the sub-city depending on the socio-economic situation of the respective area. The lack of digital crime map and an automated crime database has a significant negative impact on crime prevention and crime control activities. In order to design well-organized crime prevention and controlling system identification of the hotspot, area is of first priority. Other than these creation of crime awareness among the stakeholders and making the people participatory in community policing is essential. In addition, once the crime hotspot areas are identified distribution of the police stations and the dispatching number of police staffs was determined easily. Once these areas are identified, GIS-based crime map has to be prepared. However, no research has been conducted at Mekelle city with regard to GIS-based crime map and analysis so we fill this gap. Therefore we identify crime hotspot areas; determine their temporal and special locations and the physical cause’s crime incident hotspot Mekelle city and all sub cities.
Materials and Methods
Description of the study area
Mekelle city is the capital city of Tigray regional state, Ethiopia. The city was located 783 km from Addis Ababa capital city of Ethiopia, it is found between latitude 13°28’0’’ N to 13°30’30’’N latitude and 39°28’0’’ E to 390 55’ 8’’ E longitude with altitude of 2070 meter above sea level and the area covers 322 km2 show in Figure 1. Its municipality is believed to have been established in the early 1940s. Administratively, Mekelle is divided into seven sub-cities namely Kedamay Weyane sub-city, Adihaki sub-city, Ayder sub-city, Hadinet sub-city and its extension, Hawelti sub-city, Quiha sub-city and Semen sub-city and its extension.
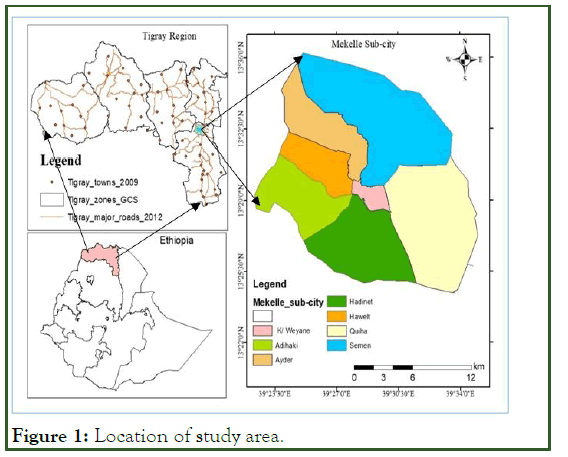
Figure 1: Location of study area.
Data collection and analysis
Qualitative and quantitative data were collected from both primary and secondary sources. The primary data were obtained by the means of locating the crime accident spots of the city using Global Position System (GPS) and ‘add place mark’ tool in Google Earth and through interviews made with key informants form Tigray region police commission and Mekelle city police officers. In addition to this, the secondary data (hard copy) were collected from the Mekelle police station office-recording file and reported from last 10 years.
Primary data: The sources of the primary data for this research was Ground control truth data/coordinate of divisional police stations in kedemay weyane, as input for identifying of crime area hot spot, were collected using Global Positioning System (GPS) from the. In addition, Focus Group Discussion (FGD) with different centers like police station officers commanders and crime control and crime analysis experts, bar owner’s, hotel, night club and other trade owners, administrative officers, Mekelle community people there were used taxi and bajaj as well as drivers associations. The group desiccations were selected from community living in Mekelle city and have a position from Mekelle police offices based on their approaches and knowhow to the crime area.
Secondary data: The secondary data sources were collected from different offices and police stations as shown the following parts:
• Administrative boundary shape file map of for Mekelle city was found from the municipality urban planning offices.
• Bas map and road network layers (shape file) of Mekelle-city and road shape-files was obtained from the Mekelle city municipality department of surveying and GIS.
• Crime data recorded and related information was obtained from each sub-city police station and police community.
• Other relevant information was obtained from published journals and articles as well as available materials from the department of surveying and GIS of Mekelle-city office.
The projection datum used for the implementation of the research was WGS 84 which was the standard used to overlay various datasets as generated during the mapping process.
Data analysis
In order to achieve the objective of this study, an appropriate method and real-time data are important. GIS also the best tool used to store, analyze, manipulate and present patterns to the spatial and statistical analysis especially to identify the distribution of crime hotspot area. This study similarly used spatial data Ground Control Point (GCP) and Mekelle city boundary (shape file) data and statistical recorded data.
Finally, the maps were created (developing) reclassified with different analysis fields from GCP and attribute table and the methodology was explained in the following flow chart (Figure 2).
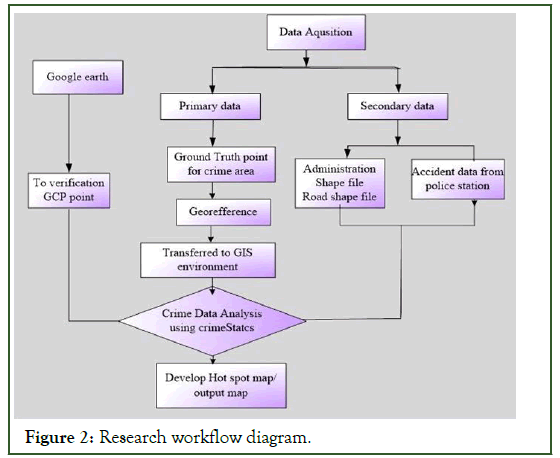
Figure 2: Research workflow diagram.
Results and Discussion
Temporal and spatial crime distribution
There is a graphical fluctuation of crime record between the 2010, 2011, 2012, 2013, 2014, 2015, 2016, 2017, 2018 and 2019 years corresponding respectively. The total numbers of criminal offenses were analyzed separately in relation to the study area respectively. In the below Table 1 shows the total crime recorded in Mekelle city obtain from Mekelle police stations.
| Years | ||||||||||
|---|---|---|---|---|---|---|---|---|---|---|
| Sub-city | 2010 | 2011 | 2012 | 2013 | 2014 | 2015 | 2016 | 2017 | 2018 | 2019 |
| Hawelti | 555 | 664 | 456 | 228 | 276 | 263 | 234 | 190 | 362 | 287 |
| Semen | 298 | 418 | 276 | 241 | 186 | 234 | 162 | 155 | 161 | 248 |
| Ayder | 397 | 427 | 369 | 242 | 243 | 230 | 177 | 154 | 191 | 248 |
| Hadnet | 365 | 534 | 456 | 260 | 185 | 252 | 243 | 174 | 201 | 265 |
| Adi-Haki | 287 | 292 | 199 | 106 | 100 | 79 | 73 | 102 | 95 | 127 |
| K/Weyane | 2508 | 1897 | 1190 | 951 | 590 | 593 | 460 | 469 | 607 | 602 |
| Quiha | 376 | 484 | 221 | 114 | 95 | 84 | 84 | 77 | 116 | 118 |
| Total | 4786 | 4716 | 3167 | 2142 | 1675 | 1735 | 1433 | 1321 | 1733 | 1895 |
Source data: Mekelle zone police office.
Table 1: Number of crime recorded in Mekelle city police offices 2010-2019.
Types of crime reported by Mekelle city and sub-city
There are various types of crime events in Mekelle city and each sub city as reported by the Mekelle zone police office for the period 2010-2019 showed that a total crime occurred was twentyfour thousand five hundred and seven (24507) cases. Commonly as shown in the Table 2 below it was category into six (6) major types of crime those are acts leading to death, acts causing harm, injuries acts of a sexual nature, property involving violence, acts involving fraud and public safety and state security.
| Crime type | 2010 | 2011 | 2012 | 2013 | 2014 | 2015 | 2016 | 2017 | 2018 | 2019 | Total |
|---|---|---|---|---|---|---|---|---|---|---|---|
| Acts leading to death | 1448 | 1265 | 843 | 434 | 360 | 439 | 382 | 379 | 500 | 211 | 6261 |
| Acts causing harm | 297 | 301 | 274 | 164 | 135 | 142 | 124 | 137 | 163 | 447 | 2184 |
| Injurious acts of a sexual nature | 47 | 24 | 55 | 37 | 40 | 49 | 49 | 36 | 47 | 56 | 440 |
| Property involving violence | 2764 | 2324 | 2171 | 1346 | 1001 | 938 | 766 | 669 | 904 | 859 | 13742 |
| Acts involving fraud | 215 | 224 | 273 | 149 | 131 | 144 | 101 | 89 | 103 | 264 | 1693 |
| public safety and state security | 15 | 18 | 15 | 12 | 8 | 23 | 11 | 11 | 16 | 58 | 187 |
| Total | 4786 | 4156 | 3631 | 2142 | 1675 | 1735 | 1433 | 1321 | 1733 | 1895 | 24507 |
Table 2: Types of crime 2010-2019.
Comparison of type of crime between the year 2010-2019
At this point of the crime, analysis was natural asking why do we observe parallel tendencies in the Mekelle city between the study period 2010-2019, which types of crime increased and which types of crime decreased using the historical data like acts leading to death decreased 1237 in number 2019 from 2010, acts causing harm increased to 150 in number 2019 than 2010, Injuries acts of a sexual nature also increased by 9 number in 2019 than 2010, property involving violence decreased by 1905 in 2019 than 2010, acts involving fraud increased by 45 number in 2019 when it was compared with 2010 and the last type of crime was public safety and state security this also increased by 43 number in 2019. Generally, as we are discussed with inspector Abeba the expert of crime recording and analysis, she was said that the crime events now differ from time to time this means that it is very systematic and difficult to easy control and analysis as shown the below Figure 3 graphical fluctuation of the crime data recorded between 2010-2019 and collected from police station.
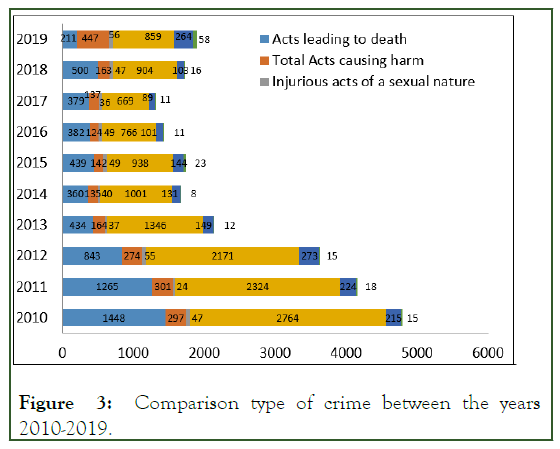
Figure 3: Comparison type of crime between the years 2010-2019.
Map of crime point location distribution
By observing and analyzing the crime data of Mekelle, city and sub-city the data collected from the ground according to the study area boundary for hotspot analysis as showing in the Figure 4. According to the police stations recorded, we were collected 569 crime point from the ground it was happened place respectively. So, each point was discussed and analysis to show the exactly location point map of Mekelle city for the period 2010-2019 with a boundary.
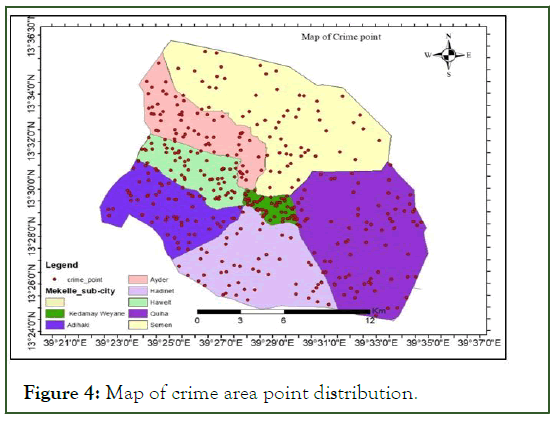
Figure 4: Map of crime area point distribution.
Crime hotspot mapping analysis: Although the location point where a crime occurred equally crucial is the characteristic of those places and the environment in which the crime takes place. The term hotspot has become part of the crime analysis vocabulary and has received a lot of attention. A hotspot is a condition indicating some form of clustering in a spatial distribution [17]. GIS helps and analyze crimes in many different ways. The most significant use is to visualize crime occurrences. This allows law enforcement agencies to understand where crime is occurring as well as determine if there are any patterns. Areas of high crime density are known as hot spots. Hot spot analysis is a valuable tool as it allows police to not only identify areas of high crime but also explore variables that are affecting crime patterns. Crime hotspot is widely referred to as areas of Mekelle city as shown in figure 13 high hotspot area in the red colors. A crime hotspots map represents the high-crime density area and the result of a typical hot spot analysis helps the law enforcement authorities, the police and other relevant professionals such as town planners and city management officials to identify high crime areas. Therefore, the areas of high crime density are to visualized known as hot spots areas. In context, the red color was high crime hotspot point area, especially around the old bus station lines, are hotspot lines as shown in Figure 5.
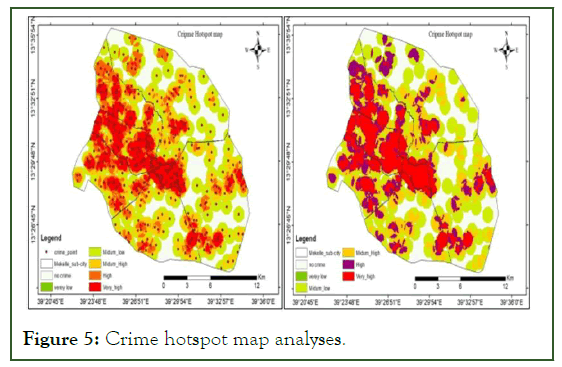
Figure 5: Crime hotspot map analyses.
Generation of multiple ring buffers analysis map: Crime is a human phenomenon, generating data for it involves the integration of the people and the existing security outfits (police) within the geographical location where the study is carried out. This type of analysis creates multiple buffers at specified distances around the input features. These buffers can optionally be merged and dissolved using the buffer distance values to create non-overlapping buffers. The criminal activities in the Mekelle city to visualize and provide in crime incidence between 200 m and 400 m distance from the police station location was recorded as shown in Figure 6 this further reveals that the pattern of crime occurrence changes with varying distances around the districts. Proximity of crime with outpost police station found to be high because hotspot areas establish in 400 to 600 meters buffer zone of Mekelle city police station offices. The area of overlap of hotspots buffer reveal high risk of crime in those areas. The fact that most police stations are located within the area of multiple overlap buffers shows that the police are not fully in control of the area under their jurisdiction. This buffer around the police stations has shown areas of lack in terms of security outfit, and it has shown the distance it takes a police to move from one hotspot to the other. In the same vein, the situation described also reveals that police can be dispatched to hotspot strategically unlike the use of trial and error. Finally, the study has proved that GIS can give a better synoptic perspective to crime study, analysis, and mapping, thus acting as decision support system. According to the buffer simply means beginning a distance of equal radius about a wonder of interest such as crime hotspot.
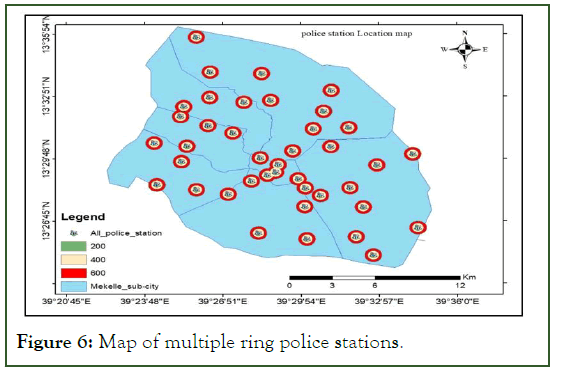
Figure 6: Map of multiple ring police stations.
Comparison of semen sub-city and each Kebeles: This implies that, semen sub-city was recorded the crime happened by the sub-city level, generally from the total recorded 2010-2019 data it was the highest number recorded in 2011 in number 418 as shows in Figure 12 relatively to each Kebeles (Tabita) in Kebele Meles was highly occurred, but the other period was similarly like 2012 276, 2013 241, 2014 186, 2015 324, 2016 162, 2017 155, 2018 161 and 2019 248 numbers.
According to questioner respondent in this Kebele was high population and business area and some area was not cover by the police community and Manisha especially in the night (Figure 7).
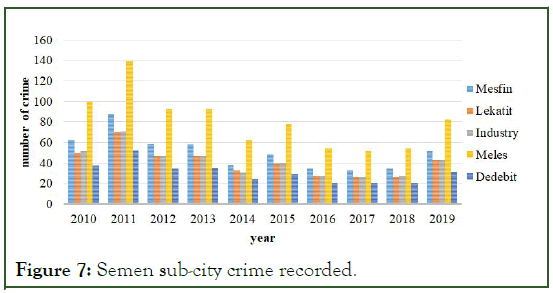
Figure 7: Semen sub-city crime recorded.
Comparison of Ayder Sub-city and each Kebele: In this point toward that, in Ayder sub-city was recorded the crime occurred by the sub-city and each Kebeles, Mostly from the total recorded 2010-2019 data was the highest number recorded was 2010, 2011 and 2012 in number, 427 and 369 as show in the blow Figure 8, but then again I the period was similarly in 2013 242, 2014 243, 2015 230, 2016 177, 2017 154, 2018 191 and 2019 248 numbers of crime recorded.
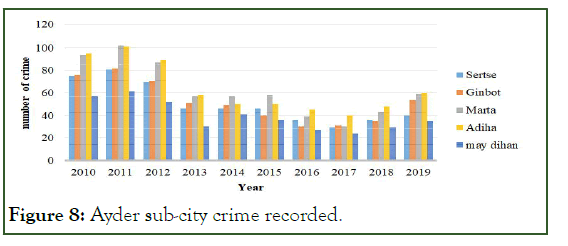
Figure 8: Ayder sub-city crime recorded.
Comparison of Hawolti Sub-city and each Kebeles: In the Hawolti sub-city were has crime recorded highly in 2010 and 2011, 555 and 664 in number in Kebele hidasse that means this area was more people and vehicles corroded than other Kebeles in the sub-city. Therefore, generally as shown in Figure 9 in most of the all year Hidasse kebels was the highest crime recorded.
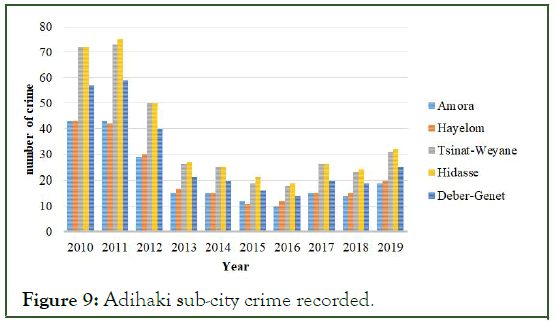
Figure 9: Adihaki sub-city crime recorded.
Comparison of Adihaki Sub-city and each Kebeles: In Adihaki sub-city was have crime recorded highly in 2010 and 2011, 287 and 292 in number in Kebele hidasse and Tsinat Weyane that means this area was more people and vehicles crowded than other Kebeles in the sub-city. So, generally as shown in below Figure 10 in most of the all year Hidasse Kebeles was the highest crime recorded.
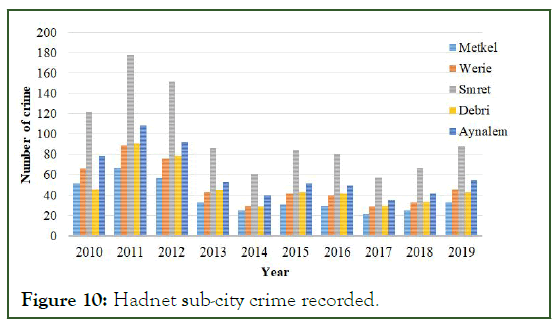
Figure 10: Hadnet sub-city crime recorded.
Comparison of Hadinet sub-city and each Kebeles: Hadinet sub-city was have crime recorded highly in 2011 and 2012, 534 and 456 in number the most of the crime occurred in Kebele Simret that means this area was more people and vehicles crowded than other Kebeles in the sub-city. Therefore, generally as shown in Figure 11 in most of the all year Hidasse kebels was the highest crime recorded.
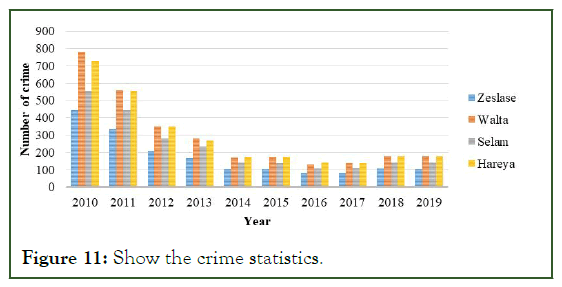
Figure 11: Show the crime statistics.
Comparison of Kedemay weyane sub-city and each Kebeles: Kedemay weyane sub-city is one of the highest recorded crime hotspot as we can describe in the above this area was the main heart bit of Mekelle city business centers and it was crowded by peoples and vehicles especially at the evening time from this reason, the crime recorded in all years it is own 2010, 2508, 2011 1897, 2012 1190, 2013 951 and so on. Therefore, we can accomplish from this data recorded in Kedemay weyane sub-city was high criminal’s area (Figure 12).
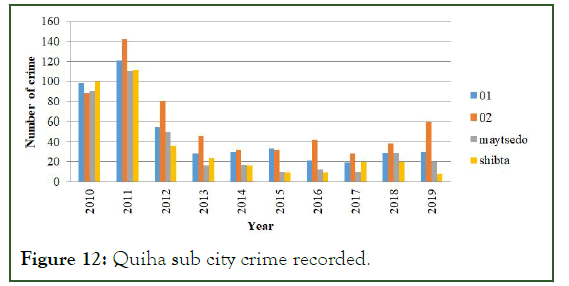
Figure 12: Quiha sub city crime recorded.
Comparison of Quiha Sub-city and each Kebeles: Quiha subcity is one of the low recorded crime hotspot as we can describe in the below Figure 13. The highest crime was recorded in 02 Kebele and the lowest at in shibta Kebele throughout the study years (2010 to 2019).
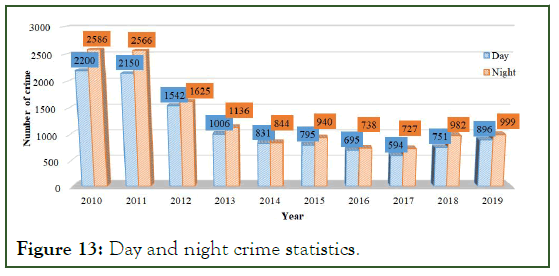
Figure 13: Day and night crime statistics.
Socio-economic and crime distribution trend Analyses
This section compares the different crime type trends for the year 2010-2019 in different scenarios with the crime type trends like type work, level of age and education in the categorized.
Therefore, a high crime in 2010 and 2011 (654 and 400) unemployed criminals and 551 and 579 daily labor in the same year the blue line shows the data from 2010 unemployed line and the orange line shows farmer this is very low line in all year. However, most the crime was decreased relatively as compared with to binging year data.
Day and Night Crime statistics from Mekelle police station: The purpose of this task to determine the temporal pattern of crime recorded in Mekelle city and seven sub-cities where describe according to the time. In addition to this, information collected from some police station (key informants in this study) have added that most of the crime as we shown in Figure 14 happened in nighttime. Therefore, crimes are indications dependent of the time those days and nighttime in all years recorded by the police station of Mekelle city. The couse was most of the area located in bar house, hotels and nightclubs. Therefore, by this reason, it was happened in the nighttime that means low self-esteem, alcohol and drug abuse can be connected to whey break the law. Some are at greater risk of becoming offenders because of the circumstances into which they are born.
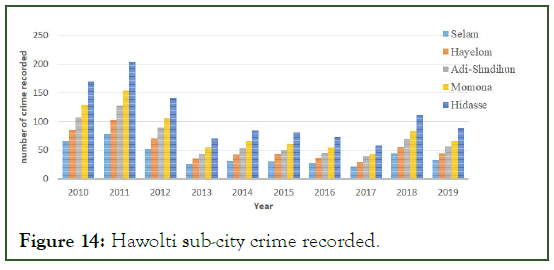
Figure 14: Hawolti sub-city crime recorded.
The physical causes of crime recorded in Mekelle city
As to responses from the sample respondents, documents analysis as well as scholars, there are many physical cause for crime occurred, but we stated tha t uniform one question related to four types of causes. As has been pointed out in previous parts, it is advises to participate the respondents on the crime incidents. In this regards, as Table 3 shown, the highest crime recorded in the physical cause about 19 (33.3%) of the respondents were a happened in no light area and this is the highest records, 15 (26.32%) shows occurred on bar and club nights area this is also the second recorded, 14 (24.56%) also displays on the taxi station area and the last recorded was 9 (15.79%) of the data shows in rainfall time happened.
| questions | Frequency | Percent % | |
|---|---|---|---|
| What is the physical causes to more crime recorded happen from time to time in your sub-city? | No light area | 19 | 33.30% |
| Rainfall time | 9 | 15.79% | |
| Taxi station area | 14 | 24.56% | |
| Bar and club night area | 15 | 26.32% | |
| Total | 57 | 100 |
Table 3: Physical causes of crime recorded from respondents.
According evidence obtain from the key informant, and discussed with people of each sub-city and police stations expert of crime control response to the question one and group discussion seem to have different perception towards to the crime incidents on the Mekelle city. According we are discussion with vice commissioner Tizazu in Mekell zone police and commander Fitsum from Mekell zone information flow-up they said that the crime was happened in three things those are criminals, targeted and apperchinitys are always existing in many places called crime occurred. Therefore, in Mekelle city have those three things each sub-city and station. From the above table result, in perspective of sub-city residents and policies, most of the people have actively participated to control each local community.
Conclusion
This study was carried out to describe the characteristics of crime, map places of frequent hotspot, examine the trend of crime, identify major causes of crime occurred, analyze the socioeconomic impacts of the crime happened in terms of time and space and propose appropriate involvements which could help to reduce crime in Mekelle city. This study shows that the frequency and occurrence of crime in Mekelle city exhibits variations because of the impact of various variables like unemployment and migrated from the surrounding Mekelle city. Crime accidents are randomly distributed in the city in terms of time and place. Kedemay Weyane sub city was the exhibit the highest frequency of crime hotspot occurrences. The frequencies of crime, as well as the socio-economic impacts of criminals, have shown a decrement trend in the study period. Among the various reasons causing numerous that means the police station was given to the community training and awareness about the crime in Mekelle city and each sub-city in the past 10 years. Generally, the analysis showed that all crimes was reported (recorded) in Mekelle city police station shows decreased from time to time (2010-2019). Because of police officer was strong to give training to the community. Thus, we believe that this study contributes much to those who need to understand the general characteristics of crime in Mekelle city in terms of time and space and inspire other stakeholders to conduct further studies in the field. According to mapping crime, using Geographic Information Systems (GIS), allows analysts to identify crime hotspots, along with other trends and patterns. It also tries to introduce the application of GIS on GIS-based crime mapping and analysis.
References
- Anselin L, Cohen J, Cook D, Gorr W, Tita G. Spatial analyses of crime. Crim Justice. 2000;4(2):213-262.
- Martinez J. Teaching and learning quality of life in urban studies: A mixed-methods approach with walking interviews. Teach Qua Differ Doma. 2020:209-229.
- Nyati-Jokomo Z, Dabengwa IM, Makacha L, Nyapwere N, Dube YP, Chikoko L, et al. RoadMApp: A feasibility study for a smart travel application to improve maternal health delivery in a low resource setting in Zimbabwe. BMC Pregnancy Childbirth. 2020;20(1):1-2.
[Crossref] [Google Scholar] [PubMed]
- Capone DL, Nichols WW Jr. Urban structure and criminal mobility. Am Behav Sci. 1976;20(2):199-213.
- Miller AJ, Tewksbury R, Hensley C. College students’ perceptions of crime, prison and prisoners. Crim Justice Stud. 2004;17(3):311-328.
- Amiri AM, Nadimi N, Khalifeh V, Shams M. GIS-based crash hotspot identification: A comparison among mapping clusters and spatial analysis techniques. Int J Inj Contr Saf Promot. 2021;28(3):325-338.
[Crossref] [Google Scholar] [PubMed]
- Braga AA, Papachristos AV, Hureau DM. The effects of hot spots policing on crime: An updated systematic review and meta-analysis. Justice Q. 2014;31(4):633-663.
- Randol BM. Modelling the influence of organisational structure on crime analysis technology innovations in municipal police departments. Int J Police Sci Manag. 2014;16(1):52-64.
- Jefferson BJ. Predictable policing: Predictive crime mapping and geographies of policing and race. Ann Assoc Am Geogr. 2018;108(1):1-6.
- Mishra AJ, Patel AB. Crimes against the elderly in India: A content analysis on factors causing fear of crime. Int J Crim Justice Sci. 2013;8(1):13-23.
- Harirforoush H, Bellalite L. A new integrated GIS-based analysis to detect hotspots: A case study of the city of Sherbrooke. Accid Anal Prev. 2019;130:62-74.
[Crossref] [Google Scholar] [PubMed]
- Ratcliffe JH. Crime mapping and the training needs of law enforcement. Eur J Crim Policy Res. 2004;10:65-83.
- Kaufmann PM. Admissibility of neuropsychological evidence in criminal cases. Clinical neuropsychology in the criminal forensic setting. 2008;28:55-90.
- Ferreira J, Joao P, Martins J. GIS for crime analysis: Geography for predictive models. Electron J Inf Syst Eval. 2012;15(1):36-49.
- Ristea A, Leitner M. Urban crime mapping and analysis using GIS. ISPRS Int J Geo-Inf. 2020;9(9):511.
- Balogun TF, Okeke H, Chukwukere CI. Crime mapping in Nigeria using GIS. J Geogr Inf Syst. 2014;6:453-466.
- Yang B. GIS crime mapping to support evidence-based solutions provided by community-based organizations. Sustainability. 2019;11(18):4889.
Citation: Hagos F, Gebyehu A (2023) GIS Based Crime Mapping and Analysis Hotspot in the Case of Mekelle City, Tigray Region, Northern Ethiopia. J Remote Sens GIS. 12:291.
Copyright: © 2023 Hagos F, et al. This is an open access article distributed under the terms of the Creative Commons Attribution License, which permits unrestricted use, distribution, and reproduction in any medium, provided the original author and source are credited.
