


Indexed In
- Open J Gate
- RefSeek
- Hamdard University
- EBSCO A-Z
- OCLC- WorldCat
- Publons
- International Scientific Indexing
- Euro Pub
- Google Scholar
Useful Links
Share This Page
Journal Flyer

Open Access Journals
- Agri and Aquaculture
- Biochemistry
- Bioinformatics & Systems Biology
- Business & Management
- Chemistry
- Clinical Sciences
- Engineering
- Food & Nutrition
- General Science
- Genetics & Molecular Biology
- Immunology & Microbiology
- Medical Sciences
- Neuroscience & Psychology
- Nursing & Health Care
- Pharmaceutical Sciences
Research Article - (2025) Volume 14, Issue 2
Geo-spatial Analysis for Estimation of Land surface Temperature change using Remotely sensing Imageries on Raya Alamata and Raya Azebo woredas southern Tigray, Northern Ethiopia.
Fikre Hagos1*, Yemane Kahsay2 and Hagos Heshe32Department of Climante and Society, Institute of Climate Science, Tigray, Ethiopia
3Department of Electrical and Computer Engineering, Ethiopian Instiute of Technology, Tigray, Ethiopia
Received: 30-Mar-2024, Manuscript No. JGRS-24-25319; Editor assigned: 02-Apr-2024, Pre QC No. JGRS-24-25319 (PQ); Reviewed: 16-Apr-2024, QC No. JGRS-24-25319; Revised: 14-Apr-2025, Manuscript No. JGRS-24-25319 (R); Published: 21-Apr-2025, DOI: 10.35248/2469-4134.25.14.379
Abstract
The aim of this study was the surface temperature compute and NDVI value changes from 2015 to 2023 and also to correlation for surface temperature and NDVI values in study area for respectively years. Surface temperature and NDVI values were taken out from the remotely sensed data (Landsat 8 Operational Land Imager (OLI)) and Thermal Infrared Sensor (TIRS) band 10 100 m resolution for 2015 and 2023 were used. Those data was downloading from USGS using (Path-168 and Row-51) freely. The results of this study were -0.1565 to 0.5605 and -0.550 to 0.5082 for the respectively year. The NDVI value was mostly a sign that uses (NIR) bands to measure healthy vegetated areas. The surface temperature output represented from the low to high values 24.884℃ to 46.853℃ and 24.247℃ to 47.562℃ respectively study years. The surface temperature was traced in the southern of Tigray Raya Alamata and Raya Azebo woredas increased to 0.709℃ in 2023 from 2015. The R2 for the NDVI value and ST correlations values identified 96.34%, 95.87% 2015 and 2023, correspondingly due to the NDVI value differences for disturbed the years. Normally, absorb the healthy vegetation area’s reflected a large portion of the NIR to space. Significant procedures were to be alarmed to gain the effective control surface temperature on the study area. Based on Normalized Difference Vegetation Index (NDVI) classification were used to calculate the vegetation area. Based on the surface emissivity on NDVI was used to retrieved the final surface temperature.
Keywords
Surface temperature; NDVI; Landsat 8 OLI
Introduction
The surface temperature is directly connection with the earth temperature using determining instrument usually measured in °C. Surface temperature was the earth’s crust where the heat and radiation from the sun absorption and reflectance. It was a change in climatic condition and other human activities where the exact expectation becomes challenging [1]. Earth temperature is one of the main variables; refer to surface processes and states severe in investigations of hydrology, weather, environmental science and human health [2]. In remote sensing, there are many satellites equipped with sensors operating within the infrared heat range [3]. Identification and characterization of the Heat Island (UHI) is typically based on surface temperature that varies spatially, due to the nonhomogeneity of land surface cover and other atmospheric factors. The surface temperature has increased due to the conversion of land use change to no evaporating surfaces. There are many studies in this area in different country by different method. However, few studies have been carried out to estimate of climatic parameters for urban climatology (LST) in Ethiopia. According to Bedada, these research articles investigate the relation between LST and NDVI by using landsat in Addis Ababa city. Because various land surfaces temperature emit and absorb energy radiation in different ways, they have been studied in order to determine LST. Land Surface Temperature (LST) and emissivity for large area can only be derived from surfaceleaving radiation measured by satellite sensors [4]. LST is the key factor for calculating highest and lowest temperature of a particular location. LANDSAT 8 carries two sensors, i.e., the Operational Land Imager (OLI) and the Thermal Infrared Sensor (TIRS). OLI collects data at a 30 m spatial resolution with eight bands located in the visible and near-infrared and the shortwave infrared regions of the electromagnetic spectrum and an additional panchromatic band of 15 m spatial resolution. TIRS senses the TIR radiance at a spatial resolution of 100 m using two bands located in the atmospheric window between 10 and 12 μm. In this study, NDVI and LST were found to be closely correlated in NDVI categories, especially in vegetated areas. Decrease of biomass primarily triggered on LST [5].
Recently, some investigations found the relationship between NDVI and vegetation abundance to be nonlinear. And this nonlinearity recommends NDVI may not be a competent indicator for quantitative analyses of vegetation. So, the relationship between the LST and NDVI should be further calibrated. And seeking a more suitable and robust vegetation abundance indicator to supersede NDVI in Vegetation-LST relationship study should be placed more emphasis [6]. In the study used satellite data investigate the relationship between Land Surface Temperature (LST) and vegetation in the area. In our area no research conducted specifically focused on geospatial analysis for estimation of land surface temperature using remote sensing data. Therefore, we are provide to this reason, we have the following objectives, to calculate DN to spectral radiance, brightness temperature, mapping of Normalized Difference Vegetation Index (NDVI), to retrieve land surface emissivity from Visible Near-Infrared (VNIR) data and to retrieve Land Surface Temperature (LST) map from thermal bands [7].
Materials and Methods
Description of study area
Location: The area was situated in southern zone Tigray national regional state. The Raya-Alamata and Raya Azebo Woredas geographically located between 12010’ 0’’ to 130 0’ 0’’ north and 390 20’ 0’’ to 390 50’ 0’’ east longitude, in northern Ethiopia. Though bi-modal, the annual rainfall also varies widely in space and in time. The area covers 2159.07 km2. The areas also received annual average rainfall between 450 mm and 700 mm. Elevation of the area between 1036 and 3225 (Figure 1).

Figure 1: Location of the study area.
Design the study
Land Surface Temperature (LST) estimation was produced from the thermal bands and lastly the results are combined to relationship LST and NDVI values. The flow chart represents the method that was used in this study (Figure 2). It demonstrates the processes taken to extract the required information, beginning with the acquisition and classification of a multi-temporal satellite image. Finally, relationship analysis NDVI and ST was performed.

Figure 2: Methodological flow chart.
Data collection and analysis
Methods of data collection: The remote sensing data was available in USGS (United States Geological Survey) earth explorer website at free of cost. When we were using those path and row 169/051uring the month January for 2015 and 2023 years relativity free has and cloud downloaded. The TIR bands 10 were used to estimate brightness temperature and bands 4 and 5 were used to generate NDVI of the study area. Landsat 8 provides metadata of each band such as thermal constant, rescaling factor value etc. which can be used for calculation brightness temperature, NDVI values and LST (Table 1).
| Bands | Wavelength (micrometers) | Resolution in meter |
|---|---|---|
| Band 4 Red | 0.636-0.673 | 30 |
| Band 5 NIR | 0.851-0.879 | 30 |
| Band 10 TIR-1 | 10.60-11.19 | 100 |
Table 1: LANDSAT 8_OLI and TIRS.
Following meta data values are used for calculation.
Radiance add band 10=0.10000
Radiance multi band_10=0.0003342
K1 constant band 10=774.8853
K2 constant band 10=1321.0789
Method of data analysis: There are several steps or analytical procedures to be followed in order to conduct LST estimation and analysis. Conversion of DN values into top of atmosphere radiance is the first step in land surface temperature estimation. In this algorism all, the satellite data were geometrically corrected and band 10 was used as an input data. In this activity radiance, rescaling factor is very important to retrieve the Top of Atmospheric (TOA) spectral radiance from thermal infra-red digital numbers. In order to estimate the land surface temperature from the thermal infrared band, DN of sensors is converted to spectral radiance using the following equation [8].
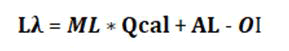
Where,
ML represents the band specific multiplicative recalling factor
Qcal is the band 10
AL is the band specific additive rescaling factor
OI is the correction value for band 10
Conversion of radiance to brightness temperature: After spectral radiance was converted to radiance, the raw DN of the thermal bands are converted to Brightness Temperatures (BT) using the thermal constants given in the metadata, which is the effective temperature viewed by the satellite under an assumption of uniform emissivity [9]. If the result is in kelvin we should be to convert to in celsius, it is necessary to revise by adding absolute zero which is approximately equal to -273.15. Since the atmosphere in our research is comparatively dry and therefore, the range of water vapor values is relatively small, the atmospheric effect is not taken into consideration in retrieving the LST. The equation used to convert reflectance to brightness temperature [10].
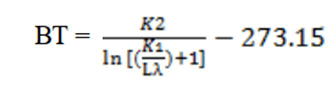
Where:
BT=Top of atmosphere brightness temperature (°C)
Lλ=TOA spectral radiance (Watts/(m2*sr*μm))
K1=Band specific thermal conversion constant (K1_ constant_Band 10, thermal band)
K2=Band specific thermal conversion constant from the metadata (K2_ constant_Band 11, thermal band)
ln=natural logarithm
Normalized difference vegetation index: We were used to calculate the NDVI value for the study area for 2015 and 2023. The normalized difference vegetation index is also used to predict general vegetation conditions and calculate the LST. The red band (high absorption of radiation or low reflection) and the infrared band (low absorption of radiation or high reflection) were used to calculate the NDVI. Green leaves have a reflectance of 20% or less in the 0.5 to 0.7-micrometer range and about 60% in the 0.7 to 1.3 range [11]. Therefore, NDVI values represent ratios ranging from -1.0 to 1.0.
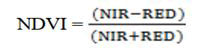
Where:
RED=DN values from the red band (Band 4)
NIR=DN values from near-infrared band (Band 5)
The next step is calculating Proportional vegetation (Pv), this was done using the normalize difference vegetation index values or result obtained in the above step. This proportional vegetation helps to estimate the area under each land cover type in the study area. [12]. Thus, Proportional vegetation (Pv) can be calculated using the following equation.
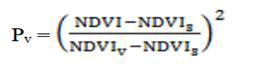
Where:
PV=Proportion of vegetation
NDVI=DN values from the image
NDVI min=Minimum DN values from the image
NDNI max=Maximum DN values from the image
Land surface emissivity: The Land Surface Emissivity (LSE (ε)) must be known because LSE is a proportional factor that scales blackbody radiance to predict emitted radiance. In satellite images, pixels representing the land surface are usually mixed pixels; they are a combination of surfaces-types such as water, vegetation and soil. Therefore, the effective emissivity of a pixel can be calculated by summing up the contributions from those surface types because the emissivity value changes from surface to surface. Land surface emissivity is the earth's average surface factor emissivity determined from the standardization of vegetation index values for variations. Corrections for emissivity (e) have applied to the radiant temperatures according to the nature of land cover. Though to estimate the emissivity from satellite thermal band quite a lot of methods have been suggested, the NDVI threshold method was used in this study [13]. Land surface emissivity was calculated via the following formula.
Where:
E=Land surface emissivity
EVλ=Emissivity of vegetation
ESλ=Emissivity of soil
PV=Proportion of vegetation
Cλ=Surface roughness taken as a constant value of 0.005
Where εv and εs are the vegetation and soil emissivity respectively, C is the surface roughness taken as a constant value of 0.005. Studies conducted by Jose A. show that the emissivity of water bodies is utmost stable in comparison with land surfaces. Since the emissivity depends on the wavelength, the normalize difference vegetation index can be used to estimate the emissivity of different land surfaces in the 10 μm-12 μm range [14]. Then, we calculating Land Surface Temperature (LST) are the final steps in this algorism. The surface temperature value of the study area can be calculated as this equation.
LST=TB/(1+( λ*TB/c)∗ ln(e))
Where: BT=Brightness value of atmospheric temperature (°C), W=Wavelength of emitted radiance in meters (for which the peak response and the average of the limiting wavelengths (λ=11.5l m).
Validation of retrieved surface temperature
As the earth's surface temperature is determined from thermal remote sensing datasets utilizing dynamic methods and underlying hypotheses regarding atmospheric parameters, it is also important to determine its precision, which is beneficial for both consumers and engineers. According to Zhao, normal land surface temperature products of the same region and same time span can be used to confirm the obtained surface temperature values [14]. Yet due to the complex existence of land surface temperature, both spatially and temporarily, ground-based values cannot be obtained to cross validate the temperature of the collected surface. Furthermore, owing to the non-availability of observed surface temperature details, the cross-validation technique was used to confirm the recovered surface temperature of the earth; thus we used regular data sets of Landsat 8-OLI earth surface temperature products with precision within 1°K range to confirm the earth surface temperature of Landsat 8 satellite image [15].
Results and Discussion
The present study has been conducted on agricultural area, vegetative, settlement and urban area. The level of vegetation coverage also have factor for the temperature increasing. The value of NDVI is also divided in to vegetated area, semi vegetated and areas. Normally the value of NDVI range from positive 1 to negative -1. The middle values is approximately zero values represent non-vegetated lands while positive values represent vegetated area. The NDVI result to show the distribution of the vegetation in the study area coverage from 2015 to 2023 respectively [16]. The Land Surface Temperature (LST) is radiates temperature which calculated using top of atmosphere brightness temperature, wavelength of emitted radiance, land surface emissivity.
The results of TOA atmospheric spectral radiance calibration
The result of the thermal infrared image of the band 10 in which converted to the radiance as show in Figure 3 radiance for 2015 and 2023 the highest value from 12.090 to 7.785, 12.221 to 4.960 respectively in °C. So, according to this results in 2015 the min radiance is higher than 2023.

Figure 3: Radiance map for 2015 and 2023.
The brightness temperature map
The result of satellite temperature as showing in Figure 4 the brightness temperature is derived from the Landsat 8 for 2015 and 2023 year. So, we show the results data band 10 thermal images has the BT values 13.3893°C to 43.2189°C, 18.9383°C to 44.0202°C from the low to high value is cover for the study areas.

Figure 4: The value of brightness temperature 2015 and 2023.
Normalize difference vegetation index map
The output value of NDVI ranged between 0.1578-0.5606, 0.0575-0.4620 for 2015 and 2023 respectively show in Figure 5. Higher value of NDVI shows the more dense vegetation (plantation), respectively. The NDVI is mainly an indicator that utilizes the Near-Infrared (NIR) bands in the electromagnetic spectrum to assess and analyze healthy vegetated areas. Generally, healthy vegetated areas absorb most of the sun's visible light and reflect a large portion of the NIR to space [17]. On the other side, barren soils reflect moderately in both the NIR and the red portion of the electromagnetic spectrum. So, negative values usually represent water body, around zero represent barren soil, whereas values over 0.5 usually represent green vegetated areas. As indicated in Figure 5 vegetation cover has decreased and the non-vegetated area has been increasing gradually over the study period 2023. However, in 2023 both in rural and urban areas have low NDVI values.

Figure 5: NDVI values for 2015 and 2023.
Land surface emissivity
Mean of land surface emissivity was produced using NDVI threshold technique Figure 6. The LSE of Raya Alamata and Raya Azebo area ranged between high 1.1574 and low 1.0632, high 0.9870 and low 0.986 in 2015 and 2023 respectively mean of this 1.1103 and 0.9865 for 2015 and 2023 [18]. The area ranged between highly elevated regions in the area had more vegetative cover; hence LSE was high in these regions. High LSE was found in east to west parts of the study area, whereas low LSE was noticed in northwest and southwest of the study area.
E=0.004*PV+0.986
Where:
E=Land surface emissivity
PV=Proportion of vegetation

Figure 6: LSE map for 2015 and 2023.
Surface temperature analysis
Important in the variation of the land surface temperature as well as specific analysis from the thermal bands. Land surface temperature 2015 and 2023 output represented that show in Figure 7 the lower LST 24.884°C to 46.853°C and 24.247°C to 47.562°C respectively years. Then, as show in Figure 8 we are reclassify in to 4 groups. From the low to the higher values. LST was traced in the southern of Tigray Raya Alamata and Raya Azebo woredas under cultivable land in the plains. So, we see in the Figure 7 the surface temperature is increased to 0.709°C in 2023 than 2015.

Figure 7: Surface temperature map for 2015 and 2023.
Surface temperature and NDVI correlation
From Landsat 8 thermal bands 10 and 11 for 2015 and 2023 have shown that NDVI values and ST values obtained from the Thermal bands for 2015 and 2023 had indicated indirect relationships between them. The area has low NDVI values had high ST. However, the relationship between NDVI and ST showed direct/positive relationship for water body, because both NDVI and ST values were less for water body. The R2 values for the NDVI and ST correlations indicated 96.34%, 95.87% 2015 and 2023, respectively due to the differences in NDVI value for the years concerned [19,20].
According to Mihai, 2012, NDVI is an acceptable indicator of surface temperature. There are a number of factors contributing to an increase or decrease surface temperature value of the area. According to Gebrekidan, used Landsat imagery for study on Addis Ababa city and analyzed the relationship LST and NDVI and found negative linkage between NDVI and LST values. However, in this case, water body should be considered as except anon as it has low NDVI and LST values.

Figure 8: Correlation NDVI and LST for 2015 and 2023.
Conclusion
To show results for land surface temperature in Raya Alamata and Raya Azebo woredas during the year of 2015-2023 due to natural causes and human activities. The LST of the area appearances to strong variation between ST and NDVI value more vegetated areas. So, the value of ST 24.884 to 46.853 and 24.247 to 47.562°C for 2015 and 2023 year respectively. The NDVI values were shows as from 0.5605 to -0.1565 to 0.5605 and -0.550 to 0.5082 correspondingly for the year of 2015 and 2023. Lastly, the surface temperature and NDVI outcomes shown to better understand spatial variation of the area for consistently 9 years. Therefore, the we suggested that more studies should be conducted with images and sensors of higher resolution and seasonal variation can be measured for the LST and NDVI.
Acknowledgement
The an authors would like to thank you Mekelle university IGEOS and E-ITEM, Tigray Ethiopia for data and technical support to complete this article work.
References
- Warkaye S, Suryabhagwan KV, Satishkumar B. Urban green areas to mitigate urban heat island effect: The case of Addis Ababa, Ethiopia. Int J Environ Sci. 2018;44(4):353-367.
- Barsi. The respecter response of Landsat-8 Operational Land Imajer. Remote Sensing. 2014;10232-10251.
- Damtie BB. Estimation of land surface temperature using Landsat by split window algorithm: A case study in Bahir Dar Zuria, Ethiopia. J Environ Earth Sci. 2017:2224-3216.
- Joshi JP, Bhatt B. Estimating temporal land surface temperature using remote sensing: A study of Vadodara urban area, Gujarat. Int J Geo Earth Env Sc. 2012;2(1):123-130.
- Tomlinson CJ, Chapman L, Thornes JE, Baker C. Remote sensing land surface temperature for meteorology and climatology: A review. Meteorol Appl. 2011;18(3):296-306.
- Anandababu D, Purushothaman BM, Suresh BS. Estimation of land surface temperature using Landsat 8 data. Int J Adv Res. 2018;4(2):177-186.
- Jeevalakshmi D, Reddy SN, Manikiam B. Land cover classification based on NDVI using LANDSAT8 time series: A case study Tirupati region. In2016 International Conference on Communication and Signal Processing (ICCSP). 2016;1332-1335.
- Reddy SN, Manikiam B, Jeevalakshmi D. Land surface temperature retrieval from LANDSAT data using emissivity estimation. Int J Appl Eng Res. 2017;12(20):9679-87.
- Du C, Ren H, Qin Q, Meng J, Zhao S. A practical split-window algorithm for estimating land surface temperature from Landsat 8 data. Remote Sensing. 2015;7(1):647-665.
- Worku G. Modeling land surface temperature from satellite data, the case of Addis Ababa. InES RI, Eastern Africa Education GIS conference. Held at Africa Hall, United Nations conference centre from 2016;23.
- Ghazal N, Hassoon K. Temperature calculation using thermal bands of (ETM+) sensor. Iraqi J Sci. 2012;53(2):435-443.
- Reddy SN, Manikiam B, Jeevalakshmi D. Land surface temperature retrieval from LANDSAT data using emissivity estimation. Int J Appl Eng Res. 2017;12(20):9679-9687.
- Sobrino JA, Jimenez-Munoz JC, Soria G, Romaguera M, Guanter L, et al. Land surface emissivity retrieval from different VNIR and TIR sensors. IEEE Trans Geosci Remote Sens. 2008;46(2):316-327.
- Liu L, Zhang Y. Urban heat island analysis using the Landsat TM data and ASTER data: A case study in Hong Kong. Remote Sens. 2011;3(7):1535-1552.
- Hokao K, Phonekeo V, Srivanit M. Assessing the impact of urbanization on urban thermal environment: A case study of Bangkok Metropolitan. Int J Appl. 2012;2(7).
- Rajeshwari A, Mani ND. Estimation of land surface temperature of Dindigul district using Landsat 8 data. Int J Res Eng Technol. 2014;3(5):122-126.
- Dragomir LO, Petrosani PD, Oncia S. Using satellite images LANDSAT TM for calculating normalized difference indexes for the landscape of Parang Mountains. 2012.
- Tsegaye NT, Melka GA. Land surface temperature detection in relation to land use land cover change: The case of Jimma city and its surroundings, Jimma Zone, Southwest, Ethiopia. 2022.
- Horvath P, Halvorsen R, Stordal F, Tallaksen LM, Tang H, Bryn A. Distribution modelling of vegetation types based on area frame survey data. Appl Veg Sci. 2019;22(4):547-560.
- Pongratz J, Reick CH, Raddatz T, Claussen M. Biogeophysical versus biogeochemical climate response to historical anthropogenic land cover change. Geophys Res Lett. 2010;37(8).
Citation: Hagos F, Kahsay Y, Heshe H (2025) Geo-Spatial Analysis for Estimation of Land Surface Temperature Change using Remotely Sensing Imageries on Raya Alamata and Raya Azebo Woredas Southern Tigray, Northern Ethiopia. J Remote Sens GIS. 14:379.
Copyright: © 2025 Hagos F, et al. This is an open-access article distributed under the terms of the Creative Commons Attribution License, which permits unrestricted use, distribution and reproduction in any medium, provided the original author and source are credited.