


Indexed In
- Open J Gate
- Genamics JournalSeek
- JournalTOCs
- China National Knowledge Infrastructure (CNKI)
- Electronic Journals Library
- RefSeek
- Hamdard University
- EBSCO A-Z
- OCLC- WorldCat
- SWB online catalog
- Virtual Library of Biology (vifabio)
- Publons
- MIAR
- Euro Pub
- Google Scholar
Useful Links
Share This Page
Journal Flyer

Open Access Journals
- Agri and Aquaculture
- Biochemistry
- Bioinformatics & Systems Biology
- Business & Management
- Chemistry
- Clinical Sciences
- Engineering
- Food & Nutrition
- General Science
- Genetics & Molecular Biology
- Immunology & Microbiology
- Medical Sciences
- Neuroscience & Psychology
- Nursing & Health Care
- Pharmaceutical Sciences
Research Article - (2023) Volume 14, Issue 1
Geomechanics Modeling and Tensile Failure in Karstified Dammam Formation
Jawad Alshakban1,2*, Wafaa Al-Shatty3,4, Doaa Albaaji5 and Raffaele Romagnolid11Department Well Construction, Zubair Field Division, Basrah Oil Company, Bab Al Zubair, Basrah, Iraq
2Department of Laboratory and Quality Control, Basrah Oil Company, Bab Al Zubair, Basrah 21240, Iraq
3Energy Safety Research Institute (ESRI), Swansea University, Bay Campus, Swansea SAI 8EN, UK
4Halliburton, Sperry Drilling, Lead Tech Prof. Well Design, Oils Operation Street Dist N°29 Burjesia Area, Iraq
Received: 28-Aug-2022, Manuscript No. JPEB-22-17898; Editor assigned: 30-Aug-2022, Pre QC No. JPEB-22-17898 (PQ); Reviewed: 12-Sep-2022, QC No. JPEB-22-17898; Revised: 04-Jan-2023, Manuscript No. JPEB-22-17898 (R); Published: 13-Jan-2023, DOI: 10.35248/2157-7463.23.14.501
Abstract
Dammam is one of the most tiresome formations that drillers challenge while drilling in the oil fields which located in South of Iraq and North of Kuwait. Therefore, the development of a geomechanical study may play a meaningful role in identifying the causes and establishing appropriate solutions to minimize the drilling cost. This research paper is to define the geostatic stresses, pore pressure, rock mechanical strength, elastic modulus and build one-dimensional mechanical earth model utilizing the most common failure criteria; Mohr-Coulomb, Mogi Coulomb and Stassi d’Alia. The best failure envelopes which anticipated the shear failure are Mogi and Stassi d’Alia in contrast with Mohr, while all criteria accord the same results with respect to the tensile failure. No laboratory test such as triaxial, uniaxial and Brazilian tests are available to be utilized for calibration purposes, for that reason the only log derived parameters have been employed to construct the Mud Window (MW). MW assists determining the maximum mud weight to avoid drilling induced tensile failure while cementing and overbalanced drilling. The same thing regarding the horizontal stresses, no leak of test or hydraulic fracture data are obtainable to match the geostatic horizontal stresses. On the other hand, measured pore pressure at two points of different intervals within the formation was exploited to accommodate the predicted pore pressure. However, many empirical equations are available to define the pore pressure from sonic and resistivity logs as well as from seismic velocity modeling. Eaton sonic technique was the most appropriate equation to anticipate the pore pressure especially at young basins; therefore it was adopted to establish a continuous profile of pore pressure along the Dammam interval.
Keywords
In situ stresses; Pore pressure; Rock mechanical strength; Elastic modulus; Failure criterion; Tensile failure; 1D geomechanics modeling
Abbreviations
MSE: Mechanical Specific Energy; FMI: Formation Micro Imager; MW: Log Mud Window 1D: One; UBT: Ultrasonic Borehole Televiewer; UBI: Ultrasonic Borehole Imager; UCS: Unconfined Compressive Strength; NF: Natural Fracture; SSF: Strike Slip Fault; PP: Pore Pressure; RCI: Reservoir Characterization Instruments
Introduction
In 1941 Bramkamp identified Dammam formation based on Dammam dome in Saudi Arabia. The formation composed mainly of dolomite, limestone, marl and shale, where it encompasses whitish dolomitized, grey and porous limestone [1]. The average thickness of Dammam formation is (± 250 m) (Master log). However, a failure with partial to complete mud loss often occurs during drilling. Ultrasonic Borehole Televiewer (UBT) was processed to recognize whether there is natural fracture, or the mud loss is developing due to drilling induced tensile fracture. Sissakian, et al., indicated that a continuous karstification phenomenon is occurring in Dammam and Um Err Radhuma formation. Karst forms due to the dissolution of some kinds of evaporates and carbonate rocks such as gypsum, limestone and dolomite which may lead to enlarge the drainage system of the porous media and consequently forming of subsurface caves and sinkholes. A considerable sinkhole was generated near Al-Shbicha police post that located in the Southern Iraqi desert with a continuous collapsing in limestone bed for almost 30 days. The shocks of collapsing were felt by the inhabitant who live next to the location of the event. The diameter of the sink hole was 33 m and length of 27 m [2]. This may indicate that the losses which is experienced in dammam formation is due to the presence of natural fractures. Whereas the log derived Unconfined Compressive Strength (UCS) indicates the fragility of the rocks, with a value not exceeding 2000 psi along the depth except for the top and bottom of the formation. Therefore, drilling induced tensile fractures is probably anticipated because of the lithology weakness. Overall, the mud loss in dammam formation remains a matter of concern for the drilling contractors in this formation despite the advanced technology that utilized for mitigation.
High angle echelon shear failure is recognized in dammam interval within the failure criteria, this aspect happens if the minimum principal stress is the tangential stress or well pressure show in Figure 1. According to the geostatic stress’s distribution and Anderson’s fault classification there are intervals with strike slip fault (σH>σv>σh) and the minimum horizontal stress is the minimum principal stress [3]. Furthermore, when the maximum principal stress is vertical, high angle fracture can arise as a result of shear failure and consequently the fracture may extend to envelop more than quarter of the wellbore circumference [4]. In dammam case the σH is the maximum, therefore high angle echelon failure can occur. High angle Echelon is not detected by caliper log because the fragments of rocks are relatively large and accordingly the broken rocks will not fall into the borehole [5]. Interestingly, the shear failure high angle echelon appears only in Dammam and Hartha formations along the vertical section of Southern Iraqi fields. Importantly, both intervals are porous vuggy karstified dolomite with low uniaxial compressive strength which cause partial to total mud loss during drilling.

Figure 1: Shear failure high angle echelon (σa>σr>σt), low angle echelon (σt>σr>σa) and Shear failure shallow knockout (σr>σt>σa).
Moreover, the orientation of the failure is parallel to the direction of the maximum horizontal stress (60°, 240°) as depicted in the figure of the failure criteria. Furthermore, the Brazilian testes stipulate that the shear failure in macrostructure is tensile failure in microstructure. Figure 2 which may help categorizing the shear failure high angle echelon as tensile failure [6]. Dammam formations experience another kind of breakout that is shear failure shallow knockout (Figure 2). It is protracted along Dammam interval in the direction of maximum horizontal stress surrounding the shear high angle echelon.

Figure 2: Shear and tensile failure in Brazilian test and evolution of tensile in microstructure to shear in macrostructure.
This form of breakout develops in radial axial plane when σr>σt>σa. The wellbore micro imager can conveniently detect the failure as vertical profile; it is encountered as green area by failure criteria [7]. On the other hand, drilling induced tensile failure is anticipated through all failure envelopes as vertical plane oriented to the direction of the maximum horizontal stress. In addition, if the radial stress is less than or equal to the Tensile strength (T0) of the formation, cylindrical mode of breakdown may develop (Figure 3). The dynamic T0 of dammam formation is less than 100 psi while the radial stress is higher, therefore the cylindrical tensile failure cannot initiate. Moreover, no indication refers to the presence of breakdown in the horizontal plane because there is no reverse fault along the section according to Anderson’s fault regime classification. This mean that the only failure is experienced in Damam formation is the vertical one.

Figure 3: Cylindrical Shear failure (σr ≤ -T0), horizontal Shear failure (σa ≤ -T0), Vertical Shear failure (σt ≤ -T0), figures modified from.
Many factors govern the generation and allocation of Natural Fracture (NF) such as dilatancy factor, rock mechanical strength differentiation and in situ stresses. Natural fractures may exist in dammam lithology due to the tectonic activities that may generate orthogonal strain with respect to the fracture plane, in addition dolomitization and lithification processes like karstification and digenesis are plausible reason for strength weakening of the rocks. Furthermore, the existence of sharp and wavy bedding plane dictates that the deposited beds occurred in strong currents during transgressing of the sea water; this induced the layers to be laterally discontinuous. Besides, acidic groundwater may percolate and effortlessly flowed along the bedding planes which cause the precipitation of nodules and chert stringers. As mentioned before, dammam formation is conspicuously karstified which promote cavities, this aspect is a consequence of solubility of dissolved rocks such as carbonate and evaporates [8]. In addition, most of the south Iraqi fields are anisotropic in term of stresses; consequently the digenesis process stimulates the fracture generation to be perpendicular on the minimum horizontal stress. Further, the probability of fractures occurring in carbonate rocks is greater than the probability of occurring in sandstone with the exception of extreme low porosity sandstone [9]. All previous factors created a net of natural fractures along the section of dammam rocks. The natural fractures can be detected magnificently through the borehole imager tools such as Formation Micro Imager (FMI) and Ultrasonic Borehole Imager (UBI) (Figure 4). It is specified as sinusoidal features on FMI, in some cases the characteristics of NF is very identical to some geological features such as bedding planes and lamination [10].

Figure 4: Ultrasonic Borehole imager in dammam formation.
Materials and Methods
In situ stresses
Essentially, the in situ stresses are identical with the horizontal and vertical directions. Accordingly, the stresses can be categorized into vertical and two horizontal stresses. Nevertheless, the existence of some geological features like salt dome may perturbate the stresses distribution [11]. According to the Anderson’s fault classification, the fault can be normal, strike slip or reverse fault depending on stress distribution. Normal fault if the vertical stress σv is the dominant followed by maximum horizontal stress σH, Strike Slip Fault (SSF) in case of (σH>σv>σh) and reverse fault when (σH>σh>σv). Oblique slip may hit at abyssal depths over thirty kilometers with simultaneous vertical and horizontal movement due to the inconsistency of principle stress with respect to the horizontal and vertical orientations [12]. Faults are triggered in specific orientation depending on the stress’s magnitude and direction in accordance with the frictional faulting theory [13].
Geostatic vertical stress or overburden stress (σv) can be simply defined as the stress that result from the cumulative weight of the rocks which saturated by fluids. σv is considered a principal stress in oil industry, it can be defined with Equation 3 assuming homogeneous rocks in lateral direction with horizontal leveled layers, otherwise the calculation is totally complicated [14]. Vertical stress is demonstrated based on followed equilibrium equations.
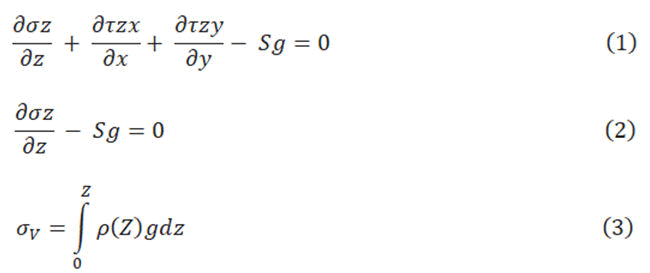
Where ρ stands for rock density, Z is vertical depth; g is acceleration of gravity [14]. Seismic velocity and density log can be employed to calculate vertical stress (Figure 5).

Figure 5: Integrated geostatic vertical stress, defined from density log in dammam.
Geostatic horizontal stresses are the basis in geomechanics modeling of wellbore stability, sand production and hydraulic fracturing. As long the stress path and sedimentation history are the major reasons for the difficulty in finding accurate direct methods of horizontal stresses measurements. Minimum horizontal stress is measured by means of hydraulic fracturing and leak off test while the maximum horizontal stress is predicted, no direct technique is available for that purposes [15]. Therefore, high uncertainty may experience especially in σH anticipation. Some approaches are convenient for horizontal stresses assessment, such as differential strain curve, anelastic strain recovery and differential wave velocity analysis, but these techniques may face three major obstructions. First, anelastic strains may develop in 10-50 hours while the test of core sample must be implemented in less than this time; secondly, oriented core is required; lastly, in fractured or anisotropic rocks the interpretation is laborious [16]. To avoid such a difficulty, two models have been utilized to create a continues profile of horizontal stresses: Poro-elastic horizontal strain model and Mohr-Coulomb stress. These two empirical equations were calibrated with Hydro-Frac data in two points that are deeper than dammam formation just for comparison reasons. Poroelastic strain model gave good results while the trend of minimum horizontal stress in Mohr-Coulomb stress method is far from the hydro-frac points. On the other hand, frictional faulting theory has been employed at deeper points as well to create stress polygon in order to minimize the uncertainty of the maximum horizontal stress. The most reliable indirect way to construct uninterrupted trend of horizontal stresses is the poro elastic horizontal strain model (Figure 6).

Figure 6: Horizontal stresses of Dammam formation predicted according to the poro elastic horizontal strain model.
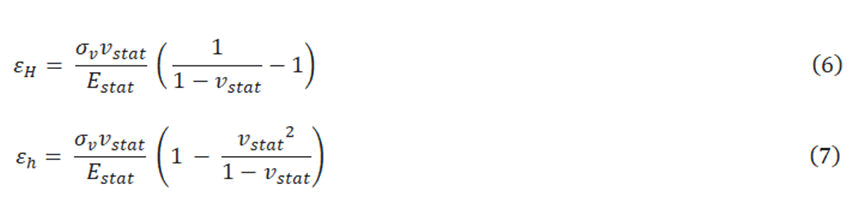
However, this model takes into account the horizontal strain and distortion impact, that is way Hooke’s law, overburden stress, poisson ratio, Biot’s coefficient and young’s modulus are utilized to demonstrate the final equations.
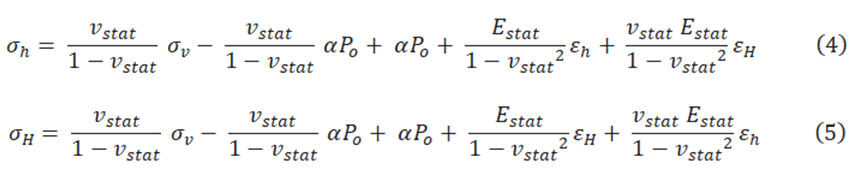
Where Estat stands for static young’s modulus, Po is pore pressure, vstat is static poisson ratio and α is Biot’s constant, εh, εH are minimum horizontal strain and maximum horizontal strain respectively, they can be determined from equations 6 and 7 [17].
Mohr-Coulomb stress model is generally implemented; it is not dedicated for a specific region whether in compressional or extensional tectonic activities. The principle of the model depends on the rock shear strength that rules the maximum principal stress in Mohr-Coulomb envelope. However, it has been executed but with extensive uncertainty in comparison with Hydro-Frac points in deeper depth of the field. In addition, frictional faulting theory can be devoted to emphasizing the results of the obtained maximum horizontal stress from poro elastic Horizontal strain model. The stress polygon in this method constrains the σH between lower and upper limit depending on frictional faulting, wellbore stresses and breakout width (Figure7).

Figure 7: Horizontal stresses of dammam formation predicted according to the Mohr-Coulomb model.
Results and Discussion
Pore Pressure (PP)
Pore pressure is the other main parameter in geomechanics planning stage; it governs the effective stresses according to the Terzaghi’s principle and biot’s effective stress. On that account, creating ceaseless trend of pore pressure in dammam formation is immensely important for calibration reasons with recorded pressured points and consequently establishes trustworthy 1D MEM. Some empirical equations are feasible to estimate the pore pressure from well logging and seismic interval velocity, some of which are explicit while the others are normal trends. These methods are Hottmann and Johnson, Eaton’s resistivity, Eaton’s sonic, Bowers and Holbrook. Most of these approaches are devoted to predicting pressure in shale (mudrock), for the sandstone and carbonates; PP can be determined by either utilizing centroid method or supposing that the sandstone or carbonate pore pressure is equal to that of shale. Hence, compressional transit time from sonic log is applied in equation 8 to estimate the PP.
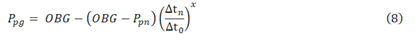
Where OBG is the overburden gradient, Ppn stands for normal or hydrostatic pore pressure, Δtn is sonic transit time in normal pressure status, Δt0 is the measured sonic transit time. Eaton’s sonic is adapted for PP assessment in this paper, it is appropriate in young sedimentary basins where the overpressure occur due to the under compaction process in shale, it cannot be implemented in geological structures that suffered from loading/unloading sequence [18]. However, Figure 8 illustrates the pore pressure trend, the black dotes are the pore pressure points that measured with the Reservoir Characterization Instruments (RCI) and there is good matching between recorded and predicted values.

Figure 8: Pore pressure assessment with Eaton’s slowness logs.
Elastic modulus
If the stress strain correspondence is one to one, the geometrical would be in elastic conditions and it obeys the theory of elasticity. However, the deformation of such a material will be in infinitesimal scale, so no considerable volumetric or tangential strain within the rocks that are exposed to hydrostatic compression or shear stresses. Therefore, once the applied stress is removed the stressed rock retrieves its physical status. The rock mechanics in subsurface conditions is extremely complicated, that is why the theory of elasticity is implemented for ease of analysis. The constants of elasticity are obtained from.
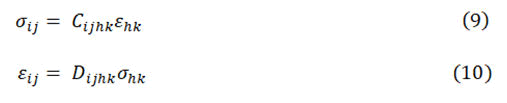
Where, Cijhk stands for fourth order stiffness tensor and Dijhk is fourth order compliance tensor, these two tensors are composed of 81 elastic constants, 36 of which are independent. The geomaterial that has the same elastic constant at every single point within the medium are elastically homogeneous, while it is iperelastic if shows physical symmetry as per voigt notation. Therefore, the number of elastic constants which are independent shrink into 21 components, while the constants are only “bulk and shear modulus” or “poisson’s ratio and young’s modulus” in isotropic linear elastic material.
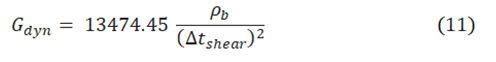
Shear modulus (G) is the tangential or shear deformation that rocks may suffer because of the shear stresses, while it is trivial in fluid due to the imperceptible fluid shear strength. Dynamic shear modulus (Gdyn) is anticipated by equation 11 depending on density and shear wave velocity.
In addition, bulk modulus (K) is the stiffness evaluation of the rocks that are under hydrostatic compression circumstances [19].
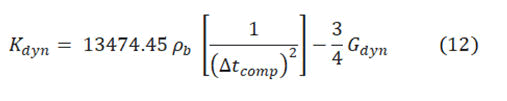
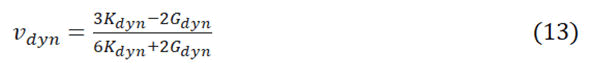
Dynamic bulk modulus (Kdyn) is predicted by means of equation 12 depending on compressional, shear waves and density logs. The other elastic modulus is poisson’s ratio (ν), in geomaterial ν is the measurement of the lateral strain which relied on the direction of the applied forces and the longitudinal strain orientation in anisotropic rock, whereas in isotropic rocks the value of poisson’s ratio is independent of applied forces orientation. Dynamic poisson’s ratio in continuous trend is built according to equation 13, and then static ratio is derived from the dynamic value. No laboratory tests are available in this interval for calibration and consequently the empirical equations can only be tested in matching the final 1D MEM with caliper log.
The other essential elastic constant is young’s modulus (E), in the theory of elasticity; the relationship that links the stress with strain is the Young’s modulus. This constant is extremely important to define the stiffness of geomaterials which are subjected to uniaxial compressional stresses. This constant can be determined from equation 14 according to the results of the bulk and shear modulus.
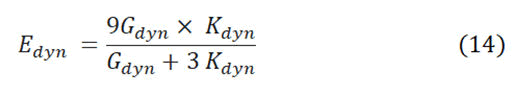
The extraction of static young’s constant from dynamic one can be implemented with different mathematical techniques such as plumb bradford, morales, modified morales and John fuller correlation. The reason of such a correlation is that the elastic constants are relied on sonic velocity. Therefor the outcomes of traditional sonic logs may not give an accurate result with respect to the laboratory test especially in the medium that characterized by high porosity and discontinuity [20]. In this paper, John fuller correlation equation 15 is adapted from Figure 9 because it is one of the most plausible approaches and it has been applied in North sea for sandstone investigation [21]. The dynamic young’s modulus can be four to eight times of static one, many reasons may control the discrepancy between dynamic and static models, but in general dynamics are the most precise. Frequency variations is the major reason for such inconsistency, the static constants of rocks are extracted from laboratory tests that executed with 100 kHz to 1 MHz. On the other hand, the dynamic elastic constants are acquired from wireline logs that implemented with low frequency 10 kHz-20 kHz. Hence, the deformation in dynamic moduli is excessively inconsiderable, whereas in static ones are relatively large [22]. Moreover, dynamic constants are recorded in undrained conditions while most of statics constants are in drained conditions. Eventually the unloading-reloading processes may aggravate the discrepancy where the rocks stiffness in the first loading is greater than that in case of unloading reloading rounds.

Figure 9: Poisson’s ratio demonstrated and young’s modulus.
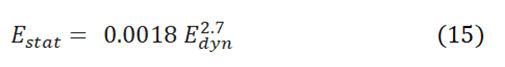
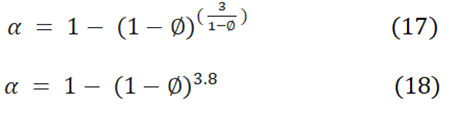
The last elastic constant is the Biot coefficient (α), it is a function of the compressibility in solid grains and rock skeleton. In another meaning, it is the change of the pore volume with respect to the rock bulk volume α is determined from equations 16 [23].
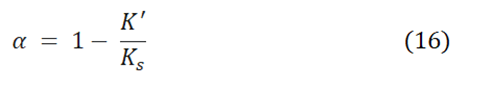
Where, K’ is the rock skeleton drained bulk modulus, Ks stands for the bulk modulus of the solid grains. The coefficient is one of the geophysical log derived parameters; Biot and Willis were the first persons who extract the Biot constant [24]. Krief in 1990 employed equation 17 to define α from gamma ray of dry rocks, while Wu in 2001 utilized equation 18 in consolidated rocks.
Rock mechanical strength parameters
The mechanical strength of the sedimentary rocks is highly controlled by some features like deposition environment, structure and texture of the rocks. Subsequently knowledge of such features may greatly assist in a deep understanding of failure mechanism and deformation. In addition, the external ambient like geological environment and stresses around the rocks of interest govern the mechanical properties. Rocks are classified into isotropic and anisotropic, isotropic when the exerted force at any orientation gives identical mechanical properties, other than that the rocks are anisotropic. Moreover, rocks are assorted into intrinsic and structural anisotropic rocks. Intrinsic anisotropic if the rock strength is depending on the orientation of the applied stresses and structural due to the pretense of discontinuities such as bedding planes and foliations. Most of the sedimentary rocks are anisotropic due to the existence of weakness plane and fabric. The anisotropy develops during sedimentation process when the grains or clasts obey the water direction while deposition [25]. The rock strength and the applied stresses magnitude control the intensity of rock deformation; hence the stress strain curve (constitutive law) can describe this sort of distortion. However, the deformation of rocks due to the effect of the applied forces can be reported by constitutive law. When the applied stresses are significantly small, there will be linear behavior otherwise the demeanor is non-linear, this dictates to categorize the stress strain response into elastic, plastic, viscous and viscoelastoplastic. In practice, the rocks mechanical behavior is non-linear elastic and anisotropic, but in modeling the rocks are supposed linear elastic and isotropic homogeneous.
Uniaxial compressive strength is indispensable parameter in geomechanics; it plays a crucial role in constraining the value of maximum horizontal stress in frictional faulting theory, proper selection of failure criterion and modeling the wellbore stability. The effect of UCS on the wellbore stability is higher than the impact of wellbore trajectory, mud weight and water interaction effect. Therefore, the compressive strength should be determined cautiously, either by means of the direct method in laboratory or by log derived empirical equations. There are some considerable tests which are utilized to measure the UCS like triaxial test, unconfined compression test and thick wall cylinder test. Triaxial and uniaxial are the most trustworthy tests to define the UCS despite some technical difficulties that may occur during tests or while the interpretation particularly in shale and clay [26]. In addition, the lack of core samples and the high cost of laboratory tests may restrict the investigated interval that is why the geophysical logs can be employed to derive the UCS along the interval of the interest. The log data like sonic, gamma ray and density logs are utilized for that purpose and in order to test the reliability of the results, it is matched with the laboratory test. In the dammam interval there is no tri axial test data for calibration, but results of the MSE was employed to validate the log derive results (Figure 10). MSE is the total energy that is applied on a drilling bit to obtain the required penetration rate according to equation 19 [27].
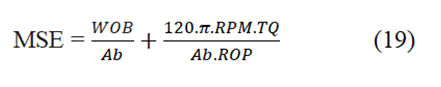
Where, WOB stands for weight on bit, Ab is the bit area, RPM is bit revolution per minute and TQ is torque.
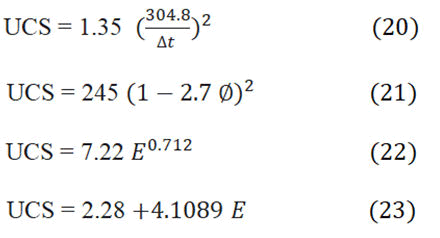
There are many empirical equations that have been written to define the UCS in clastic and chemical rocks, Zoback MD, presented some of mathematical equations for carbonates, sandstone and shale. Where equation 20 is devoted for compacted hard shale, equation 21 is for sedimentary formation, equation 22 is proposed for Shale and equation 23 is recommended at any spot around the world.
Shear strength is the ultimate magnitude of shear stress that rocks or soil may resist before failure. In other words, it is defined as the rock grains or particles reluctance to distortion; it is highly affected by weakness plane and water content. The shear strength parameters are friction angle (φ') and rock cohesion (C'), the deformation occurs at maximum shear stress (τmax) that override the friction angle and cohesion. Friction angle is the measurement of shear strength in rocks due to the friction, while cohesion is the forces which bind grains or particles with each other through cementation among sand grains or electrostatic forces in clay particles [28]. Shear strength parameters can be defined directly in laboratory in Triaxial and Uniaxial test or they can be derived from logging data.
The other strength parameter is the tensile strength (T0), it is one of the most ungovernable variables to be defined in laboratory tests. T0 is substantial component in maximum and minimum horizontal stresses calculations. It is considered in consolidated and compacted formations while, it is ignored in fragile unconsolidated formations. Tensile strength is measured by means of direct or indirect techniques, direct with uniaxial tensile strength and indirect with Brazilian test. In the direct uniaxial tensile test, uniform and uniaxial stress must be applied on the rock sample, other than that the uncertainty will be appreciable. In addition, the misalignment of the rock sample within the test apparatus may lead to development of bending moment. Finally, the stress intensity at the ends of specimen can cause premature failure at the holding points. With all these drawbacks the implementation of uniaxial tensile test with certain outcomes is intractable; therefore the indirect methods are the most common for that purpose [29]. Brazilian test is one of the most practical methodologies to determine an approximate magnitude of tensile strength, in Brazilian test the cylindrical rock sample has diameter which is equal or larger than the specimen length. However, the stress is applied on the sample within two platens that surround the specimen circularly. Therefore, normal tensile stress is developed on the vertical diameter of the cylinder induced by compressional stress; on the other hand the zone around the center remains constant. Hence, the stress will be at its maximum magnitude at the area which is close to the center, equation 24 is devoted to define such a stress.
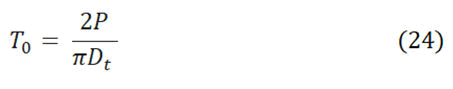
Where, P stands for the failure load, D is the diameter of the specimen. Continuous profile of tensile strength is created in dammam formation based on the results of the uniaxial compressive strength according to equation 25 and (Figure 10).
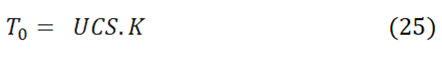
Where, K is the factor that relies on the facies of the area, compressive strength is assumed to be ten to twelve times the magnitude of T0 in all facies. This assessment may not be accurate for some reason, like the presence of micro cracks as per Griffith theory, the lamination orientation that is based on the weakness plane model, type of lithology, and lastly the compaction of the rocks (Figure 10).

Figure 10: Tensile strength derived from uniaxial compressive strength.
Failure criteria
Several failure criteria have been designed to be suitable for geomechanical studies, the selection of relevant failure envelope is undoubtedly substantial in compressive, tensile and shear failure definition. Some of envelope consider only the impact of the maximum and minimum principal stresses and ignore the intermediate stress therefore they are two dimensions; these types are prevalent for ease of application in practice. On the other hand, some of the criteria are three dimensions; they take into account the influence of the intermediate principal stress on the rock mechanical properties. They are the most sophisticated envelopes but more complicated because the poly axial test is required to determine the magnitude of the intermediate stress. The outcomes of the two dimensions envelope can be underappreciated in comparison with respect to the three dimensions criteria and consequently the rock mechanical strength is possibly overestimated. The main obstacle in utilizing any failure criterion that considers the effect of the intermediate stress is the requiring of the true triaxial or poly axial test. Conversely, any indirect technique to invent the magnitude of σ2 from the traditional triaxial test or from geophysical logs may influence the ultimate results. In this paper, there is no poly axial test or even triaxial and Brazilian test; therefore the only log derived parameters have been employed to construct the failure criteria.
In Mohr-Coulomb envelope the shear, tensile and compressive strength are possibly attached within the largest Mohr circle or the maximum shear stress where the substance can withstand. If the compressive stress is exerted on rock specimen, shear stress may evolve on a plane and in consequence failure can happen when the stress overrides the friction angle and the inherent shear strength of the rock (C') Mohr coulomb is commonly used in wellbore stability and geomechanics analysis due to its intelligibility. The envelop has been implemented in this paper to create Mud Window (MW) and match the outcomes with the caliper log and well conditions. MW is the constraining of the mud weight between upper allowable limit to avoid tensile failure and lower tolerable magnitude to be away from shear failure and well kick. The following equations were employed in (Tables 1 and 2) to construct the whole mud window.
| Borehole stresses | Mohr-Coulomb for Shear failure |
|---|---|
| σz' ≥ σθ' ≥ σr' | Pw(BO)=(σν+2ν(σmax-σmin)-UCS)/(tan2(π/4+Φ'/2)) |
| σθ' ≥ σz' ≥ σr' | Pw(BO)=(3σmax-σmin-UCS)/(1+tan2(Φ/4+Φ'/2)) |
| σθ' ≥ σr' ≥ σz' | Pw(BO)=3σmax-σmin-UCS-(σν+2ν(σmax-σmin)) (tan2(Φ/4+Φ'/2)) |
Table 1: Mohr-Coulomb equations for shear failure in vertical well.
| Borehole stresses | Mohr-Coulomb for Tensile failure |
|---|---|
| σr' ≥ σθ' ≥ σz' | Pw(frac)=UCS+(tan2(π⁄4+φ'⁄2)) (σν-2ν(σmax-σmin)) |
| σr' ≥ σz' ≥ σθ' | Pw(frac)=(UCS+(3σmin-σmax)(tan2(π⁄4+φ'⁄2))⁄(1+tan2(π⁄4+φ'⁄2)) |
| σz' ≥ σr' ≥ σθ' | Pw(frac)=(UCS-σν+2ν(σmax-σmin))⁄(tan2(π⁄4+φ'⁄2))+(3σmin-σmax) |
Table 2: Mohr-Coulomb equations for tensile failure in vertical wells.
Figure 10 shows that the uniaxial compressive strength is lower than 2000 psi along dammam formation with the exception of the bottom and top sections. Consequently, tensile fractures have been anticipated by the failure criterion due to the weakness of the formation. Furthermore, the tensile fracture orientation is 60° and 240° which is parallel to the orientation of the maximum horizontal stress. On the other hand, the drilling report refers to the occurrence of severe to total mud losses while drilling in theses intervals. Sensitivity analysis has been implemented at 770 m in dammam interval to define the MW. The analysis is devoted for vertical, horizontal and deviated wells at any direction. However, the results which depicted in Figure 11 emphasize that the highest desired mud weight to keep away from Shear failure is conceivable in the orientation of the minimum horizontal stress with inclination of 65°. Likewise, the tensile failure cannot be avoided at high mud weight in the minimum horizontal stress orientation with 60° of deviation.
In Mogi-Coulomb criterion the impact of the intermediate principal stress is considered, Mogi inferred that the fracture plane is elongated to be in the direction of σ2. However, the fracture can be avoided due to the mean normal stress σ2m not octahedral normal stress σoct. Mogi assumed that the energy of distortional strain is proportionate with the octahedral normal stress. Therefore, any increment in σ2m will lead to rising of σoct and consequently the failure can occur. Al-Ajmi and Zimmerman postulated a linearized criterion in the domain of Mogi (σoct and σ2m) based on the experiments, they supposed that the Drucker-Prager overestimated the rock strength while it was underestimated by Mohr. Mogi-Coulomb envelop is carried out to determine the wellbore stability in dammam formation after the application of Mohr-Coulomb. The influence of the intermediate principal stress is considered in Mogi criterion and this impact the results especially in appreciable anisotropic in-situ stresses because there is no direct technique to calibrate the anticipated σH. In addition, Mogi is practical in all the stress states. The following demonstrations are dedicated to derive the ultimate equations to be utilized in this paper to build the MEM (Tables 3 and 4).
| Borehole stresses | Mogi-Coulomb for Shear failure |
|---|---|
| σz' ≥ σθ' ≥ σr' | Pw(BO)=1/(6-2b'2)((3D+2b'K)+√(H+12(K2+b'DK)) |
| σθ' ≥ σz' ≥ σr' | Pw(BO)=(D/2)-(1/6)(√(12(a'+b'D)2-3(D-2E)2)) |
| σθ' ≥ σr' ≥ σz' | Pw(BO)=1/(6-2b'2)((3D-2b'G)+√(H+12(G2+b'DG)) |
| Note: H=D2(4b'2-3)+(E2-DE)(4b'2-12), K=a'+b'E, G=K+b'D | |
Table 3: Mogi-Coulomb equations for shear failure in vertical well.
| Borehole stresses | Mogi-Coulomb for Tensile failure |
|---|---|
| σr' ≥ σθ' ≥ σz' | Pw(Frac)=(1/(6-2b'2))((3A+2b'N)+√(J+12(N2+b'AN))) |
| σr' ≥ σz' ≥ σθ' | Pw(Frac)=(A/2+1/6)√(12(a'+b'A)2-3(2AB)2) |
| σz' ≥ σr' ≥ σθ' | Pw(Frac)=(1/(6-2b'2))((3A+2b'M)+√(J+12(M2+b'AM))) |
| Note: J: D2(4b'2-3)+(E2-DE)(4b'2-12); M: N+b'D, N:a'+b'(E-2Po), A: 3σh-σH, B: σν-2ν(σH-σh), D: 3σH-σh, E: σν+2ν(σH-σh), a': 2Ccosφ', b': sinφ' | |
Table 4: Mogi-Coulomb equations for tensile failure in vertical well.

Figure 11: Mogi, Stassi d’Alia and Mohr-Coulomb models present no variation in predicted high angle echelon shear failure. Similarly, Mogi and Mohr anticipated the same tensile failure. There is significant dissimilarity in sensitivity analysis between Mogi, Stassi d’Alia and Mohr models. The tensile prediction is completely convenient in Mogi, Mohr and Stassi d’Alia criteria.
The last failure envelope that implemented in this work is Stassi d’Alia criterion; it is a straightforward strength criterion that yields the uniaxial tensile strength and uniaxial compressive. The equation of this criterion was just mentioned in ‘Fundamentals of rock mechanics’ by Jaeger and Cook. Equation 25 had been postulated by Stassi in 1967. Interestingly, Mogi-Coulomb and Stassi d’Alia behave similarly in the wellbore stability analysis.

Conclusion
This paper was dedicated for geomechanical analysis of dammam formation. Real data have been employed to define the parameters of the rock mechanical strength, elastic moduli, formation in situ stresses and pore pressure. The results of calculation were then utilized to establish the mechanical earth model within the Mohr coulomb, Mogi coulomb and Stassi d’Alia criteria. Shear and tensile failure have been evaluated based on the actual mud weight that used while drilling and then all the predicted failure models were compared with the borehole shape. Moreover, sensitivity analysis was executed for each criterion in the most critical point along the drilled interval in order to define the desired mud weight for each wellbore trajectory. The whole condition may exaggerate the uncertainty because the models are based on the wire line logs and any borehole enlargement can extremely impact the predicted MEM parameters.
Author Contributions
Jawad Alshakban realized the concept and wrote the first draft of the manuscript, investigated the log and prepared the raw data to be utilized in the final calculations; Doaa Faleh review and provide software access; Wafaa Al-Shatty, and Raffaele Romagnolid reviewed the paper many times and promoted spelling and strengthen the language of the manuscript.
Acknowledgements
The Eni oil company and Basra oil company are acknowledged for the M.Sc. scholarship (J.K.A) and data.
References
- Jassim SZ, Goff JC, Editors. Geology of Iraq. DOLIN, sro, distributed by geological society of London; 2006. [Google Scholar]
- Pasic B, Gaurina Medimurec N, Matanovic D. Wellbore instability: Causes and consequences. Rud Geolosko Naft Zb. 2007;19(1):87-98. [Google Scholar]
- Abdideh M, Alisamir S. Analysis of deep stress field using well log and wellbore breakout data: A case study in Cretaceous oil reservoir, southwest Iran. Geod Cartogr. 2018;44(4):113-128. [Crossref] [Google Scholar]
- Li D, Wong LN. The Brazilian disc test for rock mechanics applications: Review and new insights. Rock Mech Rock Eng. 2013;46(2):269-287. [Crossref] [Google Scholar]
- Tranggono H. Wellbore collapse failure criteria and drilling optimization. Master's thesis, university of Stavanger, Norway. 2019. [Google Scholar]
- Tanoli SK, Al-Bloushi AJ. Depositional history of the eocene Dammam formation in Kuwait. SPE Kuwait oil and Gas show and Conference, Kuwait City, Kuwait, October 2017. 2017:SPE-187628-MS. [Crossref] [Google Scholar]
- Shafiei A, Dusseault MB, Kosari E, Taleghani MN. Natural fractures characterization and in situ stresses inference in a carbonate reservoir-An integrated approach. Energies. 2018 Feb 1;11(2):312. [Crossref] [Google Scholar]
- Bailey AH, King RC, Holford SP, Sage JM. Variation of natural fracture orientations in the carnarvon basin's rankin platform and dampier Sub-Basin, NWS, Western Australia. ASEG Extended Abstracts. 2015;2015(1):1-4. [Crossref] [Google Scholar]
- Celerier B. Seeking Anderson's faulting in seismicity: A centennial celebration. Rev Geophys. 2008;46(4). [Crossref] [Google Scholar]
- Beeler NM, Hirth G, Thomas A, Burgmann R. Effective stress, friction, and deep crustal faulting. J Geophys Res: Solid Earth. 2016;121(2):1040-1059. [Crossref] [Google Scholar]
- Guangzhi Y, He L, Xuefu X. The effect of the stress path on strength of rock. The 29th U.S. Symposium on Rock Mechanics (USRMS), Minneapolis, Minnesota. 1988. [Google Scholar]
- Kidambi T, Kumar GS. Mechanical earth modeling for a vertical well drilled in a naturally fractured tight carbonate gas reservoir in the Persian Gulf. J Pet Sci Eng. 2016;141:38-51. [Crossref] [Google Scholar]
- Zhang J. Pore pressure prediction from well logs: Methods, modifications, and new approaches. Earth Sci Rev. 2011;108(1-2):50-63. [Crossref] [Google Scholar]
- Ameen MS, Smart BG, Somerville JM, Hammilton S, Naji NA. Predicting rock mechanical properties of carbonates from wire line logs (A case study: Arab-D reservoir, Ghawar field, Saudi Arabia). Mar Pet Geol. 2009;26(4):430-444. [Crossref] [Google Scholar]
- Bradford ID, Fuller J, Thompson PJ, Walsgrove TR. Benefits of assessing the solids production risk in a North Sea reservoir using elastoplastic modelling. InSPE/ISRM Rock Mechanics in petroleum engineering. 1998. [Crossref] [Google Scholar]
- Mashinsky EI. Differences between static and dynamic elastic moduli of rocks: Physical causes. Russ Geol Geophys. 2003;44(9):953–959. [Google Scholar]
- Selvadurai P, Selvadurai PA, Nejati M. A multi-phasic approach for estimating the biot coefficient for grimsel granite. Solid Earth. 2019;10(6):2001-2014. [Crossref] [Google Scholar]
- Civan F. Effective-stress coefficients of porous rocks involving shocks and loading/unloading hysteresis. SPE Journal. 2021;26(1):44-67. [Crossref] [Google Scholar]
- Schlunegger F, Garefalakis P. Clast imbrication in coarse-grained mountain streams and stratigraphic archives as indicator of deposition in upper flow regime conditions. Earth Surf Dyn. 2018;6(3):743-761. [Crossref] [Google Scholar]
- Garcia RA, Saavedra NF, Calderon-Carrillo Z, Mateus D. Development of experimental correlations between indentation parameters and Unconfined Compressive Strength (UCS) values in shale samples. CT y F. 2008;3(4):61-81. [Google Scholar]
- Chen X, Yang J, Gao D. Drilling performance optimization based on mechanical specific energy technologies. Drilling. 2018;1:133-162. [Crossref] [Google Scholar]
- Komurlu E, Demir AD. Determination of cohesion values of rock m using double shear Jaws. Periodica Polytechnica. Period Polytech: Civ Eng. 2018;62(4):881-892. [Crossref] [Google Scholar]
- Briševac Z, Kujundzic T, Cajic S. Current cognition of rock tensile strength testing by Brazilian test. Rud Geolosko Naft Zb. 2015;30(2):101-128. [Crossref] [Google Scholar]
- Song I, Haimson BC. Polyaxial strength criteria and their use in estimating in situ stress magnitudes from borehole breakout dimensions. Int J Rock Mech Min. 1997;34(3-4):116-126. [Crossref] [Google Scholar]
- Aslannezhad M, Jalalifar H. Determination of a safe mud window and analysis of wellbore stability to minimize drilling challenges and non-productive time. J Petrol Explor Prod Technol. 2016;6(3):493-503. [Crossref] [Google Scholar]
- Al-Ajmi AM, Zimmerman RW. Stability analysis of deviated boreholes using the Mogi-Coulomb failure criterion, with applications to some oil and gas reservoirs. IADC/SPE Asia Pacific drilling technology conference and exhibition, Bangkok. 2006. [Crossref] [Google Scholar]
- Gholami R, Moradzadeh A, Rasouli V, Hanachi J. Practical application of failure criteria in determining safe mud weight windows in drilling operations. J Rock Mech Geotech Eng. 2014;6(1):13-25. [Crossref] [Google Scholar]
- Astrand GJ. Borehole stability: Comparing the deviation sensibility of different failure criteria. Master's thesis, Norwegian University of Science and Technology. Norway. 2015:127. [Google Scholar]
- Horsrud P. Estimating mechanical properties of shale from empirical correlations. SPE Drill and Compl. 2001;16(2):68-73. [Crossref] [Google Scholar]
Citation: Alshakban J, Al-Shatty W, Albaaji D, Romagnolid R (2023) Geomechanics Modeling and Tensile Failure in Karstified dammam Formation. J Pet Environ Biotechnol. 14:501
Copyright: © 2023 Alshakban J, et al. This is an open access article distributed under the terms of the Creative Commons Attribution License, which permits unrestricted use, distribution, and reproduction in any medium, provided the original author and source are credited.